The Physics in Food Manufacturing (PiFM) Conference earlier this month, organized by the Institute of Physics, featured a diverse menu of innovative physical techniques for the spatial interrogation and chemical mapping of food products and their constituent materials. Here’s a brief taster of just a few of the presentations to whet your appetite.
More bubbles, fewer calories
The fight against obesity proceeds on many fronts. For manufacturers of sweets and confectionery, one promising line of attack is to reduce the calorific value of their food products by using edible oil-based foams (or oleofoams) to prepare aerated chocolate bars, mousses and the like. Edible oleofoams comprise a liquid oil phase, air bubbles and a high-melting-point crystalline phase to stabilize the bubbles – a complex microstructure that in turn determines the macroscopic chemical, physical and nutritional properties of the final food product.
With this in mind, Lorenzo Metilli and colleagues in the School of Food Science and Nutrition at the University of Leeds, UK, are pioneering the use of ultrasound spectroscopy for in situ characterization of oleofoams in the food-processing line. The team reported analyses of several oleofoams, with varying lipid composition, aeration protocols and age, using broadband ultrasonic transducers in reflection mode and transmission mode. “The results show how [through-air] ultrasound spectroscopy can be a valuable tool for determining bubble-size distribution – a central feature for characterizing an oleofoam,” say the researchers.
Shedding light on the taste of chocolate
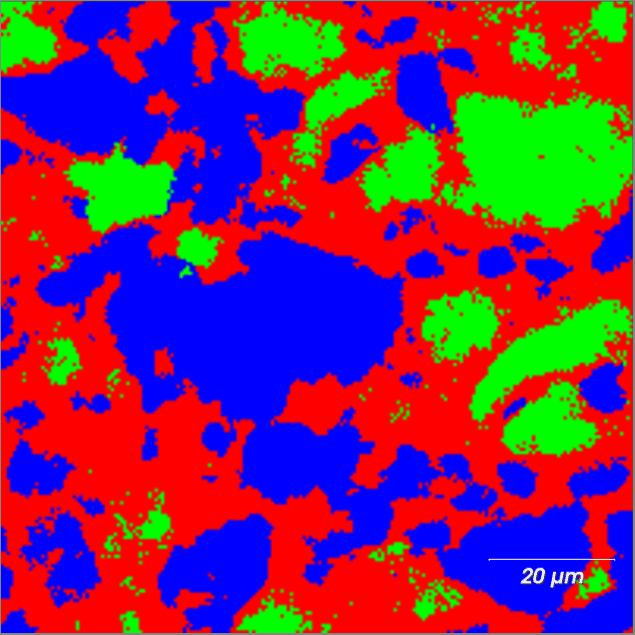
Raman spectroscopy is a non-contact, non-destructive technique that provides submicron information on the chemical and crystal structure of materials. In a series of proof-of-principle studies, Yan Wong and colleagues at Renishaw, the UK-based metrology and healthcare company, applied the technique to samples of chocolate to characterize the distribution of core ingredients such as fats and sugars – even in highly fluorescent samples such as milk chocolate.

The resulting insights, says Wong, could lead to changes in formulation and production that give improvements in the flavour, feel and stability of chocolate products. In another case study, Wong highlighted how Raman studies of bubble gum flagged up differences in the distribution of ingredients on the outside of the gum relative to the inside – differences which can affect the gum’s taste, function and stability during storage.
A hyperspectral take on meat and fish
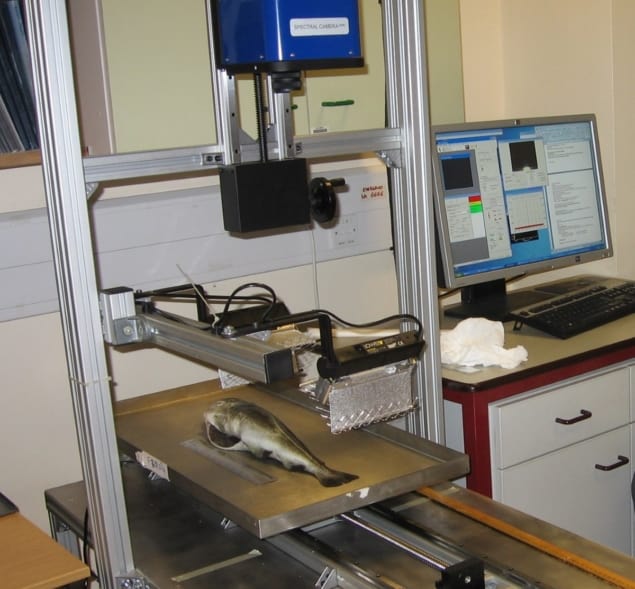
Near-infrared spectroscopy (NIR) is widely used by manufacturers for rapid analysis of bulk food composition, whether in the lab or online. Hyperspectral NIR imaging takes that capability a step further, providing spectroscopic data for each pixel in an image to map spatial distribution of composition.
Martin Whitworth, principal scientist at Campden BRI food-science research centre, explained how he and his colleagues use hyperspectral imaging to measure the distribution and migration of food components such as fat and moisture, as well as to “zero in” on specific regions of complex multicomponent products.
Among a raft of notable use cases flagged by Whitworth is the application of hyperspectral imaging to evaluate meat quality and the freshness of fish. For meat, the Campden BRI team analysed foreribs of beef for fatty-acid composition and to predict texture based on spectra for segmented fat and lean regions. For fish, the team measured several regions of whole cod and fillets to identify the best predictors of freshness.
Shredded wheat-yield forecasts
Wheat makes up 20% of all calories consumed by humans. Just as well then that improvements in farming practices saw global wheat yields increase threefold between 1960 and 2000. That’s still not enough, with some forecasters indicating a further 60% increase in yield is needed by 2050 to meet global demand. Enhanced output is driven by cross-breeding different varieties of wheat with desirable traits or “phenotypes”, such as drought and disease resistance, though for the cross-breeding process to be efficient scientists must be able to measure these traits in a quantifiable and accurate manner.
To this end, Imran Mohamed and colleagues at the National Physical Laboratory, UK, are evaluating 3D imaging technologies more commonly deployed in controlled indoor environments such as factories. In early-stage experiments on a small outdoor wheat plot, three techniques – multistereo imaging, an NIR time-of-flight system and a structured-light laser scanner – show varying degrees of promise for producing “point-clouds” that suitable for dimensional measurements such as wheat ear size and wheat height. “There are caveats,” says Mohamed, “as all of these technologies are currently susceptible to strong wind…and a lot more work is required before we have a system that can be used on the back of a tractor.”
Food security under scrutiny
“It’s not a question of if food fraud will occur, it’s unfortunately a case of when and how badly the food supply chain will be disrupted, whether this disruption is deliberate or accidental, and if this is potentially dangerous to human and animal health.” That was the cautionary note sounded by Roy Goodacre of the University of Liverpool, UK, in a keynote address to the PiFM conference that made the case for “capable guardian” technologies to provide real-time and in-situ policing of the food supply chain.

Physics and food: a multidisciplinary melting pot
Goodacre argues that a “point-and-shoot” approach based on Raman spectroscopy is an attractive candidate in this regard, offering handheld and through-container analysis that does not damage the sample or the container/wrapper. Among a number of case studies, Goodacre highlighted the use of surface-enhanced Raman scattering to detect “stretched” (adulterated) coconut water; also spatially offset Raman scattering for through-container analysis of counterfeit Scotch whisky and other spirit drinks.


