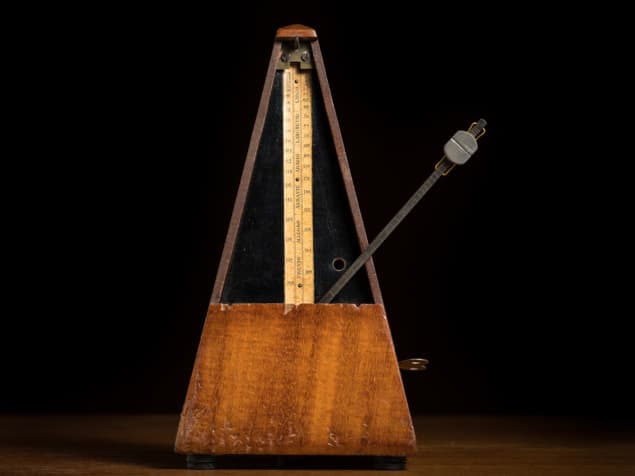
“Big data” has been a buzzword in scientific research for some time, but this week saw it applied to a longstanding puzzle in music history. The puzzle concerns metronomes, which are devices that make an audible click at regular intervals (traditionally set by the position of a weight on a pendulum) and are used by musicians to practice their timing.
The first such device was patented in 1815, and the great composer Ludwig van Beethoven (1770–1827) was quick to adopt it. The scores of many of his works use metronome markings to indicate how quickly he wanted the piece to be played, and he even attributed the success of his ninth symphony (with its famous “Ode to Joy” chorus in the final movement) to these new-fangled tempo instructions.
There’s just one problem: to most musicians, Beethoven’s metronome markings seem far too fast. And while tastes and tempi vary over time (not to mention between individual conductors), some of Beethoven’s instructions border on the unplayable. For example, the composer’s Op. 106 (the Hammerklavier sonata) starts out at 138 beats per minute for the half note – a value that physics student Almudena Martin-Castro and data scientist Iñaki Ukar describe as “decidedly unfeasible” in their recent paper on the subject.
Over the past 200 years, music scholars have put forward many potential explanations for this discrepancy. One of the most intriguing is that Beethoven’s metronome might have been badly made, incorrectly marked, or both – a distinct possibility given the vagaries of early 19th-century manufacturing.
To investigate this hypothesis, Martin-Castro and Ukar, who are both at the Universidad Carlos III de Madrid and UNED in Spain, began by using big data techniques to analyse 36 recordings of each movement of Beethoven’s symphonies, as interpreted by 36 different conductors. After analysing all 169 hours of music, they found that even conductors who profess a devotion to Beethoven’s original instructions consistently play the music slower than the composer’s marks indicate.
Next, Martin-Castro and Ukar developed a mathematical model of Beethoven’s metronome. This model was based on a double pendulum, and incorporated corrections for the amplitude of the pendulum’s oscillation, the friction of its mechanism, the impulse force, and the mass of its rod (an aspect that had not been considered in previous work). Using this model, they explored ways in which the metronome might have been faulty. Had part of the weight been broken off – perhaps by being hurled across the room by the famously irascible composer? Had the friction of the pendulum increased through poor lubrication? Or was the device tilted, leaning over the piano as Beethoven was composing his music?

The Newton-Beethoven analogy
While none of these hypotheses produced a homogeneous slowdown in tempi, the researchers eventually found one that did. It turns out that the deviation in written and played tempos exactly matched the diameter of the metronome’s weight, which suggests that Beethoven was mistakenly reading the wrong side of the scale. “We also found the annotation ‘108 or 120’ on the first page of the manuscript for his ninth symphony, which indicates that the composer doubted where he was reading at least once,” the researchers explain. “Suddenly, it all made sense: Beethoven was able to write down a lot of these marks by reading the tempo in the wrong place.”
Name that code
We love a good scientific acronym here at Physics World, and this week turned up a classic. While doing his PhD at the University of California Riverside in the US, astronomer Remington Sexton developed code to fit the spectra of active galactic nuclei (AGN) obtained via the Sloan Digital Sky Survey (SDSS). Because the code uses a method known as Bayesian decomposition analysis, it was entirely logical for Sexton to call it Bayesian AGN Decomposition Analysis for SDSS Spectra, or BADASS. Thoughtfully, Sexton has made his BADASS code free and open source, so anyone who wants to do some BADASS astronomy research with it can go and download it themselves. Now that’s a badass move.


