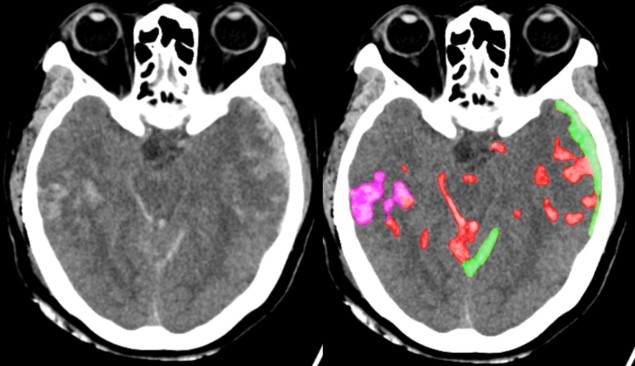
Head CT is used worldwide to assess neurological emergencies and detect acute brain haemorrhages. Interpreting these head CT scans requires readers to identify tiny subtle abnormalities, with near-perfect sensitivity, within a 3D stack of greyscale images characterized by poor soft-tissue contrast, low signal-to-noise ratio and a high incidence of artefacts. As such, even highly trained experts may miss subtle life-threatening findings.
To increase the efficiency, and potentially also the accuracy, of such image analysis, scientists at UC San Francisco (UCSF) and UC Berkeley have developed a fully convolutional neural network, called PatchFCN, that can identify abnormalities in head CT scans with comparable accuracy to highly trained radiologists. Importantly, the algorithm also localizes the abnormalities within the brain, enabling physicians to examine them more closely and determine the required therapy (PNAS 10.1073/pnas.1908021116).
“We wanted something that was practical, and for this technology to be useful clinically, the accuracy level needs to be close to perfect,” explains co-corresponding author Esther Yuh. “The performance bar is high for this application, due to the potential consequences of a missed abnormality, and people won’t tolerate less than human performance or accuracy.”
The researchers trained the neural network with 4396 head CT scans performed at UCSF. They then used the algorithm to interpret an independent test set of 200 scans, and compared its performance with that of four US board-certified radiologists. The algorithm took just 1 s on average to evaluate each stack of images and perform pixel-level delineation of any abnormalities.
PatchFCN demonstrated the highest accuracy to date for this clinical application, with an area under the ROC curve (AUC) of 0.991±0.006 for identification of acute intracranial haemorrhage. It exceeded the performance of two of the radiologists, in some cases identifying some small abnormalities missed by the experts. The algorithm could also classify the subtype of the detected abnormalities – as subarachnoid haemorrhage or subdural haematoma, for example – with comparable results to an expert reader.
The researchers point out that head CT interpretation is regarded as a core skill in radiology training problems, and that the most skilled readers demonstrate sensitivity/specificity of between 0.95 and 1.00. PatchFCN achieved a sensitivity of 1.00 at specificity levels approaching 0.90, making it a suitable screening tool with an acceptable level of false positives.
“Achieving 95% accuracy on a single image, or even 99%, is not OK, because in a series of 30 images, you’ll make an incorrect call on one of every two or three scans,” says Yuh. “To make this clinically useful, you have to get all 30 images correct – what we call exam-level accuracy. If a computer is pointing out a lot of false positives, it will slow the radiologist down, and may lead to more errors.”
According to co-corresponding author Jitendra Malik, the key to the algorithm’s high performance lies in the data fed into the model, with each small abnormality in the training images manually delineated at the pixel level. “We took the approach of marking out every abnormality – that’s why we had much, much better data,” he explains. “We made the best use possible of that data. That’s how we achieved success.”
The team is now applying the algorithm to CT scans from US trauma centres enrolled in a research study led by UCSF’s Geoffrey Manley.


