Last year my colleague Charles Adams and I were invited to write a Physics World Discovery ebook, where e means electronic. This was going to be something new, exciting – and, well, electronic – not a boring old paper book. But does the electronic medium bring anything new to publishing? Or is it just a term we stick on to everything, even plain old paper?
It was a question I started thinking about while writing our ebook Rydberg Physics, which was published late last year. While seeking answers to the question, I turned to the past.
The technologies we use to communicate observations about nature have changed dramatically over the years. In ancient Mesopotamia, people used imprints on clay tablets. Later came manuscripts and the printing press, while more recently we’ve seen graphical data representations, and audio and video recordings. And with the boom in computing power of everyday devices, it’s been possible to bring interactivity into play, initially through online quizzes and occasionally through interactive plots, although they often require cumbersome apps to be installed.
One thing, however, has never changed. We write stories, or – if you want to be technical about it – we pick a single path in a multidimensional space describing some system, and say what happens next. We tell stories because information presented in that way is easy to remember. That’s why we give talks and lectures, and why we write papers and textbooks.
What scientists should be doing with figures and diagrams is offering insights into “untold” stories too.
But even with multimedia, quizzes and simple interactive figures, we’re still just telling a single storyline. What scientists should be doing is offering insights into “untold” stories too. Sure, physicists use mathematical equations to manually explore the space of untold possibilities, but building appropriate examples from equations and representing them visually to help us think takes a lot of time.
I believe interactive figures can help by bridging the gap between different phenomena and between different stories. They allow physicists to freely explore multi-parameter spaces and – when combined with multiple representations of the same phenomena – they could help us to get more of an intuitive feel for equations. When endowed with enough parameters and flexibility, they are “toys for the mind” that can also allow unexpected uses, namely spotting new, interesting paths and letting us write new stories.

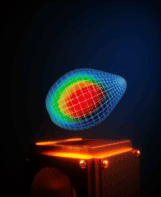
Take, for example, figure 9 from our Rydberg Physics ebook, which lets readers explore the 3D parameter space of an atomic medium. For each selected point, we offer two representations. One is macroscopic, showing how light slows as it propagates through the medium. The other is microscopic, showing states of two atoms in the medium. Some of the paths in this parameter space are discussed in the ebook, and correspond to stories of light storage, adiabatic control and interactions between single photons.
Crucially, we also see things that are not discussed explicitly. We see limiting cases – imperfections if you like – that force us to adopt different pictures, changing the story about what happens in the system. What’s more, in the continuum of parameter values lie exciting new answers to daring “What-if?” questions.
In fact, as you play with our interactive model, I’d say you’re training your brain to predict the behaviour of this simple system under different circumstances. The question is, though, does that also create physical intuition?
But interactive figures do more than just help scientists reading ebooks. They can also help the public handle complex questions, such as those involving energy and the environment. Such discussions are all too often polarised, resulting in a tug of war between extreme opinions that merely lead to stalemate and no action. I believe it’s our duty, as scientists, to give the public and policymakers the tools to understand the impact and consequences of scientific decisions. Information in diagrams and equations might be good for physicsists, but interactive figures will help non-scientists to really understand what the science is telling us.
Interactive figures will also help non-scientists to really understand what the science is telling us.
Consider, for example, this interactive text inspired by the work of Bret Victor. It describes the environmental consequences of different types of light bulb, with users discovering what happens simply by adjusting either words or numbers in the text. Wouldn’t it be great if we could represent even more fundamental scientific knowledge using similarly interactive documents?
The rise of Rydberg physics
To educate more people in a way that gives them freedom and power to innovate on their own is a difficult challenge. I’m aware, though, that it’s tricky to find the right medium for such matters. But it’s important stuff as it’ll dictate how fast our world can develop.
So are interactive eBooks part of solution? I believe so. After all, simple standard languages like HTML and JavaScript work across devices and can be packaged in new publishing formats like EPUB3. Maybe you can have a go yourself – try downloading templates from GitHub for the examples mentioned above and reimagine and share what you find.