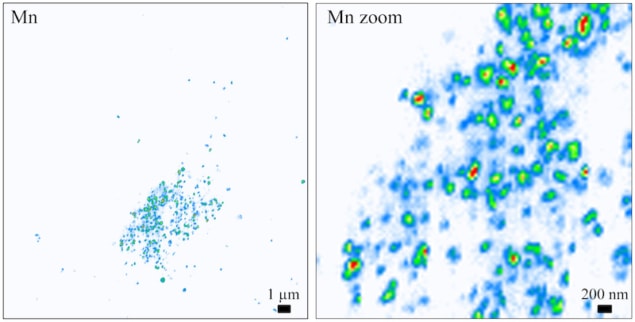
Manganese is an essential element in the body at trace levels and is a cofactor in many enzymes and proteins but it is neurotoxic in high amounts, causing symptoms similar to Parkinson’s disease. A team of researchers in Bordeaux in France has now used organelle fluorescence microscopy combined with synchrotron X-ray fluorescence (SXRF) imaging to show that manganese accumulates in the Golgi apparatus of human cells that are transfected with a mutant protein that causes toxic build-up of manganese in cells. The single-cell imaging technique could help us better understand the mechanisms behind neurotoxicity in Parkinsonian syndrome and other neurological diseases.
Researchers recently discovered that a mutation on the Slc30a10 gene can lead to a hereditary form of Parkinsonism. Slc30a10 is a cell surface protein that controls manganese (Mn) efflux and prevents too much Mn from entering cells. The disease-causing mutation blocks this activity.
Challenging to image
Little is known about how Mn distributes in human cells because this element is present in concentrations as low as the μg/g range. This means that it is challenging to image it. Very high spatial resolution and highly sensitive techniques to directly detect such low amounts of Mn in intracellular organelles of the cell, which are 1μm3 or less in size, are thus needed.
This is now possible thanks to synchrotron radiation hard X-ray nanoprobes at facilities such as the Deutsches Elektronen-Synchrotron (DESY) in Hamburg, Germany, or the European Synchrotron Radiation Facility (ESRF) in Grenoble, France. In the nano-imaging beamline at ESRF, for example, an X-ray beam of 17 keV in energy can be focused down to just 50 nm in size.

“Amazing though the spatial resolution and detection sensitivity of these probes is, it is still not high enough to identify the organelles in which Mn accumulates, however,” explains Richard Ortega of CENBG at the University of Bordeaux, who led this research effort. “This is why we developed a correlative microscopy approach combining optical fluorescence microscopy and synchrotron radiation X-ray microscopy.”
Mn distribution maps at the subcellular level
The researchers began by labelling the cellular organelles in samples of individual HeLa cells (a widely used model in cell biology) using organelle specific dyes. They then labelled the cell nucleus and the cell’s Golgi apparatus (which is a sort of “dispatcher” centre for proteins) using the same dyes. “We then performed optical fluorescence microscopy on the samples before taking them to the synchrotron facilities,” says Ortega. “By comparing the images of organelle localization and of Mn distribution in the same cells, we produced Mn distribution maps at the subcellular level in which we were able to clearly identify the Golgi apparatus as the main site in which Mn builds up in cells expressing the disease-causing Slc30a10 mutation.”
And that was not all: Ortega and colleagues say that their single-cell mapping technique is able to go even further and identify suborganelle Golgi nanovesicles less than 100 nm in size as the compartments in which Mn accumulates. The researchers believe that this Mn increase perturbs protein transport out of cells and alters nerve cell function, which is what causes Parkinsonian symptoms. They do admit, however, that more work is needed to confirm this hypothesis.
“Together with our colleagues in Somshuvra Mukhopadhyay’s group at the University of Texas at Austin in the US, we are developing new animal models of the disease to do just this,” Ortega tells Physics World. “These models will allow us to study Mn homeostasis in neurons but also in cells coming from other organs in which Mn imbalance could lead to altered metabolic function.”
The present research is detailed in ACS Chemical Neuroscience 10.1021/acschemneuro.8b00451.


