An international research team from multiple medical centres has developed an automated image-analysis method to reveal the pathological progression of Alzheimer’s disease. Improving our understanding of this progression is critical to designing treatments that effectively halt the advancement of the disease.
Alzheimer’s disease is a degenerative brain disorder that affects memory, thinking and behaviour. It is widely believed that the toxic build-up of two abnormal structures – plaques and tangles – is responsible for the neuronal damage that causes the gradual worsening of symptoms. The plaques consist of deposits of the protein fragment amyloid-beta, while tangles are formed by twisted fibres of the tau protein.
Unfortunately, existing Alzheimer’s treatments have shown limited success, possibly because they target these plaques and tangles after they are already widespread throughout the brain and irreversible damage has set in. Therefore, the development of more effective treatments requires a deeper understanding of their appearance and spread over time.
Justin Sanchez, from the Gordon Center for Medical Imaging at MGH and Harvard Medical School, and colleagues developed an automated method that uses positron emission tomography (PET) to track the origin and advancement of tau protein in relation to amyloid-beta levels across the unique brain anatomy of 443 individuals. The researchers recently published their results in Science Translational Medicine.
Combining images of structure and pathology
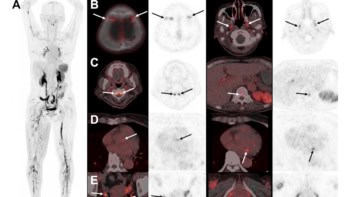
Although the distribution of tau protein in the brain has previously been imaged, identifying the pattern of appearance and spread has been complicated by normal variations in individual brain anatomy. To overcome this limitation, Sanchez and colleagues combined high-resolution structural imaging with molecular imaging to assess amyloid-beta and tau levels in specific brain regions throughout the study participants.
First, they used MRI. This provided a three-dimensional picture of each individual’s unique brain structure, with enough detail to delineate various brain subregions.
Next, they performed two different PET studies. PET is a molecular imaging technique that uses radioactive substances, known as radiotracers, to visualize metabolic and/or physiologic processes. These radiotracers can be specifically designed to highlight a distinct biologic function or molecular abundance.
When injected intravenously, the positron-emitting radiotracer travels through the body and, based on its design, binds to its specific target. As the radioisotope decays, the emitted positrons meet electrons in the body and annihilate, producing two 511-keV photons. By detecting these photons, the origin of the annihilation, and therefore the location of the radiotracer in the body, can be determined.
The first PET study used a radiotracer known as Pittsburgh compound B, which highlights areas of the brain where amyloid-beta is located. The second PET study used a radiotracer called flortaucipir that binds to sites in the brain with tau-protein tangles.
Finally, the researchers applied an automated method to the structural MRI data to identify the brain region most vulnerable to initial cortical tau build-up in each individual. They aligned the two PET images with the MR image to assess the amyloid-beta and tau protein levels in each brain subregion.
Putting the method to work
The researchers applied their novel image-analysis method to 443 adults ranging in age from 21 to 93 years, 55 of whom had Alzheimer’s disease. They additionally performed a two-year follow-up study in 104 of these individuals to assess the change in tau protein levels over time.
This study revealed that cortical tau protein first arises in a small region of the brain’s medial temporal lobe called the rhinal cortex. This initial emergence was independent of amyloid-beta levels and often occurred before amyloid-beta began accumulating. Then, when certain individuals additionally accumulated amyloid-beta throughout the brain, the researchers saw that tau was able to escape the rhinal cortex and catastrophically spread to other brain regions – the temporal neocortex and extratemporal neocortex.
The two-year follow-up study revealed that those individuals with the highest baseline tau levels in the rhinal cortex experienced the largest spread of tau throughout the neocortex. This finding is important because it suggests that tau PET measurements in the rhinal cortex can serve as a clinical indication of impending tau accumulation and spread.
These findings “have implications for clinical trials of Alzheimer’s disease-modifying therapeutics: they suggest that medical intervention against early tau accumulation could be effective in halting the progression of disease before the spread becomes catastrophic,” says Sanchez, adding that the new method has great potential to contribute to “advancing our efforts of provide effective interventions for patients at risk for Alzheimer’s disease.”