Michael Peel, Matias Vidal, Clive Dickinson and Paddy Leahy explain the discoveries underlying this stunning new map from the Planck Collaboration
Over the last century, our understanding of the universe has changed dramatically. One key discovery we have made is that for the first 380,000 years, the universe was a hot opaque plasma of photons, electrons and protons. As the plasma expanded and cooled, the electrons and protons eventually joined to form hydrogen, for the first time creating a transparent universe through which photons could travel freely.
Those photons are still travelling to this day and are our evidence for this event in cosmic history. Our observations and precise measurements of these photons, known collectively as the cosmic microwave background (CMB), have played a key role in defining our modern view of cosmology. Not only does the CMB confirm the hot Big Bang model of the universe, but it also provides a portrait of the initial conditions that later evolved into the galaxies and galaxy clusters that we see today.
The photons of the CMB would originally have formed a hot black-body spectrum – the lopsided curve of intensity versus frequency that is characteristic of photons emitted at thermal equilibrium. However, in the billions of years since they were created, those photons have since been stretched, as the universe has expanded, to longer wavelengths to form a cold black-body spectrum with its peak at 160 GHz (equivalent to having just been emitted by a black body at a temperature of 2.7 K). However, the CMB is not the only source of radiation at these frequencies and so a big focus of CMB measurements is to avoid radiation from other sources, and – where this is not possible – to identify and remove it.
One source of contamination is the Earth’s atmosphere and man-made interference, prompting researchers to minimize this unwanted noise by carrying out satellite and balloon-borne experiments to obtain the most precise observations of the CMB. The European Space Agency’s Planck satellite is the latest such experiment, and it has provided us with the most precise full-sky maps of the CMB we have to date. Planck has delivered two sets of cosmology results so far, with one final set to come.
The most important result from the mission is that it confirmed that the cosmology of our universe is extremely well described by a model that has only six parameters – which Planck measured – with no evidence for any significant deviations. As a result, we now know the age of the universe with unprecedented precision to be 13.799 ± 0.038 Gyr; that the Hubble constant has a lower value than previously thought, of H0 = 67.8 ± 0.9 km s−1 Mpc−1; and that ordinary (baryonic) matter makes up only 4.8 ± 0.1% of the universe, with dark matter accounting for 25.8 ± 0.5% and dark energy for the remaining 69.4 ± 1.2% (arXiv:1502.01582).
While the main driver behind the Planck mission was to make high-quality observations of the CMB, the telescope also unavoidably observed radiation from the whole of the rest of the universe as “foregrounds”. Planck observed the entire sky at nine different frequency windows from 30 to 857 GHz, in which radiation from different sources feature to a greater or lesser extent. By analysing and comparing these nine maps, researchers have identified the different radiation sources, or “components”, and cleanly subtracted them to accurately map the CMB. Identifying the components not only yields an accurate map of the CMB but also lets us learn a great deal about the interstellar medium of our Milky Way as well as nearby galaxies and distant galaxy clusters.
While the first Planck data release in 2013 provided information about the intensity of the measured radiation only, the latest 2015 data release also includes information on the radiation’s polarization – whether the electromagnetic waves oscillate preferentially along a particular direction, and if so, by how much. For the first time, also, the data have been decomposed into maps of all the different components, including several that contribute to the unwanted “foreground” (arXiv:1502.01588). (In the first release, in contrast, the different components that dominate in the three lowest-frequency maps were treated as a single foreground component.) Using Planck data we have recently studied these low-frequency maps, which are dominated by emission in the Milky Way, and revealed new and surprising features, both big and small, in the radio sky (arXiv:1506.06660).
The polarized sky
While the intensity of the CMB provides a snapshot of the universe at 380,000 years old, it is possible using another parameter of the CMB to examine the physical conditions of the universe at less than 10−32 seconds old. That parameter is the polarization of the measured electromagnetic waves. In some models known as “inflation”, in which the universe expanded by a factor of 1080 in a fraction of a second after the Big Bang, gravitational waves are expected to have been created that may have produced a characteristic, detectable polarization field on the CMB. Detecting this pattern would confirm the inflationary paradigm and give insights into the extremely high energy scale of the early universe, which is why measuring the polarization of the CMB is so important.
In 2014 the BICEP2 team, observing the polarization of the CMB from the South Pole, controversially claimed to have detected a polarization pattern that would indicate the gravitational waves caused by inflation (2014 Phys. Rev. Lett. 112 241101). In response, the Planck team prioritized its initial analysis of the polarized sky and – together with the BICEP2 and Keck collaborations – published a joint analysis showing that the reported polarized signal was in fact mainly produced by polarized light emitted by dust in the Milky Way (2015 Phys. Rev. Lett. 114 101301). Whether there are gravitational waves from inflation at lower levels than BICEP2 and other current CMB experiments could detect is still unclear. Apart from more sensitive future CMB experiments, answering this question will also require us to characterize better the different sources of polarized light, be they from thermal dust, synchrotron emission or other processes entirely. That way we can avoid confusion about whether detected signals are indeed cosmological, or if they are simply from the Milky Way.
To characterize the low-frequency polarized emission from the Milky Way (along with more distant foreground emission), Planck produced polarized maps of the sky at 30, 44 and 70 GHz (in addition to higher-frequency polarized maps at 100–353 GHz). These maps show synchrotron radiation generated by cosmic-ray electrons and positrons spiralling around magnetic field lines in the Milky Way at near the speed of light from almost everywhere in the sky. These polarized maps therefore give us information about the Milky Way’s magnetic field and the distribution of high-energy particles.
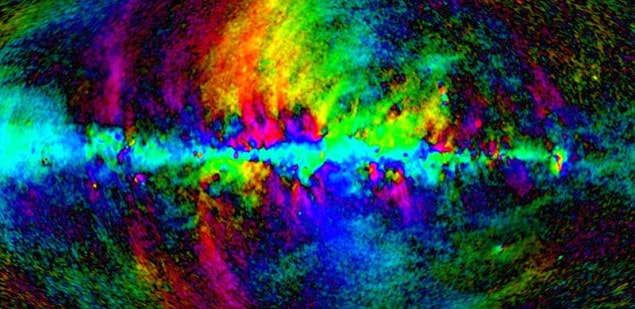
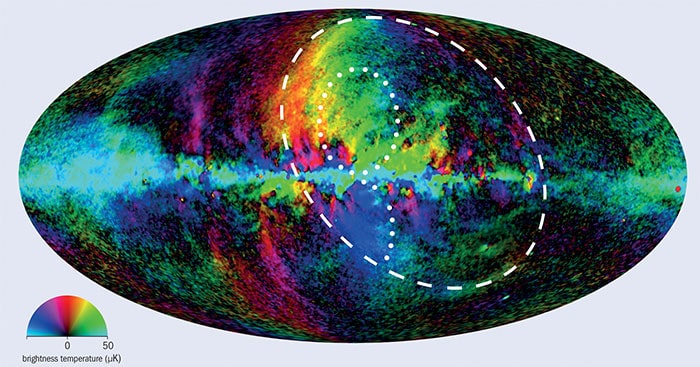
Figure 1 shows a polarized map of synchrotron emission that combines data from both Planck and NASA’s Wilkinson Microwave Anisotropy Probe (WMAP) at 20–50 GHz into a single map of the all-sky polarized emission scaled to 30 GHz. The hues indicate polarization angle, while the brightness of the colour represents the intensity of the polarized emission. The main feature is the plane of the Milky Way along the equatorial band of the map. The relatively uniform light blue along the plane tells us that the magnetic field is well ordered along our galaxy’s disc. A second striking feature is that most of the emission away from the galactic plane comes from individual filamentary structures, unlike the much smoother and broader structures seen in the intensity maps.
Some of these large-scale structures have been known since astronomers made the first radio surveys in the 1950s and 1960s, coining them radio “loops” and “spurs”. The sensitive Planck observations have given us new insights into the structure and properties of these features, with some thought to have originated from supernovae explosions, where an expanding shockwave compresses a magnetic field, accelerating electrons to relativistic speeds and producing radio emission. The large size of the loops (many times the size of the Moon in the sky) implies that the explosions occurred in the same part of the spiral arm of the Milky Way that the Sun is in – less than a few thousand light-years from Earth – causing them to appear large on the sky due to projection effects.
Much of the polarized emission in the sky is related to “Loop I”, the outline of which is shown in figure 1. This is one of the largest features in the sky – if you could see it with your eyes, it would cover the whole of the night sky. The loop’s ovoid shape has been fully traced for the first time with Planck data and its angular size on the sky is larger than what was originally thought. Its origin is probably connected to a number of supernovae explosions of high-mass stars within the last 20 million years that together formed what is known as a “superbubble”. It was long thought that these supernovae occurred in a region of young stars about 400 light-years away called the Scorpius-Centaurus Association. However, we have considered the radio polarization and X-ray intensity of the radiation coming from Loop I – quantities which both diminish as the radiation travels through interstellar gas – and we have found that there is not enough gas between us and the loop to account for the values we measure unless the distance to the centre of the loop is at least 1500 light-years from Earth.
The Planck data have also let us analyse many fainter and smaller loops in other parts of the sky. Two other filaments might be connected to a much more energetic event. In 2010 the NASA-led Fermi satellite detected large bubbles – extending above and below the galactic centre – that emit gamma-rays. These “Fermi bubbles” are thought to be related to past jet activity from the supermassive black hole at the centre of the Milky Way. Planck data have shown that the two filaments are closely aligned with the edges of the bubbles – shown in figure 1 as dotted lines. These synchrotron filaments are thinner than Planck’s resolution, which confirms that the Fermi bubbles have very sharp edges and helps to constrain the models that describe how the bubbles could have been created.
Intensity foregrounds
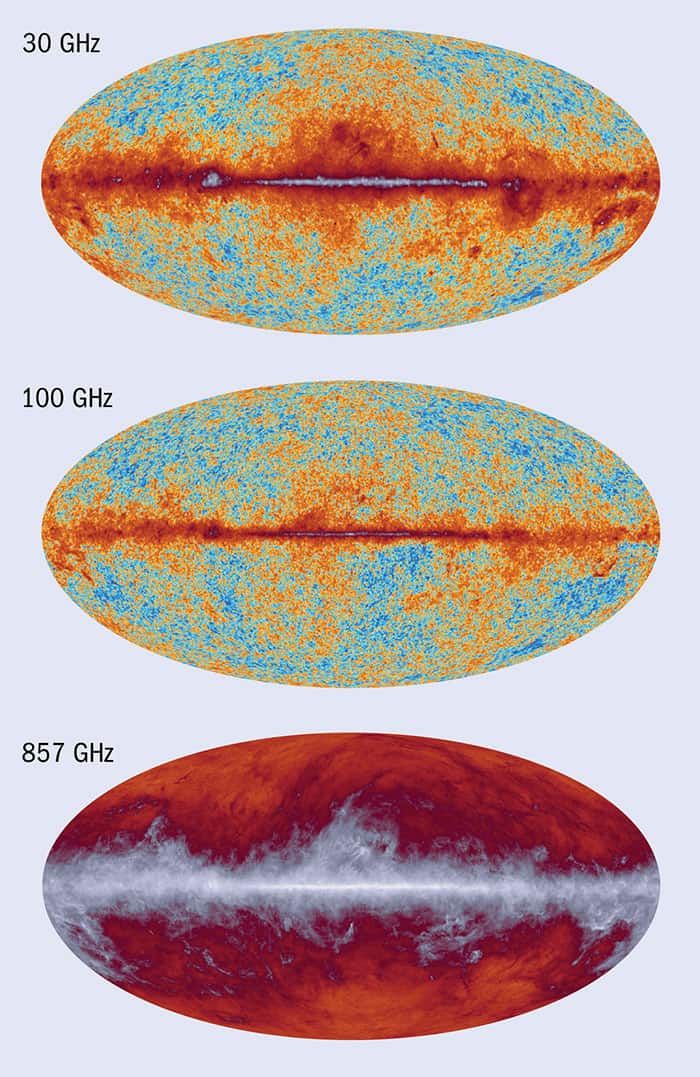
Although polarization data provide new insights into foregrounds, not every foreground component is polarized and we can learn a lot by looking at intensity alone. Figure 2 shows three maps that demonstrate the intensity foregrounds at different frequencies. At high frequencies (above 100 GHz) the foreground is mostly thermal emission from interstellar dust at temperatures around 15–25 K, as well as line emission from carbon monoxide and other molecules. At low frequencies (below 100 GHz) there is a mix of synchrotron emission from electrons spiralling around the Milky Way’s magnetic field, emission from free electrons scattering off positive ions known as “free-free emission”, and, unexpectedly, a dust-correlated component often referred to as “anomalous microwave emission” (AME).
AME is thought to arise from spinning dust particles that radiate as they rotate. It is typically found in photon-dominated regions where there are also lots of dust grains. Originally proposed by William Erickson in 1957, AME was largely forgotten about until it was discovered observationally in 1997 when CMB experiments started making sensitive measurements of the sky at around 30 GHz. Planck has given us the best evidence for AME in a wide variety of astronomical sources to date.
The complete set of Planck data provides new insights into all of these emission mechanisms. The fact that Planck observed at nine different frequencies means that all of these different emission mechanisms can be separated from each other using their spectral properties, in combination with data from WMAP and ground-based radio surveys.
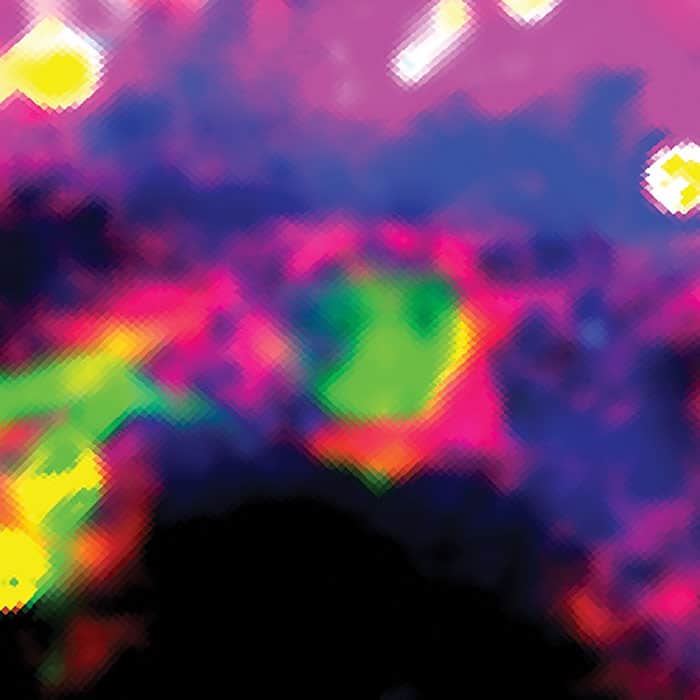
A clear example where all three low-frequency components are spatially separated from each other, which was found for the first time by our recent analysis of the Planck data, is in the region of Lambda Orionis, shown in figure 3. The central region around the illuminating O8 star is dominated by free-free emission, but component separation reveals that there is a shell of AME surrounding the free-free emission, set against a background haze of synchrotron emission. This is the clearest example of an AME ring that has been seen, and it is one of only a few well-detected AME regions. The dust grains and molecules are irradiated by starlight in this photon-dominated region that lies at the transition between the warm ionized gas and the neutral interstellar medium. This illumination may be crucial for the dust grains to produce appreciable radio emission, either by electrically charging the grains, and/or by causing them to spin. More detailed follow-up observations are now needed to study the gas and dust in order to understand the physics behind the radio emission being produced by the dust in this region.
Looking ahead
The Planck satellite was switched off in 2013, but it has left us with a treasure-trove of data. Members of the Planck Collaboration are continuing to analyse the data, with the final set of papers due out in late 2016. The final version of the Planck data will also be released at the same time, and will be the best and most sensitive all-sky coverage until the next CMB satellite mission (possibly Cosmic Origins Explorer or Litebird) takes off, which may not be until some time in the next decade at the earliest.
Future experiments at different frequencies will help us further exploit Planck’s data. The C-Band All Sky Survey experiment, for example, will result in maps at 5 GHz that will let us characterize the synchrotron emission better, allowing an improved subtraction from Planck data and so yielding even better cosmological constraints. The next generation of CMB experiments – both ground-based and satellite – will provide us with better maps of the CMB polarization that will let us search for gravitational waves from the early universe, with the knowledge of the foreground emission provided by Planck being essential to clean up these maps.

