The recent introduction of MR-linacs into the clinic offers high-resolution target visualization during radiation treatment of cancer. Such systems are currently used to perform MR imaging of the patient on the treatment couch immediately prior to delivering each radiation fraction. Any changes in the patient’s anatomy or set-up position can be compensated for by adapting the original treatment plan to create a new plan-of-the-day.
So far, so great. But how can you check the accuracy and suitability of the adapted plan?
“The problem arises if you want to do patient-specific quality assurance. This is easy for a normal linac plan, but on the MR-linac, because you are adapting online, you can’t deliver the plan to an array without moving the patient off the couch,” explains Anthony Carr from The Christie, one of two UK sites that is now treating patients with Elekta’s Unity MR-linac.
The only option is to verify the plan after delivering treatment – and this makes people nervous, says Carr. Speaking at last week’s Medical Physics & Engineering Conference (MPEC) in Bristol, he described a potential solution to this problem: a fast automated “sanity check” for the new plan.
Carr is developing automated software that will quickly compare an online adapted plan against its reference plan using a set of specified metrics. The software also defines a tolerance range within which an adapted plan will count as acceptable. “If there are no gross differences between the plans, you can be confident to treat and perform the checks after,” he explains.
The software will compare a range of metrics, including: monitor units (MU) for each segment, each beam and the overall plan; the area of each segment; the MU-weighted sum-of-segment areas; and the shift in the centre-of-mass (COM) of the exposed part of the field-of-view of each segment. The resulting data then need to be displayed in a clear and concise manner, says Carr. He notes that a similar “sanity check” program is being developed at the Netherlands Cancer Institute.
To create the software, Carr used MR images from four patients and introduced realistic position shifts (of up to 0.5 cm). He then employed the Monaco treatment planning system to create plans adapted to the shifted position. New plans were created in four ways: by optimizing segment weight, and by optimizing segment weight and shape, for both adapt-to-position and adapt-to-shape optimization routines.
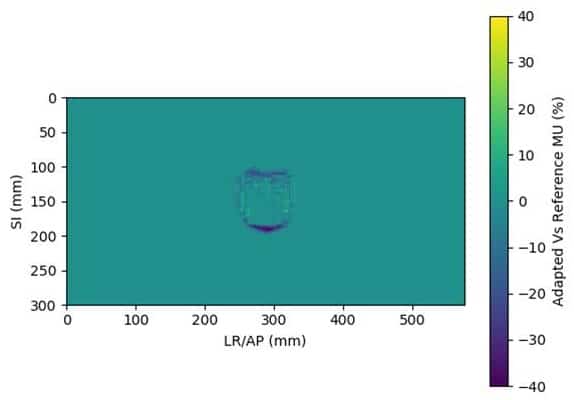
The software compares the original and adapted plans and outputs a chart showing whether each metric has passed (in green) or failed (in red). The system can also create a heatmap of the treatment field, generated by superposition of all segments in all beams, representing the difference in photon fluence between the original and adapted plans.
One question that Carr and his colleagues had to address is what level of tolerance should the software use? He set the provisional tolerances as 2σ above or below the mean value. “The tolerances can’t be too tight, or people may start to ignore them,” he points out. “Part of the problem was that I started writing the code before any patients had been treated, so we were concerned whether the tolerances we derived from these artificial shifts would be relevant in practice.”
Carr showed an example plan adapted to position using optimize weights. The COM data showed good agreement between the simulated shift and the software’s output, with a mean difference of just 0.01 mm in the superior–inferior (SI) direction, and 1.06 mm for anterior–posterior/left–right (AP/LR) shifts. In plans adapted using optimize weight and shape, the differences were slightly larger.
Next, Carr examined whether the 2σ tolerances are suitable for highlighting gross errors. To do this, he created plans from MR images with larger applied shifts (1.5 to 3 cm), again adapting to the new position by optimizing segment weights, and segment weights and shapes.
How can we use MRI in radiotherapy?

Examining four metrics – segment MU, beam MU, segment area and MU weighted sum-of-segment areas – revealed that the software flagged a far higher number of metrics in the plans with large shifts: approximately eight times as many for optimize weights and three times for optimize weights and shapes. “More were highlighted in red, which is a good indication that the software can pick up gross shifts,” says Carr.
In future work, Carr aims to extend the software to include plans adapted via segment reshaping using optimize weights or full fluence optimization. In addition, now that The Christie is treating patients with its MR-linac, he plans to analyse the results of real patient scans and adaptations, and use these data to create a set of tolerances.