Since the advent of super resolution localization microscopy (SMLM), researchers have raced to extend the technique to live cells. However the time required to obtain each image has so far prohibited applying the technique to study dynamics. In order to get access to the nanoscale machinations of proteins in cells, Juliette Griffié and colleagues developed a tool that tracks clusters of molecules from very sparse SMLM data.
The tool works using a Bayesian statistical framework, and increases temporal resolution, allowing them to image fast processes within live cells that were beyond the scope of previous techniques. With it they show they can track how protein clusters allow cells to dynamically segment tasks on a tiny length scale, providing insights into the mechanism of how the cell functions.
Reframing ‘temporal resolution’
Super resolution localization microscopy works by temporally separating flashes of light from fluorophores – molecules that re-emit light after light excitation – which would otherwise overlap. By making the fluorophores switch on and off, the signal from each light flash is separated from other flashes and its centre can be estimated precisely as a single point.
As these points represent the positions of molecules, the techniques really lend themselves to the study of nanoscale phenomena. However to build up a super resolution image, researchers typically sum the points from thousands of individual time frames, and this is what makes building up an image slow. For instance, a meaningful image composed of molecular clusters may require 500 raw frames: the time between each reconstructed frame could be as much as 15 seconds, even with the most applicable fluorescent protein available today mEos3.2 – .
Usually, researchers think of temporal resolution as something to be improved by altering the microscope or the type of fluorophore. Instead Griffié and colleagues focus on using clever analysis techniques to reduce the amount of input data required to reach the true answer.
How does it work?
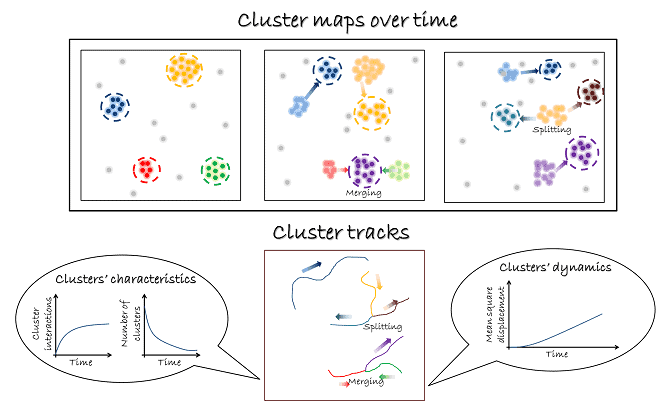
The algorithm takes a circle around each point, and counts the points within the circle. If the points exceed a threshold, the group is designated a cluster, and descriptors are extracted from it such as size and density. To test thousands of different circle sizes and thresholds, the algorithm uses a Bayesian approach, assessing the quality of the assignments of molecules to clusters against a user supplied model. The method enables a wide range of clustering phenomena to be investigated with different sizes and densities, even in the same cell.
Shedding light on life
Using this method, the team performed stress tests. If a cluster really contains 50 molecules and is 100 nm in size, what is the minimum number of detected molecules required to register the correct size and density of the nanoclusters in that sector? By performing simulations, the team found that only 20 detected molecules are required per square micron, so fewer raw frames need to be summed together to form a single reconstructed frame. By using further computational tricks such as a sliding window of analysis and reduced proposal generation for adjacent reconstructions, the team were able to achieve sub-second temporal resolution.
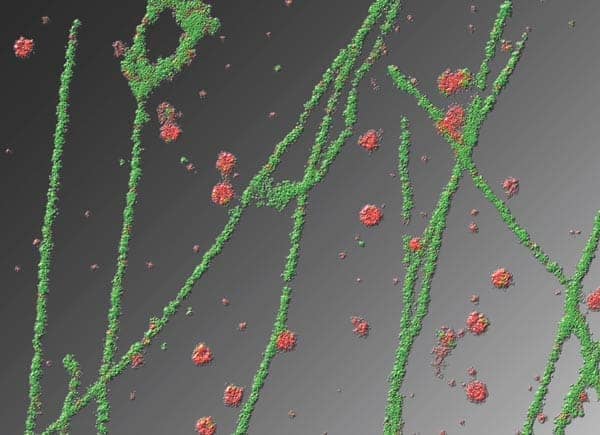
To prove that the technique is valuable for studying real molecules, they imaged CD3 zeta, part of the T cell receptor by fusing it to mEOS3.2. As well as size and relative density, other characteristics could be described, such as the movement of the clusters, and their splitting or merging with other clusters. These are newly imaged phenomena on this length scale, and are likely to play a role in the regulation of many proteins on the nanoscale within cells. Griffié and colleagues plan to extend the technique to 3D data.
Full details of the work can be found in the journal Small methods
Analysis: less is more
This paper represents a different way of thinking about localization microscopy. There is a move away from high sampling being the goal by proving that small amounts of input data on size and density can produce consistent answers, which can easily be compared between conditions.
Fluorescent protein engineering may also complement this technique. Multi-blinking, easily replenished or reversibly switchable fluorescent proteins may provide fuller and more constant sampling rates. Also, dependent on the fluorophore, low laser powers can be used to produce fewer localizations with nonetheless the same precision as at high laser power. As well as being able to image faster cellular processes therefore, this software technique may also increase the applicability of SMLM to sensitive primary cells or longer-term imaging. It is likely that techniques based on light sheet microscopy will be able to provide reliable live SMLM data in sensitive cells, enabling whole cell sampling and 3D nanocluster tracking.
The combination of advances in the hardware, advances in fluorescent protein based imaging, and advances in quantification will together provide a more holistic picture of temporally regulated nanoscale happenings. Such phenomena may be widespread in cells but have never been identified on this length scale. They are inherently out of the reach of even the best single-molecule tracking techniques, which only look at single molecules. Whole cluster tracking will be especially important in cells such as T cells, which use heretofore uninvestigable spatial regulation of nanoscale clusters to achieve very fast regulation.