The superfluid-like behaviour of a condensate of polaritons at room temperature has been seen for the first time by researchers in Italy and Canada. Until now, such behaviour had only been observed at very low temperatures. As well as allowing physicists to study macroscopic quantum phenomena under ambient conditions, the research could be exploited in the development of photonic circuits that use light to process information.
Superfluidity – the flow of liquid without any friction – was first observed in ultracold liquid helium in 1938. Such a superfluid liquid can creep up along the walls of a container, boil without bubbles and even flow around obstacles. Shortly after the discovery, the physicist Fritz London suggested that there might be some sort of link between a superfluid and a Bose–Einstein condensate (BEC) – the latter being a state of matter in which all constituent particles have condensed into a single quantum state. He was proved right in 1995 when superfluidity was observed in BECs made from ultracold atoms.
To date, however, superfluidity and BECs have only been observed at very low temperatures. A team led by Daniele Sanvitto of the CNR NANOTEC in Leece, Italy, and Stéphane Kéna-Cohen of the Polytechnqiue Montréal in Canada has now shown that a condensate of quasiparticles called polaritons can behave as a superfluid at room temperature.
Flowing around obstacles
The sample studied by the team consists of a Fabry–Pérot microcavity made up of two highly reflective dielectric mirrors surrounding a thin film of organic material called TDAF. This set-up confines photons in a small volume. Electrons and holes can form bound states called excitons even at high temperatures in TDAF. The photons interact with the excitons so strongly in the microcavity that they form particle-like excitations called polaritons.
By making use of a very fast detection technique that can take one image about every 10 fs, the researchers were able to observe the collective dynamics of the polaritons. They found that the polaritons behave like a fluid that can flow without friction around obstacles, which were formed by using a laser to burn small holes in the organic material. This is interpreted by the researchers as being a signature of the superfluid behaviour.
Photonic counterparts to electronic devices
“The fact that such an effect has been observed under ambient conditions means that such condensate fluids can now be studied with table-top experiments in a simple device no bigger than a finger nail,” Sanvitto says. “The specific dynamics of these fluids (also called quantum fluids) could now be revealed and observed without the need for special equipment and experimental conditions.”
Referring to possible technological uses of the polariton superfluid, Kéna-Cohen says: “In the future, devices made of such quasiparticles composed of half-light and half-matter, which have a very low mass, might be used to transport information with zero losses and zero heating.” Indeed he says that one of the most interesting applications of polaritons is their use as possible photonic counterparts to electronic devices such as switches, gates and transistors.
The team is now looking at how to make devices in which photons can be better confined and stay confined for longer periods of time. “This will be essential for making future viable and realistic technologies based on polariton condensates,” says Sanvitto.
Astronomers working on the Hubble Space Telescope have tracked the motions of two nearby brown-dwarf stars, revealing the intricate “dance” that they appear to make as they orbit each other. Located just six light-years away, Lurhman 16AB is the third closest stellar system to Earth. Despite its proximity it was only discovered in 2013 and since then astronomers have been very keen to work out if the system of two brown dwarfs also contains a planet – something that had been suggested by observations made at the Very Large Telescope in Chile. Now, 12 images of the system taken by Hubble over three years have been studied using high-precision astrometry by a team led by researchers at the National Institute for Astrophysics in Italy. Great precision was needed because the two stars are separated by a distance just three times that between the Earth and the Sun. The presence of a planet would have a small effect on the motions of the stars, but no evidence of a planet was seen in the Hubble data.
Higgs boson’s “little brother” probably never existed
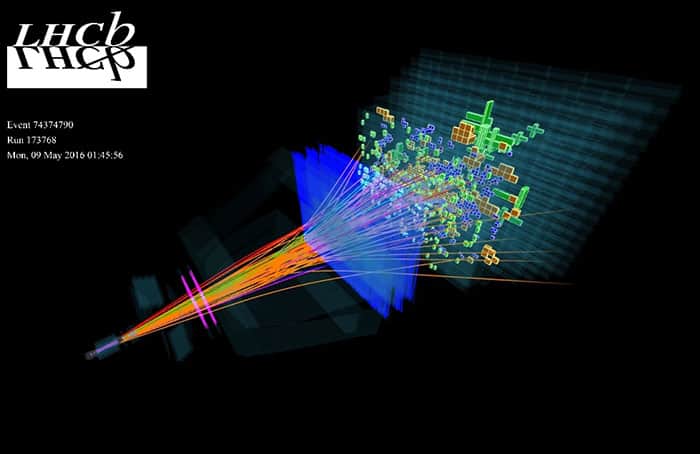
Brother particles: the inflaton was supposed to resemble the Higgs boson but it has not been seen in the decay of B+ mesons at the LHCb. (Courtesy: LHCb Collaboration, CERN)
The hypothetical inflaton is almost certainly not the particle behind the universe’s rapid expansion soon after the Big Bang. This is according to an international collaboration of physicists working at the LHCb experiment on the Large Hadron Collider (LHC) at CERN, who have been looking for traces of the inflaton in the decay of B+ mesons. Back in 1981, Alan Guth proposed a new model of the early universe to explain why it looks the same in all directions today. He theorized that after the Big Bang the universe initially expanded slowly, allowing time for matter to interact and the temperature to level out. Then, there was a very short, extremely fast expansion of space–time, which happened so rapidly that the universe now appears uniform throughout. For such an expansion to take place, however, there must have been a force field behind it. “A new [force] field always means the existence of a particle that is the carrier of the effect,” explains team member Marcin Chrzaszcz from the Institute of Nuclear Physics of the Polish Acadamy of Sciences (IFJ PAN). For a while, it was thought that this particle was the Higgs boson – however, when it was observed in 2012, the boson was too heavy to be the correct candidate. So theoreticians proposed a new particle called the inflaton, which had the properties of the Higgs boson but a smaller mass. To prove its existence, physicists looked at the decay of B+ mesons, which sometimes decay into K+ mesons and Higgs bosons. According to quantum mechanics, the near-identical nature of the “brother” particles means that they transform and oscillate between each other, so the Higgs boson should then convert into the inflaton. Rather than directly measuring the inflaton or Higgs, the LHCb detects their decay into a muon and antimuon. “Depending on the parameter describing the frequency of the inflaton–Higgs oscillation, the course of B+ meson decay should be slightly different,” Chrzaszcz explains. “We found nothing. We can therefore say with great certainty that the light inflaton simply does not exist.” The work is presented in Physics Review D.
“Living diodes” are made from muscle cells
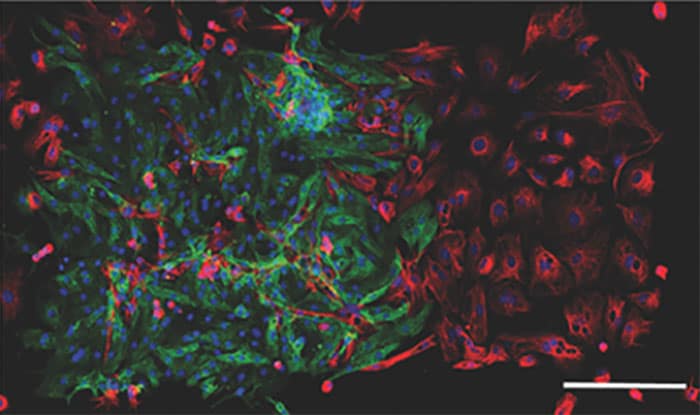
Open heart: the living diode is made of cardiac-muscle cells (left) and cardiac-fibroblast cells. The scale bar is 200 μm. (Courtesy: Uryan Isik Can et al. / Advanced Biosystems)
Two different types of muscle cells have been combined to create an electrical diode. Built by Pinar Zorlutuna and colleagues at Notre Dame University in the US, the device comprises two adjacent squares (each measuring about 400 μm) that are covered in cells found in rat hearts. One square contains cardiac muscle cells, which respond to an applied electrical signal by outputting electrical signals of their own. This means that an applied signal is propagated actively across the square. The other square contains cardiac fibroblast cells, which can absorb electrical signals but do not output signals on their own. While no active propagation occurs in the cardiac fibroblast square, an electrical signal can propagate passively over short distances. When an electrical pulse is applied to the cardiac-muscle side of the device, it propagates actively to the junction between the two squares. Once the pulse enters the cardiac fibroblast, it propagates passively and the output of the device is an attenuated version of the input signal. However, when a similar pulse is applied to the cardiac-fibroblast side of the device, it is attenuated by the time it reaches the junction and is below the voltage threshold required to cause cardiac muscle cells to output electrical pulses of their own. As a result, there is no active propagation in the opposite direction and no signal reaches the other side of the device. Writing in a preprint on arXiv, the researchers say that the device could be used to study electrical interactions between different types of muscle cells. Looking further in the future, they say the device could be used to create electronic and computer devices that could be integrated with the human body.
50 years ago this month, the particle physics facility that was to become Fermilab opened its doors for the first time. To celebrate a half a century of physics on the Illinois prairie, the folks at Symmetryhave produced a set of themed birthday cards that you can print-out and send to your friends and family. Indeed, there is still time to send a card to Fermilab itself, because the big day isn’t until next Thursday (15 June). My favourite card (above) uses colliding piñatas to illustrate the plethora of particles that were produced in Fermilab’s Tevatron – which smashed together protons and antiprotons between 1983 and 2011.
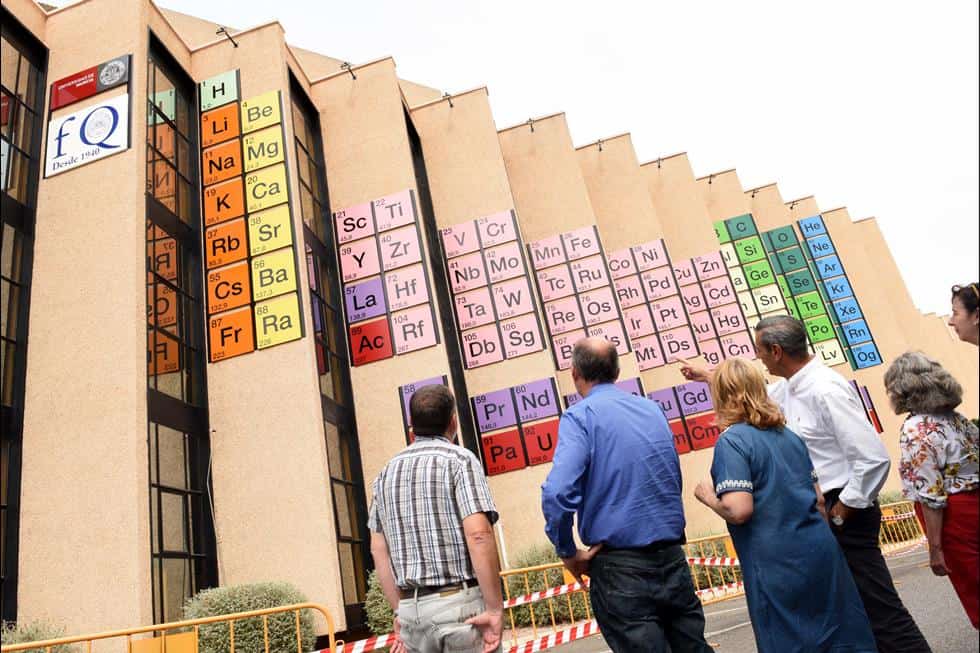
Top table: elements at a jaunty angle in Spain (Courtesy: University of Murcia)
Chemists at the University of Murcia in Spain will now have no excuse for forgetting their elements because their department building has been decorated with a giant periodic table. The display (above) covers 150 m2 and it is thought to be the largest ever permanent display of the elements. The university plans to also build a 50-seat grandstand for outdoor lectures so that the eye-catching table can become a feature of classes.
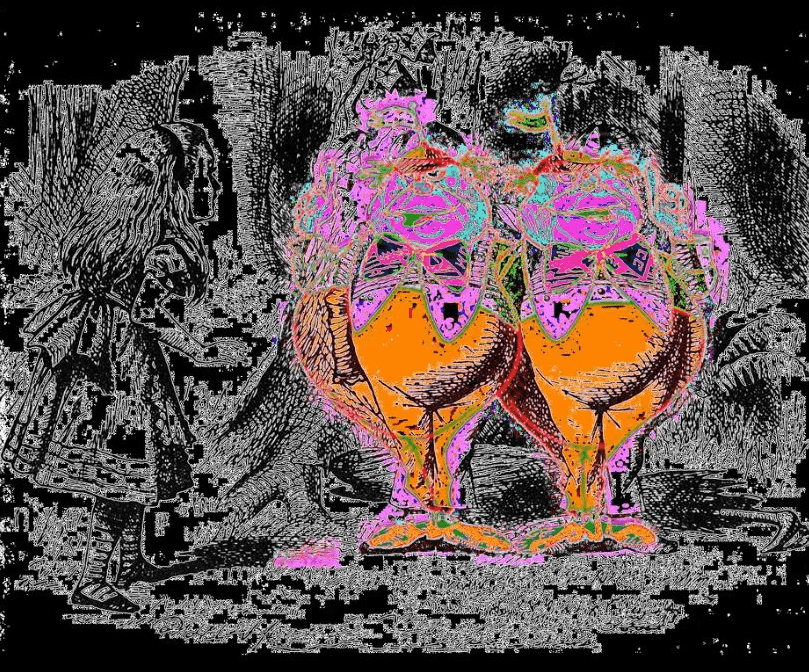
Quantum looking glass: Alice but no Bob. (Courtesy: Original Simulations group: Henry Semenenko and Sam Pallister (Bristol) and Maria Euler and Ker Siang Yeo (RCA)
Finally, the image above is an example of quantum art – at least according the University of Bristol. It is John Tenniel’s 1872 illustration from Through the Looking-Glass made using mathematical simulations of quantum teleportation. The work was created by Bristol’s Henry Semenenko and Sam Pallister, who teamed up with Maria Euler and Ker Siang Yeo of the Royal College of Art. This and other works are part of an exhibition called “Entangled: Art, Science and Quantum Computing” which ran early this week in London and will be coming to Bristol later in July.
A “plasma broom” for sweeping away dust on Mars has been developed by scientists in Romania. The device has been designed to clean solar cells that are typically found on probes sent to the planet by forcing away dust with bursts of plasma. The team led by Catalin Ticoş from the National Insitute for Laser, Plasma and Radiation Physics in Bucharest hopes it could be an efficient solution to the problem of Martian dust.
As Earth’s closest planetary neighbour, Mars holds a certain fascination for humans. In our pursuit to know more about the red planet, multiple probes have been sent and there are currently two operational landers on the planet’s surface – NASA’s Curiosity and Opportunity rovers – as well as NASA’s Spirit, which appears to have lost contact with Earth. But the environment on Mars is very different to Earth and dust has proven to be a particular nuisance for the robots.
Fine dust particles can be found everywhere on Mars, with sizes ranging from a fraction of a micron to hundreds of microns. The planet’s winds carry the dust over long distances and then deposit it as a fine layer on exposed surfaces. There are also larger sand particles that are more than 1 mm across and are transported by saltation – the same mechanism seen in deserts on Earth when sand is blown across the ground. The deposition and accumulation of the dust can cause a number of problems for Mars rovers. “Reports from NASA show that dust is quite a problem for missions to the red planet,” says Ticoş. “The Opportunity and to a lesser extent the Spirit rovers have been affected by the Martian dusty atmosphere.” Not only can dust cover optical detectors and cameras rendering them useless, it can also decrease the power production of solar panels at a rate of roughly 0.3% per day. Furthermore, the finer particles can penetrate equipment through holes and slits, and become a frictional problem for moving parts.
Sticky surfaces
Unfortunately, it isn’t a simple case of tipping the particles off or brushing them away with a standard broom. The dust sticks strongly to surfaces due to factors such as electrification caused by high electric fields during storms, and chemical composition – the high iron content is easily magnetized, for example. Previously researchers from NASA and other groups invented an electrical method called an electrodynamic dust shield – a fine mesh imprinted on surfaces is coupled to a voltage source to create an electric field that repels the dust. “The problem appears when you have large dust grains, which are quite heavy,” explains Ticoş, “Even if they are electrically charged it becomes very challenging to lift them off and transport them over tens of centimetres.”
The “plasma broom” solution developed by Ticoş and colleagues uses bursts of plasma jet produced by a simple plasma accelerator. When a large current is passed through two electrode plates separated by a field of rarefied gas, the voltage difference between the two electrodes ionizes the gas, creating the plasma. In the broom, this is done with a coaxial gun – the two metal electrodes are arranged as an inner rod within a hollow cylindrical shell. The discharge current flowing through the central rod electrode produces a magnetic field, which, together with the electric field, exerts a Lorentz force on the ionized gas that expels it. “The trick is that you need a quite high current in order to produce a reasonable magnetic field and this can be achieved more conveniently in a pulsed operation,” Ticoş explains. “For a fraction of a second (100 µs) the current is very high (several kiloamps) and the force pushing the plasma is quite strong.” During a pulse, the plasma is expelled at a very high speed – several kilometres per second – and so can simply blow dust away from an area two to four times bigger than the diameter of the jet.
An advantage of the plasma broom is that it uses low-pressure CO2 as the gas between the electrodes. This is particularly ideal for operation on Mars as the atmospheric pressure there is 150 times lower than on Earth and the atmosphere is 96% CO2. This means the gun will be able to function in “open” Martian atmosphere without the need for a pump or gas bottle. Ticoş and colleagues have also considered the energy required for the cleaner to function on Mars. This depends on the voltage the gun operates at and can vary between a few hundred to a few thousand Joules per pulse.
Energy efficient
“We did an energy budget estimate taking into account the solar irradiance on Mars,” says Ticoş, “and it appears perfectly feasible to fire a few shots even on a daily basis for cleaning the solar panels, which will boost considerably the energy production rate.”
To test the broom’s performance, the researchers covered photovoltaic cells (area 26.86 cm2) with 1 mm of synthetic Martian soil called JSC-Mars 1 A. This is a brown powder made from volcanic ash with particle sizes up to 1 mm. The gun was pointed at the cells from a distance of 5–11.5 cm and fired shots every two minutes. “Our plasma broom is quite effective,” Ticoş proclaims, “it can remove over 90% of the dust covering a surface of tens of centimetres squared, after a few shots.”
The next stage of the team’s research will focus on ways to remove dust in other environments, such as the Moon. The problem there is that the Moon has no atmosphere so instead of a plasma jet they will try a weak electron beam. As for using the plasma broom on a Mars lander, Ticoş suggests it could be autonomous or remotely controlled. “In the first case you would use it to clean the same area while if it is attached to a controlled mobile arm it could sweep dust off of a large solar array.”
Simulation of the dark universe is the largest ever
The largest virtual universe ever simulated has been created by scientists at the University of Zurich in Switzerland. Using the Piz Daint supercomputer at the Swiss National Computing Center (CSCS), Douglas Potter and colleagues generated a catalogue of 25 billion virtual galaxies from 2 trillion digital particles representing dark-matter fluid. The simulation describes the dynamics of dark matter and the formation of large-scale structures in the universe with unprecedented accuracy. Due to the team’s high-precision calculations, they have been able to account for galaxies as small as one-tenth of the Milky Way within the massive volume of the observable universe. The image above shows a section of the virtual universe a billion light-years across. The yellow represents dark-matter halos where scientists believe galaxies form and these are interconnected by dark filaments. The white areas are the lowest-density regions in the universe known as the cosmic void. The virtual catalogue will be used to calibrate experiments on the European Space Agency’s Euclid satellite, which will investigate the nature of dark matter and dark energy when launched in 2020. Potter and team’s code took 80 hours to execute and produce the simulation, which is presented in Computational Astrophysics and Cosmology. The researchers claim this is fastest time-to-solution simulation with such a high number of particles.
Ferromagnetic 2D material is a first
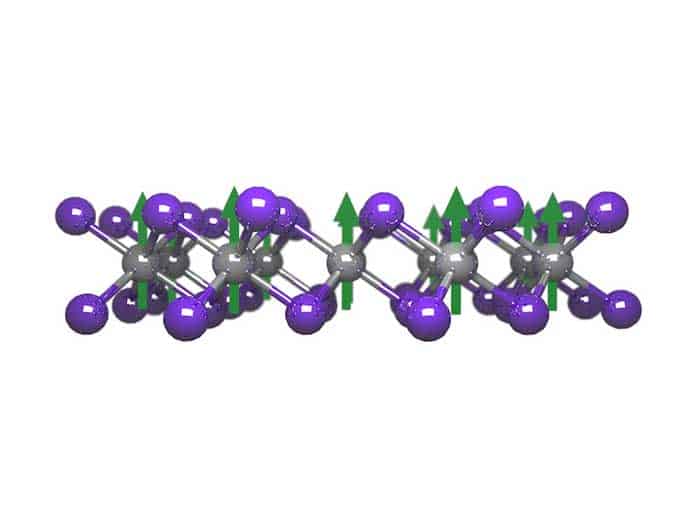
In plane view: a single layer of chromium triiodide showing the magnetic moments (arrows) point out of the plane of the material. (Courtesy: X Xu)
Researchers have observed robust ferromagnetism in an isolated 2D material for the first time. They also found that the crystal, chromium triiodide, boasts unique layer-dependent magnetic phases. The team was led by Xiadong Xu of the University of Washington in Seattle and Pablo Jarillo-Herrero from the Massachusetts Institute of Technology. They found that a single layer of the material displays ferromagnetic order below 45 K, a temperature that is only slightly lower than that for magnetism in the bulk crystal (61 K). “The magnetization forms spontaneously without applying an external magnetic field,” explains Xu. “This indicates that the magnetism in monolayer chromium triiodide is very robust. Spins lie perpendicular to the material’s crystal plane with large magneto-anisotropy. It can thus be described by the 2D Ising model of magnetism.” The team also found that the nature of the magnetic ordering depends very much on the number of layers in the system. In a bilayer, for example, the remnant magnetization in a single layer is suppressed – which implies that the two layers have oppositely oriented – antiferromagnetic – spins. In contrast, in a trilayer this property is lost and the net magnetization comes back. “The 2D crystal offers us several truly unique opportunities for exploring the fundamental physics of magnetism,” says Xu. The research is described in Nature. For more details see a longer version of this article on nanotechweb.org.
Ingredient for life found around Sun-like stars
Life forming: methyl isocyanate has been spotted in IRAS 16293-2422. (Courtesy: ESO/Digitized Sky Survey 2/L Calçada)
A possible precursor to life – the organic molecule methyl isocyanate – has been detected within the triple star system IRAS 16293-2422. Two independent teams of astronomers made the discovery using the Atacama Large Millimeter/submillimeter Array (ALMA) radio telescope in Chile. A previous study using ALMA has already shown that the system of three very young “protostars” contains the sugar glycolaldehyde, which is another ingredient for life. “This star system seems to keep on giving! Following the discovery of sugars, we’ve now found methyl isocyanate,” say Niels Ligterink at the Leiden Observatory in the Netherlands and Audrey Coutens at University College London, UK – who led one of the teams. “This family of organic molecules is involved in the synthesis of peptides and amino acids, which, in the form of proteins, are the biological basis for life as we know it.” Rafael Martín-Doménech and Víctor Rivilla of the Osservatorio Astrofisico di Arcetri in Florence, who led the other team, said “We are particularly excited about the result because these protostars are very similar to the Sun at the beginning of its lifetime, with the sort of conditions that are well suited for Earth-sized planets to form. By finding prebiotic molecules in this study, we may now have another piece of the puzzle in understanding how life came about on our planet.” IRAS 16293-2422 is about 400 light-years from Earth and includes an accretion disk of material that could someday form planets. The detection is reported in two papers that are available from the European Southern Observatory, which is a partner in running ALMA.
Identifying universal laws within fluid mechanics is notoriously difficult. So it has come as a disappointment that recent experimental and computational results have cast doubt on one of the very few relations that was thought to hold true across all turbulent, bounded fluid flows. But now a physicist in Italy reckons that by tweaking the formula in question – which stipulates that such flows have a logarithmic velocity profile – it does indeed prove to be universal. All that is needed, he says, is a simple extra term to account for the effect of pressure variation along the structure through which the fluid flows. One turbulence expert, however, points out that this is not necessarily a new idea.
Turbulence is a ubiquitous phenomenon in nature and is seen by many as one of the greatest unsolved problems of classical physics. The challenge is understanding how a fluid, such as water flowing from a tap, makes the transition from a smooth laminar flow to a disordered turbulent flow as the velocity of flow increases. This characterized by a dimensionless ratio known as the Reynolds number, and this usually occurs when the number is around 3000.
Physicists have no doubt that the basic formula describing the temporal evolution of a flowing fluid – the Navier–Stokes equation – is correct. Applying the formula to turbulent fluids, however, is problematic. The equation can only be solved numerically in simple geometries – even water travelling along a uniform, circular pipe can only be described for very modest Reynolds numbers.
The best that can be done in more complex scenarios, says Paolo Luchini of the University of Salerno, Italy, is to calculate time-averaged local quantities using “somewhat ad-hoc” turbulence models. The values that emerge can then be used to work out the global quantities – such as total flow rate through a given pipe – which are of most interest to engineers.
Holy grail
Developing robust turbulence models has been a “holy grail” for physicists, according to Luchini, but to date the only one that has, he says, been “generally accepted” is one describing a fluid’s velocity profile. This cross-sectional variation in the velocity of a confined fluid, such as one flowing through a pipe, arises because while the fluid generally flows quite freely down the centre of a pipe it is held back by friction at the edges. Indeed, at the very edge its velocity is generally zero.
Working out this profile for laminar flow is relatively straightforward. It just involves calculating the shear stress across the pipe caused by the variation in the fluid’s velocity, resulting in a parabolic distribution. But when the flow is turbulent, eddies introduce a second source of stress. Unfortunately, this cannot – yet, at least – be worked out from first principles.
Logarithmic profile
Despite these difficulties, German engineer Ludwig Prandtl showed as far back as 1925 that the turbulent profile should be logarithmic. However, experiments and computer simulations done over the past 20 years or so have cast doubt on this idea. The experiments measured the velocity profile of a fluid flowing down a pipe with a variety of Reynolds numbers. If the logarithmic law indeed holds true then the different profiles, when plotted, should overlap one another once the axes are suitably adjusted. But the overlap wasn’t perfect. Furthermore, the experimenters found that the shape of the profile also changed when fluids were sent along a different kind of channel – between parallel plane walls, for example.
This is a topic that can easily start up a fight at a specialist conference
Paolo Luchini, University of Salerno
Researchers have responded to this problem in various ways. Grigory Barenblatt of the University of California, Berkeley, US, proposed that the logarithmic law be replaced with a multi-parameter power law, while Hassan Nagib of the Illinois Institute of Technology, US, and colleagues said the law should remain logarithmic but that the coefficient used to multiply the logarithm, known as von Kármán’s constant (ᴋ), should vary. Others, meanwhile, have continued to back the existing logarithmic law. “This is a topic that can easily start up a fight at a specialist conference,” says Luchini.
Luchini’s own solution involves the addition of an extra mathematical term. He arrived at this conclusion by chance while surveying the literature as part of a study of how modulations in the flow of a stream that are dictated by the shape of the stream bed affect the formation of sand dunes. Having devised, and then discarded, a series of candidate formulae, he found one that he says “had a physical basis and satisfied me more than those I had read about”. The new term he introduces varies linearly with the pressure gradient along a pipe, which, he says, accounts for the variation in velocity profile with channel type while preserving the expression’s “asymptotic” logarithmic nature.
Common correction
Not everyone, however, is convinced by the importance of the latest work. Peter Davidson of the University of Cambridge, UK, argues that it “has long been known” how to correct for pressure gradients when calculating turbulent velocity profiles. “There is not much new here,” he says.
Luchini acknowledges that the effect of the pressure gradient on a velocity profile is “not in itself a new idea”. But what is new, he maintains, is the addition of a new term to account for the effect, rather than modifying the value of ᴋ. The omission of such a term to date, he writes, “justifies the doubts that have arisen in the literature, whereas including it definitely shows that the logarithmic law is valid and the value of ᴋ is universal”.
The first observation of gravitational microlensing by a star other than the Sun has been reported by astronomers using the Hubble Space Telescope. Predicted by Albert Einstein as a consequence of his general theory of relativity, gravitational microlensing involves the gravitational field of a star bending light coming from a more distant star. It was first observed during a total eclipse in 1919 by looking for deflections in the positions of stars in parts of the sky next to the Sun. Now, Kailash Sahu of the Space Telescope Science Institute in the US and an international team have measured the gravitational lensing of a background star by a white dwarf star called Stein 2051 B. Because the background star is not lined-up perfectly with Earth and Stein 2051 B, a combination of gravitational lensing and Earth’s motion around the Sun causes the background star to appear to trace out a loop around Stein 2051 B. Sahu and colleagues mapped its position at five different times in 2013-14 and used this information to calculate the mass of Stein 2051 B. It turns out that astronomers have puzzled over the mass of the white dwarf for over 100 years. It is part of a binary system and the motion of its distant companion suggests that Stein 2051 B has a smaller mass than most white dwarfs, implying that it might have an exotic composition. This recent work, however, suggests that the star has a mass expected for a white dwarf of its radius. The observations will be described in and upcoming paper in Science.
Amorphous topological insulators are possible, calculations reveal
Some amorphous materials such as glasses could be topological insulators – a property that is normally associated with materials with atoms locked into regular crystal structures. That is the claim of Adhip Agarwala and Vijay Shenoy of the Indian Institute of Science in Bangalore, who have done calculations describing electron-like particles “hopping” between sites that are distributed randomly within a material. Agarwala and Shenoy found that some 2D and 3D materials could have conducting “edge states”, even though the materials are insulators in the bulk. This is a hallmark of topological insulators and normally arises because of certain properties of the electronic band structure that occurs in crystalline materials. In a paper in Physical Review Letters, the physicists say emergence of these states is associated with the presence of “spin-orbit motifs” in the materials. In real materials these motifs could be atoms, molecules or nanoclusters that support the interaction between the spin and orbital angular momentum of electron-like particles. They also say that it could be possible to engineer amorphous topological insulators by introducing impurities with the appropriate properties into an amorphous material.
Origin of the Tibetan Plateau comes under scrutiny
Lifted high: the Tibetan Plateau’s elevation is described by a new tectonic model. The vast Tibetan Plateau formed much more quickly than previously thought (Courtesy: NASA)
The Tibetan Plateau rose within 10 million years rather than 45 million years as previously thought, according to a comprehensive seismic study by geophysicists. The vast plateau in Asia covers an area of 2.5 million km2 and stands on average 4.5 km above sea level. It has long been thought that the so-called “Roof of the World” has been continuously rising since the Indian and Eurasian tectonic plates began colliding 45 million years ago. This leading theory says that the northward motion of the Indian plate forces the plateau to simultaneously shorten and rise. Now, however, geophysicists led by Min Chen of Rice University in the US propose a different scenario based on three years of seismic data and supercomputer modelling. Chen and colleagues looked at readings from thousands of stations in East Asia, where seismometers measure the amplitude and timings of seismic waves caused by tectonic movements. The researchers then used a technique called full waveform inversion, which involves using supercomputers to work backwards from the seismic data so as to calculate what rocks the waves had passed through. “The technique really allows us to use all the wiggles on a large number of seismographs to build up a more realistic 3-D model of Earth’s interior,” says Chen. The team now believes that the plateau rose dramatically during the first 10 million years of the India-Eurasia collision. Both plates were rigid and buoyant, and rather than one pushing under the other, the two came together to form a thick slab of lithosphere. The Eurasia plate, however, was more deformable, creating a denser portion of lithosphere that eventually sank and today extends at least 660 km below the plateau. “Our seismic image suggests that the Tibetan lithosphere thickened and formed a denser root that broke away and sank deeper into the mantle,” Chen explains, “We conclude that most of the uplift across Southern Tibet likely occurred when this lithospheric root broke away.” The new model is presented in Nature Communications.
Surface slipperiness is a critical property within material development in the medical and technology fields. While materials with specific surface properties have been developed, few have demonstrated tunable slipperiness. Yuanjin Zhao and his group at Southeast University in Nanjing, China, hope to change this by developing a smart sponge with controllable wettability.
Wettability (the ability of a liquid to maintain contact with a surface) is a well-understood property that has been studied for more than 200 years. Stain-repelling clothing and anti-fogging windshield wiper fluids are both examples of materials with specifically designed non-wettable properties.
Zhao’s novel material goes beyond specific wettable-surface design by combining smart polymer trans-1,4-polyisoprene (TPI) with the well-known nanomaterial graphene. Smart polymers have mechanical properties that are sensitive to outside triggers. In this case, TPI changes shape when a voltage is applied. By covering a graphene sponge with TPI, Zhao and his group were able to control the shape of the graphene sponge using an outside voltage.
The sponge shape control was linked to wettability by covering the TPI–graphene sponge with a lubricant. Such a structure was partially inspired by the Nepenthes pitcher plant. When the sponge expands, the applied lubricant flows inside the sponge pores, causing the surface to become rough and irregular. But when the sponge contracts, the lubricant is forced out to create a slippery, sleek surface.
Zhao directly demonstrated the usefulness of the new material by using the sponge to pipette different solutions into a microplate. Microplates are frequently used in biological and medical labs but require a large number of pipetting steps. To make this process less labour intensive, one could load the different samples into specific wells located within the sponge. Samples could then be unloaded into the correct microplate well on demand.
Such a novel sponge can also be reused for different microplates and samples, as no liquid residues remain on the sponge well surface after the solutions are transferred. This is a huge advantage over traditional pipette tips, which must be disposed of to prevent sample contamination when working with different microplate wells. This property is directly related to the sponge’s change in surface wettability.
Zhao and his colleagues imagine such a unique sponge could also be used in microfluidics and biomedical instruments. Other applications include fuel storage and enclosure of micro-scale chemical reactions. Full details are reported in Science Advances.
I am currently in the market for a smartwatch that doubles as a fitness tracker. As I perused the seemingly endless options online, I came across a device that claimed to offer an additional feature: an optical sensor that could give me real-time information about my blood glucose levels. This is an enticing possibility. A continuous, non-invasive measure of blood sugar would help athletes optimize their intake during gruelling workouts. The wellness crowd could use it to improve nutrition. Most importantly, though, it would mean that millions of people with diabetes would no longer have to prick their fingers several times a day to extract a blood droplet for testing.
Unfortunately, the “glucose sensor” in this fitness tracker was useless. In fact, I only found out about the tracker by reading an article lambasting it. But although the article was good at dismissing the manufacturer’s claims, it failed to convey why the device didn’t work – or indeed why the hundreds of millions of dollars poured into optical glucose sensing by government-funded academic labs and deep-pocketed companies have not produced a functional product. Why isn’t this technology available yet? Like flying cars, jetpacks and tricorders, why are we being denied this boon of modern science?
Challenges ahead
The general idea behind non-invasive glucose sensing is to shine light onto skin and collect and analyse the reflected light for information relating to glucose content. This information could be a direct measure of glucose’s optical response (spectrum), or an indirect measure based on the effect glucose has on the tissue’s optical properties. Many researchers have treated this as strictly an engineering challenge: surely, all they need to do is devise a better instrument or apply better algorithms to the data. The lure of helping all those diabetes patients (and turning a massive profit) is strong and it is easy to believe that some promising new technique will bring it within reach. However, in reality, optical glucose sensing is fundamentally a physics challenge, not an engineering challenge, and this is why the vast majority of efforts have failed.
Techniques that directly measure glucose’s spectral signature are widely considered the best at producing reliable and robust measures of glucose content. Spectral signatures that arise from molecular rotational-vibrational motions can be recorded via absorption or Raman spectroscopy. However, glucose is far from the only molecule present in tissue, so measured spectra also include contributions from collagen, lipids, water and other constituents. In such cases, indistinct spectral features or large and varying background levels mean that measurements at multiple wavelengths are required to tease out the relative contributions of each substance.
This type of multiple-equation, multiple-unknown analysis is familiar to most scientists, so you might surmise that we need to know all of the component spectra before we can solve the system of equations for the concentration of the analyte of interest. Unfortunately, we don’t have this information. Certainly, we can make assumptions as to what the largest contributors will be, but a model derived from incomplete component spectra produces errors that are too high for the results to be clinically useful.
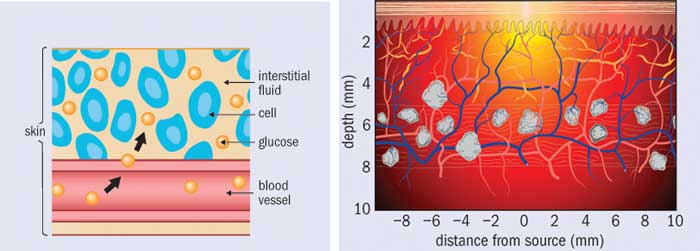
Shining a light (left) The concentration of glucose in blood is different from the concentration in interstitial fluid and other tissues, and all of these concentrations change over time. (right) The beam of light passes through different types of tissue, and the optical sampling volume depends on their absorption and scattering properties.
To solve this problem, we turn to a class of analysis called multivariate calibration. The fundamental goal of multivariate calibration is to derive a vector b of the same length as a measured multivariate dataset (in this case a spectrum) s, such that the inner product gives the quantity of glucose c. Written in linear algebra form, the expression is: c = sTb.
Here, lower-case boldface type denotes a column vector and the superscript T denotes a transpose. The vector b is often called the “regression vector” or just “b-vector”. Finding b is where the calibration step comes in. What we need is a set of tissue spectra, Scal, that are associated with known “reference” concentrations of glucose, cref. The linear-algebra expression looks nearly identical to the previous one, except cref is a column vector and the calibration spectra Scal is a matrix: cref = ScalTb.
In theory, this expression can be inverted to find b. In practice, a direct inversion is difficult because the system is underdetermined: there are more variables (wavelengths) than equations (calibration spectra). Researchers have tried myriad ways of addressing these challenges and solving for b, including acquiring more calibration spectra and applying novel advanced mathematical techniques. However, these tactics alone will not suffice, because developing an accurate regression vector b requires highly accurate values of cref and Scal. Small variations in either can lead to large errors in b and therefore unacceptably high errors in predictions of glucose concentration. Thus, the challenge of optical glucose sensing boils down to two seemingly simple prerequisites: an accurate knowledge of glucose reference concentrations and an associated set of high-quality calibration spectra.
Accurate reference concentrations
Finding the concentration of glucose in each spectrum of a calibration set might seem like an easy enough task. After all, finger-prick glucose tests are readily available. However, veins and capillaries contain different levels of blood glucose, and the act of squeezing out a small droplet changes the measured glucose concentration. In addition, many over-the-counter blood glucose meters are not accurate enough to act as references; indeed, even clinical laboratory instruments are only just good enough. To complicate things further, the concentration of glucose in blood is only part of the true cref, because the beam of light passes through interstitial fluid and tissue as well as veins and capillaries. Glucose is present in these spaces as well, and in differing concentrations. And when glucose concentration rapidly changes, as it does after someone eats, these differences in glucose concentrations are time dependent.
Out of all these problems, time dependence is perhaps the most challenging. The lag time between interstitial-fluid glucose levels and blood glucose levels is one of the major issues facing non-invasive sensing. Indeed, minimally invasive techniques (such as implantable sensors) struggle with it too, as they must wait for glucose to diffuse into the interstitial space and then to diffuse across the sensor membrane. Some researchers have attempted to characterize these lag times or develop mass transfer models. Others have focused on measuring both interstitial-fluid glucose and blood glucose simultaneously during a calibration study and weighting the contribution of each. However, the relative fraction of blood plasma, interstitial fluid and intracellular fluid is affected by a multitude of factors ranging from diet and water intake to medications and activity levels. How one is supposed to ascertain the actual glucose concentration within the optical volume in a particular patient, at a particular time, is an open question.
Even if the concentrations of glucose were equivalent in all tissue spaces, there is yet another challenge that most researchers have ignored: the measured spectral intensity is proportional to the number of sampled glucose molecules, not to the glucose concentration. For a fixed optical sampling volume, this distinction would be irrelevant. But in fact the optical sampling volume varies with a tissue’s absorption and scattering properties, which depend on a large number of factors. These include exposure to sunlight, temperature and contact pressure at the sampling site, plus properties of the patient such as the amount of melanin in their skin, hydration level, activity level and so on. What this means is that from person to person, from site to site, and even from time to time, the number of sampled glucose molecules can vary even if the glucose concentration were constant.
One could, of course, acquire spectra from more and varied subjects, but that is not going to be enough to account for the error in glucose values used to develop the model. It is possible to correct for sampling volume variations, but to make such a correction one need to know the optical properties of the tissue at the same time as every measurement.
All in the calibration
Let us turn now to our other prerequisite: high-quality calibration spectra. The ideal dataset for spectral calibration would have several properties. Unfortunately, only one subset of them – low noise and minimal drift – can be addressed directly through instrument engineering. The others – a high ratio of glucose signal to background; high spectral “distinctness” (orthogonality); and spectral constituents that do not co-vary with glucose levels – all require a more fundamental approach.
Maximizing glucose signal-to-background and spectral orthogonality is useful because it minimizes contributions to b from other (non-glucose) constituents. This makes the model robust against the influence of other analytes, so it should reduce the error in predicting glucose concentration. To accomplish this, we need to select our spectroscopic technique carefully, and choose an appropriate wavelength region and spectral resolution. However, regardless of the spectroscopic technique employed, other tissue constituents will still contribute strongly to the spectrum. It is therefore of utmost importance for calibration spectra to sample varying levels of all possible tissue constituents, and for these levels not to co-vary with glucose. This means that the way we obtain calibration spectra is crucial if we want a model that is applicable to future measurements, rather than just the set of data it was developed on.
As an example, consider a test in which the subject is asked to fast for 12 hours and is then set up with an instrument to begin collecting spectral data on their arm or finger. After a baseline period, the subject quickly drinks a beverage containing 75 g of glucose (for comparison, a sweet soft drink contains 40 g of sugar). The subject’s blood glucose concentration rises relatively rapidly and then falls over time as their pancreas releases insulin and glucose is removed from the bloodstream. Spectral data are collected at pre-determined time points along with blood samples to obtain reference glucose concentrations.
The procedure described above is a commonly employed test of glucose tolerance. Unfortunately, this study design is rife with challenges, including non-equilibrium glucose concentrations in different types of tissue; time-dependent physiological responses to glucose that cause the spectra of many tissue constituents to co-vary with glucose concentrations; and even time-dependent changes in how the instrument responds. Indeed, glucose tolerance tests are notorious for generating spurious correlations.
The optimal study design is a randomized, multi-level glucose clamp. In this type of test, both glucose and insulin are injected via a syringe pump such that the concentration of glucose within the subject’s bloodstream is maintained at a constant level for long enough that glucose levels reach equilibrium across various tissues. Next, the concentrations of glucose and insulin are changed in order to reach a new equilibration level, either higher or lower than the previous level. To avoid confounding effects, changes in the equilibrium level should not be time-dependent (so, for example, a protocol that repeatedly stepped up the equilibrium level would not be suitable). In this type of study, calibration spectra are acquired during the period of equilibrated glucose values. This minimizes any effects due to spectral properties co-varying with glucose concentrations. It is, however, a very expensive study, and it poses safety concerns that far exceed anything associated with gulping down a very sweet beverage. Hence, animal models should be used until confidence in performance is high enough to warrant testing in humans.
Why so much hype?
The hype around “imminent” optical glucose sensing has often been fed not by patient groups or breathless media reports, but by the researchers themselves. Many seem genuinely unaware of the common traps so many others have fallen into. The most frequent mistake is touting performance based on a “cross-validated” glucose tolerance test, where the term cross-validated means that the model was both generated by and applied to data acquired within the same study session, giving false confidence in the results. Such models will give far worse glucose-prediction results when they are applied to data taken at different times where the physiological and environmental conditions vary. Yet such tantalizing results are often enough to spur investment by people willing to believe. If you enjoy your informative materials with a heavy dose of snark, I recommend The Pursuit of Noninvasive Glucose: Hunting the Deceitful Turkey, in which glucose-sensing researcher John L Smith offers his personal take on why many companies have failed. While his manuscript does not focus on the underlying physics, it contains many of the same insights that appear in this article.
There are, undoubtedly, many instrumentation challenges in developing non-invasive glucose monitors in addition to the physics ones I have outlined here. Among other things, a practical device must be small enough to be convenient for patients and inexpensive enough to be marketable. Because improvements in these areas are easily apparent to investors, companies are often driven to show progress in engineering at the expense of science. Alas, without scientific progress, in which the problem is considered as a whole rather than in part, a smartwatch that can tell me my blood sugar – and diabetics’ hopes of ditching finger-prick tests for good – will remain out of reach.
Particle physics is a tricky business. Giant accelerators smash subatomic particles together, while fantastically complicated experiments study the debris for clues about the make-up of the universe. Since the middle of the 20th century, accelerators have become bigger and experiments more sensitive. Almost every jump forward produced a new discovery – the most recent being the Higgs boson at CERN’s Large Hadron Collider (LHC). While the story of the science behind these discoveries has been told several times, there is also a lesser-known, but very human, story to tell. These experiments bring together hundreds or even thousands of people from all over the globe, and navigating the inevitable clashes of style, method and personality is a core skill of the modern particle physicist.
Still, in working towards a common scientific goal, all of these little problems must be solved in a calm, rational way, right? Not a chance. Particle physicist Tommaso Dorigo’s book Anomaly!: Collider Physics and the Quest for New Phenomena at Fermilab takes us back to the 1990s, and covers the first 10 years of the US Collider Detector at Fermilab (CDF) experiment, one of two detectors on the Tevatron particle accelerator – the predecessor to the LHC. This was perhaps the beginnings of “modern” particle physics, from new technologies and computing techniques now considered standard, through to the dynamics of new large international collaborations. But unlike many books about particle physics, Dorigo offers a glimpse into the working life of some of the 600-strong team on CDF, and the handful of characters trying to steer the ship – often in different directions.
In the first half of the book, Dorigo shares some classic tales from the construction of CDF, and the early fight for recognition on the international stage. It’s clear that there is more than science at stake here, and Dorigo sets up a moment of real tension as CDF scientists race to publish a result that beats the competition and makes their name. Then, attention turns to the hunt for the top quark, the heaviest particle we know. Discoveries like this may come along only once or twice in a lifetime, so being one of the lead scientists can make a career. The book details how factions formed within CDF, with large groups and larger egos fighting for the glory. Competition with D0, the other experiment at the Tevatron accelerator (and my home for several years), adds to the pressure, and the cracks begin to show. Dorigo is not here to airbrush history – instead, he delights in dishing the dirt on the internal fights that border on industrial espionage: computer scripts that hog resources so other groups cannot work; new ideas being buried under a mountain of questions and requests for cross-checks. This peek behind the curtain at the (mal)functioning of a particle-physics experiment will be surprising to anyone not familiar with the field.
There are some real gems of particle-physics folklore in here. But, like many good ideas in the hunt for the top quark, they are buried under a mountain of unnecessary technical detail, and herein lies the problem I found with this book. The warning signs come early in the “introductory” chapters: the third paragraph in the book is already discussing the vectorial analysis of angular momentum and its quantum analogue. Given that the human stories here provide such great material – and are what make this book unique – I wish Dorigo had focused more on those. Instead, I found myself skipping pages on the interminable meetings, points of procedure, unnecessary technical lingo, and the minutiae of muon triggers and Monte Carlo scale factors. Yes, these details do take up a large part of the daily life of a particle physicist, but if you don’t already know what these things are and how important they can be, I’m not sure this book will give you an appreciation for them.
This is particularly true in the second half, which promises the real controversy (i.e. the really interesting stuff) as it moves from the discovery of the top quark on to the other, more speculative claims that followed. One character, Paolo Giromini, emerges as an agent provocateur in this play, reigniting old fights while refusing to play by the rules. We get a portrait of him dominating the corridors of the CDF offices, ridiculing colleagues, challenging the accepted views while remaining secretive and obstinate in his methods. Is he producing good science or not? It isn’t clear, but with the best theorists in the world putting pressure on the Tevatron experiments to hunt for new particles, Giromini makes claim after claim that he has already found them. The problem is that hardly anyone else at CDF believes him.
At this point, Dorigo himself becomes one of the main actors in the story, and it is clear we are hearing his side of what must have been extremely difficult decisions in how to deal with Giromini’s claims. There is plenty of food for thought here, and given that these events happened 20 years ago, more reflection would have been welcome. Do people like Giromini play a useful role in large collaborations to keep everyone on their toes, or are they just a distraction? When the media catch on to the rumours of a potential discovery, does the prospect of a quick headline interfere with the scientific process?
Given that none of Giromini’s claims have stood the test of time, were his fellow CDF scientists right to be cautious? These are fascinating topics that remain relevant to particle physics and many other areas of science today. But as Dorigo’s narrative remains fixed in the moment, many episodes in the book remain unresolved and the implications unexplored. In the end, this felt like a missed opportunity to tell a fascinating tale of life on the cutting edge of science.
2016 World Scientific Publishing Company 304pp £40pb