These days anyone making a major breakthrough in physics is expected to follow-up with a cheesy music video. So give it up for The Mavericks and “Chasing the Waves”, which chronicles the quest to detect gravitational waves – which culminated in LIGO’s success earlier this year. I don’t much about this video, but it seems to have been filmed at the University of Glasgow, which is part of the LIGO collaboration.
The European Space Agency (ESA) has confirmed that the recent crash of a Mars probe was caused by a computer glitch that made the spacecraft assume it had already landed on the red planet. ESA’s Entry, Descent and Landing Demonstrator, known as Schiaparelli, was launched together with ESA’s Trace Gas Orbiter and arrived at Mars in October. It was supposed to test landing techniques that would be employed on the upcoming ExoMars rover. However, as the probe entered Mars’s atmosphere, ESA scientists lost contact with Schiaparelli after it casted its parachute. Investigations have now shown that the parachute was deployed too early – at some 4 km above the surface of the planet – and that the probe also briefly fired its breaking thrusters too soon. The problem was due to a sensor failure that generated a negative altitude reading and made the probe think it was below ground level. A full report on the cause of the crash is expected early next year.
Was the speed of light faster in the early universe?
A way of testing whether the speed of light was faster in the very early universe than it is today has been put forth by João Magueijo of Imperial College London and Niayesh Afshordi at the Perimeter Institute for Theoretical Physics in Canada. Although a variable speed of light is at odds with Einstein’s special theory of relativity, it could solve the “horizon problem” of cosmology. The conventional theory of the early universe is that it underwent a rapid exponential expansion just 10–36 after the Big Bang. Known as inflation, this phenomenon explains several properties of the universe including the fact that it appears more or less the same in every direction. Dubbed the horizon problem, this homogeneity is unexpected because it would require energy to be transferred across the universe faster than the speed of light if the universe expanded gradually. Inflation solves the problem because an exponentially-expanding universe would not have time to lose its initial homogeneity. However, if the speed of light was much faster in the early universe then inflation – which itself is not fully understood – could be dispensed with. Writing in Physical Review D Magueijo and Afshordi explain how a varying speed of light would leave a specific signature in the tiny fluctuations in the cosmic microwave background (CMB) – radiation that was produced 380,000 years after the Big Bang and can be detected today. While their prediction falls within the current measurement uncertainty of the CMB by the Planck space observatory, Magueijo and Afshordi say that “improved observations will soon vindicate or disprove this model”.
Four quantum-computing stars join Microsoft
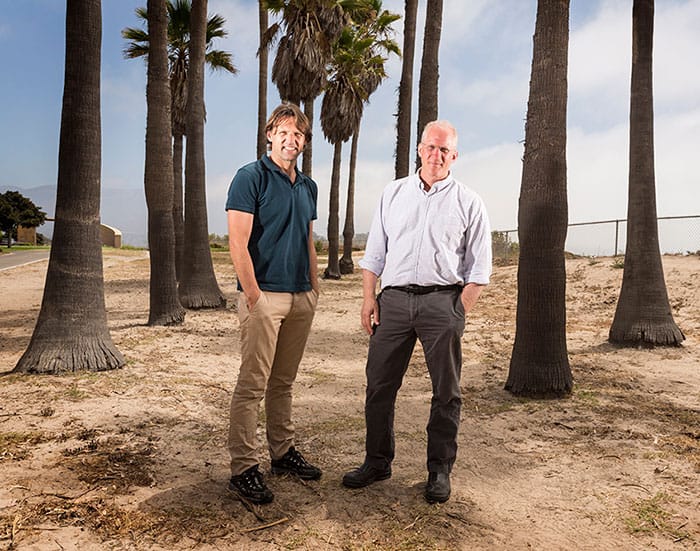
Leo Kouwenhoven (left) and Charles Marcus at Microsoft’s Station Q research centre in Santa Barbara, California. (Courtesy: Brian Smale)
Four leaders in the field of quantum computing are joining Microsoft to help the company develop a topological quantum computer. Leo Kouwenhoven of the Delft University of Technology in the Netherlands and Charles Marcus of the University of Copenhagen have already been hired by the US-based company and they will both build dedicated Microsoft quantum labs at their respective universities – while maintaining their academic research labs. Kouwenhoven and Marcus are both experimentalists who study solid-state systems that could be used to create hardware for quantum computers. Microsoft has also announced that it will soon be hiring Matthias Troyer of ETH Zurich, who is a theorist working on quantum algorithms and David Reilly of the University of Sydney, who develops quantum devices based on nanostructures. The quartet will help US-based Microsoft in its attempt to build a quantum computer based on topological quantum bits (qubits). Such qubits have inherent physical properties that should make them immune to environmental noise – which would otherwise degrade or even destroy quantum computations. Marcus and other experts explain the challenges of building a quantum computer in this podcast: “ Quantum computing: Challenges, triumphs and applications”
You can find all our daily Flash Physics posts in the website’s news section, as well as on Twitter and Facebook using #FlashPhysics. Tune in to physicsworld.com later today to read today’s extensive news story on a single-photon absorber based on Rydberg atoms.
Further evidence that solar neutrinos affect radioactive decay rates on Earth has been put forth by a trio of physicists in the US. While previous research looked at annual fluctuations in decay rates, the new study presents evidence of oscillations that occur with frequencies around 11 and 12.5 cycles per year. The latter oscillation appears to match patterns in neutrino-detection data from the Super-Kamiokande observatory, in Japan. Other physicists, however, are not convinced by the claim.
The idea of fluctuating beta-decay rates is very controversial because for more than 80 years, radioactive substances have been thought to follow a fixed exponential decay, under all conditions. The theory of invariable decay constants was set by Ernest Rutherford, James Chadwick and Charles Ellis in Radiations from Radioactive Substances, published in 1930.
In recent years, however, there have been suggestions that decay rates are not constant and are influenced by the Sun. In 2009, physicists from Purdue University in Indiana published a paper discussing unexplained annual fluctuations in long-term measurements of decay rates of silicon-32 and chlorine-36 at Brookhaven National Laboratory (BNL) in New York and radium-226 at the Physikalisch-Technische Bundesanstalt (PTB) in Germany.
Not so constant
The Purdue researchers noted that decay rates at both experiments appeared to be fastest early in the year when Earth is closest to the Sun. They suggested that the annual decay oscillations could be related to yearly variations in the Earth–Sun distance, with solar neutrinos somehow affecting decay rates.
This idea, however, was met with some scepticism in the physics community. Part of the criticism was that environmental factors, such as ambient temperature, are known to affect decay-rate measurements and might explain the seasonal variations. While others pointed to the fact that neutrinos interact with other particles infrequently and there is no known mechanism that could explain the proposed influence on decay rates.
In the latest research, Peter Sturrock, an applied physicist at Stanford University, Ephraim Fischbach at Purdue and Jeffrey Scargle, an astrophysicist at NASA’s Ames Research Center, performed power-spectrum and spectrogram analysis of the BNL silicon-32 and chlorine-36 data. The study revealed oscillations at frequencies of 11 and 12.5 cycles per year, as well as the previously reported annual oscillation. They also analysed five years of measurements from the Super-Kamiokande observatory and found similar oscillations in solar-neutrino flux.
Similar oscillations
In the Super-Kamiokande data, which were collected between 1996 and 2001, they found oscillations at 12.5 and 9.5 cycles per year. The researchers say that the oscillation at 12.5 could be related to the rotation of the Sun’s radiative zone, while the oscillation at 9.5 may be related to the rotation of the solar core.
The oscillations in decay rates and neutrino flux that occur at 12.5 cycles per year fit with each other. However, the oscillations at 9.5 (neutrino flux) and 11 (decay rate) cycles per year are more difficult to reconcile. The researchers say that the 11 cycles-per-year oscillation could originate in the region between the Sun’s core and radiative zone.
Sturrock told Physics World that his team is the first “to show similar patterns in both decay data and neutrino data. I see evidence of internal solar rotation in both BNL and Super-Kamiokande data”. He adds: “Comparison of spectrograms formed from BNL data and from Super-Kamiokande data shows a remarkable similarity to each other and to what we know (from helioseismology) about the rotation rate of the solar radiative zone.”
Unknown mechanism
Sturrock says that the mechanism behind the effect of neutrinos on beta-decay rates is unknown. “I speculate that neutrinos interact with the W-boson that is believed to mediate beta decay,” he explains. “But I am hoping that some theoretical physicists will take up this problem.”
Others, however, remain unconvinced. Karsten Kossert, a physicist at PTB, says that his own research, with others, on decay rates has shown that there are “some fluctuations in some instrument readings”. “However, since different instruments and/or measurement techniques show different variations, we can exclude solar neutrinos as a common reason for these variations.” He adds: “In some cases, we have shown a clear correlation between environmental parameters – such as temperature, humidity, air pressure – and instrument readings.”
Kossert recently co-authored a study looking at data on decay rates from 14 laboratories around the world. The report concluded that “observed seasonal modulations can be ascribed to instrumental instability” and that “there are also no apparent modulations over periods of weeks or months”.
Not persuaded
The evidence that neutrinos affect beta-decay rates “is not persuasive”, according to Hamish Robertson, director of the Center for Experimental Nuclear Physics and Astrophysics at the University of Washington, in Seattle. He says: “Evidence that fits the hypothesis has been brought forward, while other evidence that does not fit (for example, long-term studies of the beta decay of tritium), is ignored.” He adds: “Fitting the fluctuations to one natural phenomenon after another will eventually lead you to reach a spectacular conclusion.”
Patrick Huber, of Virginia Tech in the US, echoes this, saying that “correlation is not causation”. “Even if we assume there is this variation [in decay rates], I do not find anything in the data indicating that neutrinos have anything to do with it.”
Huber adds that if the oscillations are real and “not due to some experimental artefact”, this requires “extraordinary new physics, and hence it will require extraordinary proof – which the present work is not”. “In particular, it makes no suggestion how to test the hypotheses put forward or where to go next to study this question.”
Science meets art – this painting by Penelope Cowley will be unveiled at Cardiff University’s school of physics and astronomy on 25 November.
By Matin Durrani
A new painting by Welsh artist Penelope Cowley is the latest attempt to bring art and science together. Set to be unveiled on Friday 25 November at Cardiff University’s school of physics and astronomy, the 1.2 × 1.5 m picture was inspired by the recent detection of gravitational waves by the LIGO collaboration.
According to the university, the oil painting “combines a visualization of data taken from the equipment used to detect the first gravitational waves…with an imagination of some of the celestial bodies that are responsible for creating these waves, such as binary black holes and neutron stars”.
Superconducting transition spotted well above room temperature
An abrupt transition in the electrical resistance of graphite at 350 K could be a signature of superconductivity occurring well above room temperature (293 K). That is the claim of Pablo Esquinazi and colleagues at the University of Leipzig in Germany and also in Brazil and Australia. The effect was spotted in samples of natural graphite that came from a mine in Brazil. While claims of room-temperature superconductivity in graphite have been made several times over the past 40 years, this is the first time that the transition temperature has been measured, according to Esquinazi. The team found that the transition went away when the graphite was exposed to a magnetic field – something that is indicative of superconductivity. The team believes that individual grains within their samples are tiny superconductors and the spaces between the gaps act as Josephson junctions that allow supercurrents to flow from one grain to another. X-ray diffraction studies suggest that the grains have atomic structures that could support superconductivity, says Esquinazi. The research is described in New Journal of Physics.
Measurements of fundamental constants are good enough to revamp SI units
The fundamental physical constants have been measured with sufficient precision to allow the values to be used to redefine the International System of Units (SI), according to scientists at NIST in Gaithersburg, Maryland. These constants include the speed of light, the Planck and Boltzmann constants and the electrical charge of the electron. Metrologists are in the process of creating a completely new way of defining SI units – such as the metre, kilogram and second – in terms of the fundamental constants. This is unlike the current definition, which relies in part on artefacts such as the standard kilogram that is stored in Paris – and losing mass over time. In the new system, the Planck constant – which is now known to 12 parts in one billion – would be used to define the kilogram. Other planned changes involve using the Boltzmann constant (6 parts in 10 million) to define the kelvin, which is currently defined using the triple point of water. “These now ultra-small uncertainties in the constants will allow the General Conference on Weights and Measures to revise the International System of Units so that the seven base units will be exactly defined in terms of fundamental constants,” says NIST’s Donald Burgess.
X-ray laser reveals key steps in photosynthesis
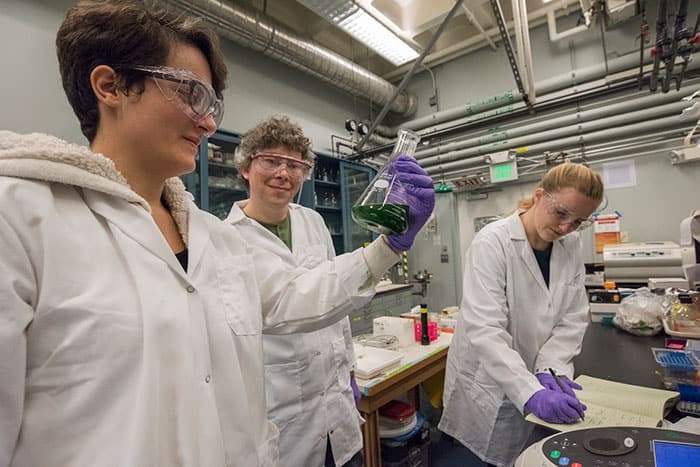
Louise Lassalle (left), Jan Kern (centre) and Lacey Douthit grow cyanobacteria to isolate photosystem II proteins in a Berkeley Lab bioreactor. (Courtesy: Lawrence Berkeley National Laboratory)
An X-ray free-electron laser at SLAC in the US has been used to observe two important steps in photosynthesis in which water molecules are split to liberate oxygen atoms. The work was done by an international team of scientists that used X-ray pulses just 40 fs in duration to determine the structure of a protein complex called “photosystem II”, which is involved in water splitting. Unlike previous studies of the process, which were done using frozen samples, the measurement was done at room temperature. The team was able to observe the steps in the four-step cycle by first firing pulses of green laser light at the liquid sample to initiate the splitting. Then, the X-ray pulses are used to measure the structure of photosystem II as the splitting proceeds. The team hopes its measurements will shed light on how water is split by a complex in photosystem II that contains manganese and calcium. “Learning how exactly this water-splitting process works will be a breakthrough in our understanding, and it can help in the development of solar fuels and renewable energy,” explains team member Vittal Yachandra of Berkeley Lab. The research is reported in Nature.
You can find all our daily Flash Physics posts in the website’s news section, as well as on Twitter and Facebook using #FlashPhysics. Tune in to physicsworld.com later today to read today’s extensive news story on a new type of neutrino detector.
When not pondering the underlying principles of the physics universe, Sajjad is also a strong advocate of improving accessibility for people with visual impairments. He makes the case that everybody stands to benefit from diversifying the ways in which physics is taught. In his spare time Sajjad is also a keen baseball player and is often travels to other US cities with his team the Boston Renegades. At heart though, Sajjad admits that he prefers cricket!
Computer and video gamers of a certain vintage will have fond memories of Lemmings, a game in which players must shepherd pixelated, suicidal rodents around a series of obstacles to reach safety. At first glance, the Ice Flows game is strikingly similar. Your task is to guide hungry penguins to their feeding grounds off the Antarctic coast, ensuring that they leap into the water in the precise place where the fish are, and the leopard seals aren’t. But that’s where the likeness ends. In Lemmings, any resemblance between the playing environment and actual lemming habitat was purely accidental (and in any case, real-world lemmings don’t walk off cliffs). Ice Flows, by contrast, is grounded solidly in science. The design of each game level is based on actual locations, and to steer your penguins to the right place, you must manipulate the rate of snowfall onto their icy breeding grounds and the temperature of the waters beyond them. What’s more, the effects of changing snowfall and water temperature are based on detailed data and computer models of real ice-shelf behaviour.
Who is behind it?
Ice Flows is the brainchild of Anne Le Brocq, a physical geographer at the University of Exeter, UK, who studies ice sheet modelling and the sub-glacial hydrology of ice sheets. She created the game with two game developers, Inhouse Visuals and Questionable Quality, and with support from the British Antarctic Survey and researchers at several other institutions around the UK and Europe. The whole effort was funded by the Natural Environment Research Council.
What’s it like to play?
The developers have crafted a cute and visually appealing game around the flowing-ice concept, and striking the right balance between snowfall and water temperature is pleasingly tricky without ever tipping into frustration. An initial tutorial level is followed by more difficult scenarios based on the Ronne and Filchner ice shelves. In some of these later levels, the complex interplay between the ice and the shape of the bedrock below it means that even a small increase in water temperature will cause your entire ice shelf to break up into icebergs, sending your penguins straight into the jaws of the waiting leopard seals. Such behaviour is physically realistic. According to in-game explanations, when the bedrock slopes downwards inland, it is known as a “reverse slope” and “there is a theory that once an ice sheet starts to retreat down a reverse slope, it is harder to stop the retreat”.
Who is it aimed at?
The game’s visuals and its reward element (when you perform well you accumulate credits that you can use to “buy” fancier types of penguins) seem tailor-made for children in late primary/early secondary school. With a couple of exceptions, most of the levels look and behave very similarly (presumably because there isn’t that much variation in the real locations), so in pure gameplay terms, the scientific realism of Ice Flows is actually something of a hindrance. That said, the game is certainly good enough to use as part of a lesson on climate change, and the “about” page has links to a number of useful resources for teachers. Finally, as Le Brocq points out in the game’s blog, video snippets from the game make excellent visual aids in public lectures about ice science.
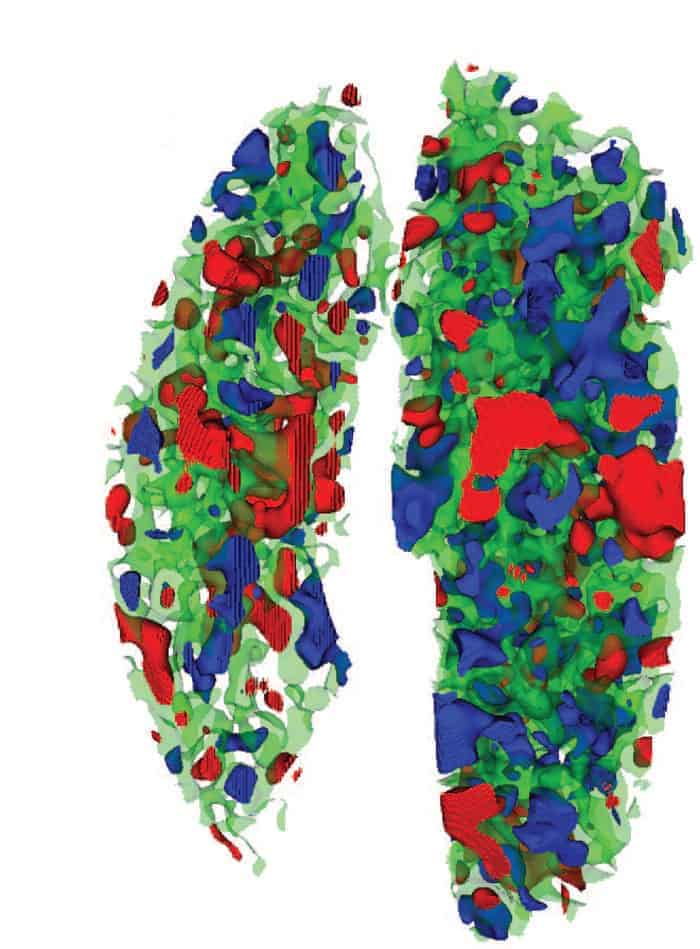
The shape of space: topology of the universe as seen by the Sloan Digital Sky Survey. (Reprinted with permission from J R Gott III et al. 2008 Astrophys. J.675 16)
Does the large-scale universe look more like meatballs, like Swiss cheese or like a sponge? A meatball universe would be composed of isolated, disconnected regions of high density embedded in a connected low-density background. The Swiss cheese universe would be precisely the opposite: low-density isolated voids embedded in a high-density connected background. A sponge is neither of the above or, if you prefer, a compromise between the two. In a sponge both the low-density and high-density regions are each connected, and ideally both the sponge and its “complement” (the network of holes) are identical in character, at least from a topological point of view.
The differences between these various types of universe – and how we can use ideas from topology to quantify and statistically analyse them – are described in detail in J Richard Gott’s The Cosmic Web: Mysterious Architecture of the Universe. In essence, Gott’s book is the story of how our current understanding of the universe’s large-scale structure emerged over the past 100 years. Note that by “large-scale” Gott means scales somewhere between the entire observable universe (which comprises a sphere with an approximate radius of 15 billion parsecs, or about 45 billion light-years) and a distance of approximately 20 million parsecs. Below that scale the universe is at present very clumpy, and at least for the purposes of this book uninteresting.
Gott begins his story around 1918, when Harlow Shapley dethroned the Sun from its supposed position at the centre of the Milky Way by mapping the distribution of globular clusters. These compact, spherically shaped, gravitationally bound objects comprise thousands of stars and are predominantly situated in the halo of our galaxy, above its dust-obscured disc (part of which we see in the night sky as the Milky Way). Shapley observed that the density of globular clusters depends not only on the angle with respect to the disc; it is also higher in the direction of the galactic centre, which lies roughly in the constellation Sagittarius. Shapley’s analysis showed that if one regards the Milky Way as a sort of saucer, we live somewhere near the edge.
From there, Gott’s story follows two parallel but intertwined threads. The first concerns progress on the observational front. Over the past century or so, we have seen ever-bigger telescopes coming online, and in parallel instrumentalists have developed ever-better ways of capturing and processing images. Once CCD images replaced photographic plates analysed by eye, the linearity and reproducibility of CCD measurement made it possible to carry out accurate photometry – a prerequisite for constructing precision quantitative surveys.
Thanks to these advances, catalogues of galaxies increased both in size and in depth, in a manner much resembling Moore’s law, and the frontiers of the universe were progressively pushed back.
Indeed, one could describe these developments as a march outward in distance and backward in time, and ultimately to the limits of our “light cone”. Our past light cone consists of those events (characterized by a position and time) from which a signal can travel to us today along some path without the velocity ever exceeding the velocity of light. Today the terra incognita of the universe has all been mapped out, at least at some rudimentary resolution. We cannot look back farther, because doing so would require signals to travel acausally, or faster than the speed of light – which, as Einstein taught us, is not possible. There remain, however, some gaps to be filled in at higher resolution, such as the epoch of the formation of the first stars and quasars. Although some basic clues exist concerning this epoch, a precise mapping must await more powerful infrared telescopes, and in particular the Square Kilometre Array and its precursors.
The other thread of this story concerns the theoretical front. Improved maps duly inspired a wide range of theories that could explain the origin of the structures being mapped out. Since the quality of the data improved only slowly, a wide range of theories remained tenable for significant periods of time. Many of these theories had little in common, and decisions on which was correct (or at least still viable) had to await better data. In the meantime, the various possibilities gave rise to lively debates – debates that could not however be resolved until better data became available.
Gott’s book combines necessary background material presented in a clear and pedagogical manner with a personal narrative emphasizing those aspects of the subject to which he and his collaborators have made original contributions. Many of the anecdotes make fun reading, emphasizing the human aspect of the endeavour. Gott explains how as a high-school student, he was fascinated by the question of how to fill space using regular polyhedra. A project on this topic won him second place in the prestigious Westinghouse Science Talent Search, and this same idea was the subject of his first published paper, in the American Mathematical Monthly. More recently, this old interest inspired work on a quantitative measurement known as the “genus statistic”, which can be used to analyse the topology of large-scale structures (such as the meatball, Swiss cheese and sponge universes previously described) and thus decide between competing notions of structure formation.
To appreciate Gott’s work on the genus statistic, some background is required. We start with the fact that the large-scale structure of the universe is often explained as arising from an initial state in which matter was distributed uniformly with a certain average density r, with low-amplitude density irregularities dr(x) superimposed. In this model, the total density field is given by r(x) = r + dr(x). Mathematically, the simplest way to set up a stochastic model for the primordial cosmological perturbations is by means of a Gaussian stochastic process. The density perturbation field dr(x) is expanded into Fourier modes and the Fourier coefficient for each mode is chosen randomly and independently according to a Gaussian probability distribution whose variance depends only on the wavelength of the mode. This variance as a function of wavelength is known as the power spectrum of the Gaussian stochastic process and suffices to characterize this process completely.
Because of the importance of Gaussian stochastic processes, most studies of large-scale structure focus on measuring the primordial power spectrum. This would be the end of the story if the primordial perturbations were indeed Gaussian. But Gaussianity should be tested by observation rather than decreed by fiat, and doing so requires new statistics beyond the power spectrum, because meatball-like or Swiss-cheese-like stochastic processes can be constructed with identical power spectra but appearances that are radically different to the eye. This is where the genus statistic comes in. It starts with a 3D catalogue of galaxies. The positions of these galaxies are used to create a smoothed galaxy density field rgalaxy(x,y,z), which is a sort of blurry approximation to the underlying density field r(x,y,z). Then the topology of the surfaces where rgalaxy(x,y,z) is constant is analysed; for example, the median density rmedian (defined as the density at which half the volume is more dense and the other half less dense) defines a 2D surface rgalaxyy(x,y,z)= rmedian. In a Gaussian theory this surface has the topology of a sponge, as shown in the figure above, which was produced using data from the Sloan Digital Sky Survey.
Today, the received wisdom is that the initial perturbations in the early universe were very nearly Gaussian random fields. The simplest inflationary models predict this, and recent extremely sensitive probes for primordial non-Gaussianity (particularly those using cosmic microwave background data) have failed to turn up any statistically significant evidence favouring a non-Gaussian stochastic process for the origin of the initial seeds of large-scale structure. But not so long ago the theoretical field was wide open, and models predicting different types of topology were able to explain the available data at the time. A Swiss-cheese universe, for example, might be explained as resulting from explosions, which would clear matter out of the voids.
This story, and the confusion it created within the cosmology community, is beautifully explained in Gott’s book. By going beyond a sort of “Cosmology 101” pseudo-history, in which observations are cherry-picked to suggest a linear path from past ignorance to current wisdom, Gott provides a complement to this more conventional story, artfully recounting the excitement, debates and false directions that led to our current “best bet” theoretical description of the universe.
2016 Princeton University Press £22.95/$29.95hb 272pp
Martian ice deposit holds as much water as Lake Superior
An underground deposit of water ice on Mars covering an area larger than Poland and containing more water than Lake Superior – the largest of the North American Great Lakes – has been discovered by Cassie Stuurman of the University of Texas, Austin, and colleagues. The deposit was found in a mid-latitude region called Utopia Planitia using SHARAD – a ground-penetrating radar instrument aboard NASA’s Mars Reconnaissance Orbiter. Its composition varies between 50–85% frozen water that is mixed with dust and larger rocky particles. The ice is buried about 1–10 m under a layer of soil, which the researchers believe stops the water from subliming into the atmosphere. “This deposit probably formed as snowfall accumulating into an ice sheet mixed with dust during a period in Mars history when the planet’s axis was more tilted than it is today,” explains Stuurman. The study is described in Geophysical Research Letters and was inspired by work done by Gordon Osinski of the University of Western Ontario. He noticed that patterns on the surface of Utopia Planitia are similar to those seen in regions of ground ice in the Canadian Arctic (see figure). Water close to the surface of Mars could be used as a resource for future human colonization of the planet. “Sampling and using this ice with a future mission could help keep astronauts alive, while also helping them unlock the secrets of Martian ice ages,” says Joe Levy of the University of Texas.
Trump victory sets the clock back, say climate scientists
“Devastating”, “embarrassed”, “worried” and “set the clock back” were just some of the words used by environmental scientists when asked for their views on the election of climate-change sceptic Donald Trump as US president – according to an article in environmentalresearchweb called “The climate after Trump”. In January, Trump will become the only leader of a major industrialized country to deny the existence of human-caused climate change and he looks set to renege on the Paris climate agreement that came into force on 4 November. “It took the US two decades to go from climate obstructionist to climate leader, and one ugly season to throw it away,” lamented Dan Kammen of the University of California, Berkeley. Other researchers believe that the scientific community was naive to think that better information and more knowledge are enough to convince wider society of the importance of tackling environmental degradation. “We must leave our castles in the sky; we must get out and listen deeply and with empathy, we must stop preaching to the converted,” says Hallie Eakin of Arizona State University.
Metamaterial is transparent at all angles of incidence
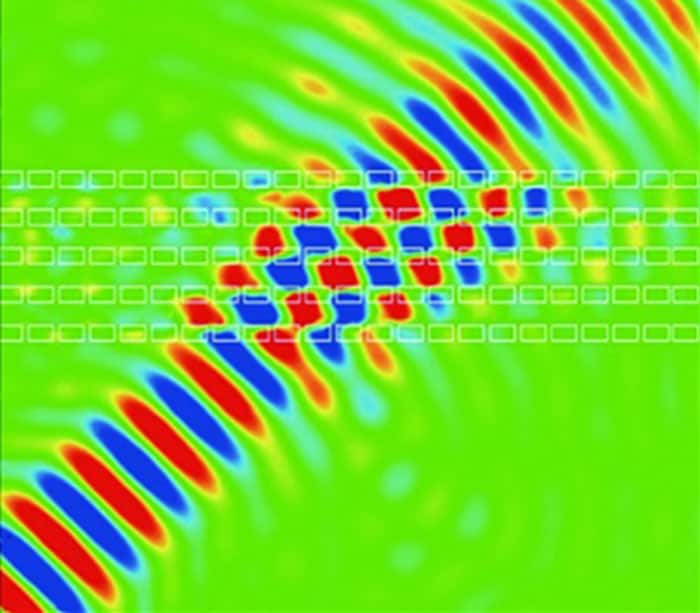
A microwave beam (red and blue) travels from the bottom left of the image. It goes through the ultra-transparent metamaterial (outlined in white) without reflecting or refracting. (Courtesy: Jie Luo et al./Phys. Rev. Lett.)
An “ultra-transparent” medium that transmits electromagnetic radiation incident from all angles has been unveiled by physicists at Soochow University and the Hong Kong University of Science and Technology in China. The new metamaterial comprises a regular array of alumina bars. These are arranged so that the refractive index within the array is identical to that in free space, regardless of the incident angle of the radiation. This is unlike materials like glass, which has an index of refraction that is greater than air. This means that some incident light is reflected at the surface of glass, and that rays are bent when they travel between the two media. Both of these effects can have distorting effects on light moving through an optical system and cause, for example, the blurring of images. The metamaterial created by Zhi Hong Hang, Yun Lai and colleagues works at microwave frequencies, but writing in Physical Review Letters, the team says that it should be possible to create ultra-transparent metamaterials that work for visible light.
You can find all our daily Flash Physics posts in the website’s news section, as well as on Twitter and Facebook using #FlashPhysics.