A new experiment to search for hypothetical particles known as sterile neutrinos has been given the green light by scientists at the CERN particle-physics laboratory near Geneva. The SFr 200m (£140m) Search for Hidden Particles experiment (SHiP) would be built at CERN and start up a decade from now. The lab’s member states will, however, need to approve the project before construction.
Predicted by certain extensions of the Standard Model, sterile neutrinos – if they exist – would interact extremely weakly, if at all, with ordinary matter. However, sterile neutrinos would transform into and out of standard neutrinos, revealing themselves via a greater- or lesser-than-expected rate of oscillation between the different types, or “flavours”, of neutrinos. Physicists working on the Liquid Scintillator Neutrino Detector (LSND) at the Los Alamos National Laboratory in New Mexico between 1993 and 1998 saw some evidence for such a transformation, but other experiments have failed to see a similar signal.
There are other plans to look for these hypothetical particles, but these experiments would focus on light sterile neutrinos with masses of less than one electronvolt. SHiP, in contrast, would seek more massive sterile neutrinos known as heavy neutral leptons. Weighing a few gigaelectronvolts, such particles would, very occasionally, decay into ordinary matter. According to SHiP spokesman Andrey Golutvin of CERN, their existence, unlike that of their lighter counterparts, could explain the predominance of matter over antimatter in the universe and the nature of dark matter. “Finding a light sterile neutrino would be a Nobel prize discovery, but it wouldn’t solve the problems of the Standard Model,” he claims.
Specific signature
SHiP would involve building a new target and detector to exploit the high-intensity proton beam produced by CERN’s Super Proton Synchrotron (SPS). Incoming protons would strike a tungsten-molybdenum target, generating mesons containing charm quarks that would decay to produce standard neutrinos, which might, in turn, oscillate into heavy sterile neutrinos. After passing through a magnetic shield to deflect muons and other unwanted particles generated in the target, the sterile neutrinos would then enter a 50 m-long vacuum chamber. If they decay, they would leave a specific signature: two oppositely charged tracks emerging from a vertex, plus a well-defined mass for the decaying particle.
The SHiP design was endorsed by CERN’s SPS and PS experiments Committee (SPSC) at a meeting held on 19 and 20 January. The committee said it was “impressed” by the collaboration’s response to earlier requests to modify the experiment’s design and schedule, and recommended that the group now prepare a comprehensive design report. Golutvin says that this report, which will require testing detector prototypes, should be ready in time for the EU’s next strategic review of particle physics in 2019. If the experiment is approved by CERN Council, he says it should start taking data when the Large Hadron Collider (LHC) emerges from its third long shutdown in 2026.
Complementary approach
William Louis, a physicist at Los Alamos who worked on the LSND, says that it is important to have a “wide variety” of sterile-neutrino experiments to “probe different mass scales”. He believes that SHiP would complement experiments in the US and Japan that are also studying heavy sterile neutrinos. Patrick Huber of Virginia Tech in the US points out that scientists have very little idea about the mass of hypothetical sterile neutrinos and, by searching for these and other particles over previously unchartered masses and interaction strengths, he believes SHiP will provide “a very nice complementary approach to the LHC”.
However, Luca Stanco of Italy’s National Institute of Nuclear Physics in Padua argues that SHiP will probe a relatively small region of “parameter space” that does not justify the experiment’s considerable price tag. He says that the idea of a heavy sterile neutrino is “intriguing and appeals to many theoreticians”, but adds wryly that “theoreticians were pretty much sure about supersymmetry too”.
When confronted with something unexplained in the data, scientists face several possibilities. Maybe there’s an error and the result is spurious. Maybe there’s a more mundane explanation they simply overlooked. Or perhaps the unexplained is a sign that a theory needs to be revised or supplanted. That last option is the rarest, at least when the theory in question is a successful one. After all, any new theory must explain all the same phenomena an old theory explained, and predict something new that can’t be handled with the old.
One unexplained result that’s been bugging physicists for more than 15 years is dark energy, which is the name we give to our ignorance. The universe is expanding at an accelerating rate, but we don’t know why. To make matters worse, dark energy comprises roughly three-quarters of the total energy content of the cosmos, so it’s not a minor thing we don’t get. For that reason, a small but dogged group of physicists thinks the existence of dark energy might be a clue that we need to revise one of the most successful theories we have: general relativity.
One way to revise general relativity is to modify the nature of the gravitational force so that it behaves as though it has mass. The alteration doesn’t have much effect on the motion of planets in the solar system. The most important consequence is instead at large distances, where the change would throttle the effects of gravity enough to account for the universe’s accelerating rate of expansion; dark energy would no longer be required.
Holding it together
Gravity is one of the fundamental forces of nature. It literally holds the Earth and all planets together, keeps the solar system cycling predictably over billions of years, and dictates the structure of the universe itself. Isaac Newton and his fellow scientists established the connection between gravity and the motion of planets, providing a deep relationship between astronomy and physics, two fields many ancient thinkers thought were separate. Albert Einstein’s general theory of relativity, the modern theory that describes gravity using the structure of space and time, celebrated its 100th anniversary last year, and is still going strong.
Physicists know general relativity isn’t the last word on gravity. For one thing, nobody has yet found a complete and satisfactory quantum theory of gravity
Yet physicists know general relativity isn’t the last word on gravity. For one thing, nobody has yet found a complete and satisfactory quantum theory of gravity, a necessary step towards describing all the forces of nature within a single theory. Any changes to general relativity from quantum gravity, though, would take place on microscopic scales far smaller than anything we can probe in the foreseeable future. Those interested in explaining dark energy think general relativity might also break down on very large scales, bigger than galaxies. That hypothesis has led to a number of alternative theories of gravity, some of which are more radical reimaginings than others.
The “massive gravity” hypothesis is one such reimagining, and an active area of research with many research articles published over the last few years. “Until the last five or so years, we didn’t even know that it was a possibility [for gravity to have mass],” says Rachel Rosen, a theoretical physicist at Columbia University in the US. But that possibility has now firmly emerged, spurred on by the desire to solve the looming problem of dark energy.
So what does it mean for gravity to have mass?
A tangled mass
In the theory of gravity as laid out by Newton, mass is the reason for gravity. An attractive force exists between any two masses and causes both the motion of planets and the falling of objects near the Earth’s surface. The strength of that force decreases with the square of the distance between the masses, so doubling the distance results in a force four times weaker. This “inverse-square law” is what makes Newton’s theory valid for describing the planets and moons of the solar system, for plotting the trajectories of space probes, or for understanding the structure of galaxies.
In some situations, however, Newton’s theory of gravity is not sufficient. General relativity kicks in when gravity is strong – near black holes, neutron stars and other dense objects – or on large scales where the amount of mass in a volume of space reaches a significant point. That’s why general relativity turned cosmology from a branch of philosophy into a branch of science: it showed how gravity governs the cosmos on the largest scales.
But general relativity isn’t merely a slight modification of Newtonian gravity: it’s a fundamentally re-conceived notion of how gravity works. First, anything with energy can produce gravity or be affected by it, without the need for mass. That’s why paths of light are curved by gravity, producing gravitational lensing and other fun phenomena. (This is related to E = mc2, but not identical to it.) Second, in Newtonian physics, a change in one mass produces an effect instantly through all of space, no matter how far away: if the Sun exploded (not that it will), Newton’s law says we’d feel the gravitational effect immediately, even though light from the Sun takes just over eight minutes to reach us. General relativity predicts that gravity propagates at the same speed as light.
From the quantum perspective, that means gravity behaves like a particle with no mass; this hypothetical particle is called a graviton. Gravitons are to gravity what photons are to light, and the two types of particles have a lot in common. Both are massless, both move at the speed of light and both have two basic types of polarization (though there are also differences that aren’t relevant in the present discussion). The first polarization type is labelled “+”, and it resembles squeezing a circle alternately horizontally and vertically if the wave is moving directly towards you; the second type is “×” polarization, and it’s the same deal, only squeezing the circle at a 45˚ angle. Unlike light, gravity is too weak for us to detect individual gravitons; instead, we see and feel the effects of countless numbers of them working, much as we usually only see huge amounts of photons at once.
But the properties of gravitons are inferred from general relativity, so alternative theories can predict different behaviours. Case Western Reserve University physicists Claudia de Rham and Andrew Tolley, along with colleagues, have worked on various models examining how a graviton with a non-zero mass could solve the dark-energy problem in cosmology. If the graviton has mass, gravity will no longer obey the inverse-square law precisely. Instead, the force will decrease faster with distance, depending on the mass of the graviton. A relatively large graviton mass means a sharp cut-off for gravitational attraction at short distances; this is precisely the case for the strong force binding the nucleus of an atom together. A sufficiently small graviton mass, however, will produce a force nearly identical to the predictions of general relativity.
Not-so-empty space Could gravity break the inverse square law at large astronomical distances? (Courtesy: Take 27 Ltd/Science Photo Library)
“We wouldn’t want the graviton mass to be much larger than 10–32 electron volts or something like that,” says de Rham. For comparison, the electron mass is about 500,000 electron volts, so gravitons would have “the smallest mass you can ever imagine”, she says. That tiny mass is what could produce deviations from general relativity on cosmological distances and time scales.
Constant solution
Ironically, de Rham, Tolley and their collaborators actually use the graviton to explain why cosmic acceleration is so small. According to particle physics, empty space is actually a stew of “virtual particles”, which may be better thought of as potential particles: a froth that could produce real particles under the right circumstances. Add up all the contributions from all these virtual particles, and you find that empty space contributes something called a cosmological constant. The cosmological constant looks like dark energy, but if calculations are correct, the universe should have a factor of 10100 more dark energy than we see. Since the universe isn’t accelerating that much, this is known as the cosmological constant problem.
“The cosmological constant problem is perhaps one of the most compelling current problems in theoretical physics,” says Rosen. “[To solve it,] we’re looking at every possible approach, but it basically comes down to: either our understanding of quantum theory needs to be modified, or our understanding of gravity needs to be modified.” A popular possibility for the first option is string theory, a modification of quantum theory that allows for a huge number of different cosmological constants.
The second option includes the massive graviton hypothesis. If gravity has a cut-off, it would dampen that acceleration down from the amount expected from the cosmological constant to the relatively small amount we observe today. “The cosmological constant could actually be large, as large as particle physics would like it to be, but we observe just a fraction of it,” de Rham says.
There is a catch, however, which lies in how the graviton’s behaviour comes about. In the massive gravity theory that de Rham and Tolley propound, the observable universe is like the surface of a bigger reality, with two or three extra dimensions lying “beneath” what we see. This concept is known as a “braneworld”, where “brane” is short for “membrane”. The mass of the graviton comes from the particular way gravity acts when it is trapped on the surface of the brane that is our universe. In physics terms, we say gravitons “acquire” mass, in somewhat the same way that electrons and quarks acquire mass through interaction with the Higgs field.
General relativity is well known for being difficult to work with, but the massive gravity theory is far more so
As the extra dimensions are the reason for the graviton mass, they are also only indirectly knowable through the effect they have on the force of gravity in our observable universe: there’s no way to independently confirm their existence. But the extra dimensions also bring a cost in terms of complication. General relativity is well known for being difficult to work with, but the massive gravity theory is far more so. The mathematical description of the structure of the universe requires a long chain of reasoning in the massive graviton theory, whereas the general relativity version – one of the huge early successes of the theory – is remarkably straightforward.
However, the real test of any theory isn’t its mathematical simplicity, but how well it matches real-world data. Tolley and de Rham point out that a massive graviton would have an effect on the same gravitational-wave spectrum that the BICEP2 telescope at the South Pole and other experiments strive to measure. The next generation of experiments, then, could conceivably provide a good test if they can overcome BICEP2’s particular difficulties of observing an unwanted foreground of cosmic dust that obscures a possible gravitational-wave signature. The modified gravitational force law would also affect the number and distribution in space of the earliest galaxies, so various astronomers are looking at whether large galaxy surveys are consistent with the massive graviton hypothesis.
However, adding mass to the graviton changes more than just the force law. “The usual massless graviton only has two degrees of freedom, similar to the two polarizations of a photon,” says Rosen. A massive graviton, by contrast, has several more polarizations, and those lead to a number of subtle – but possibly detectable – effects. In addition to the “+” and “×” modes, the circular cross-section of a wave coming towards you could rock back and forth, or shrink and expand. “Adding a small mass to the graviton is not just a large-distance modification. You can see effects at shorter distances potentially as well.”
Gravitational-wave detectors such as the upgraded Laser Interferometer Gravitational-wave Observatory (LIGO) may be able to see some of the differences in these ripples of space–time from these extra polarizations. Surprisingly, though, other experiments within the solar system could provide the fastest answers, even though the effect of massive gravity is very small. Measurements of the Moon’s position using the reflectors placed by the Apollo astronauts would be almost precise enough to see the tiny difference in the Moon’s orbit produced by massive gravity’s different behaviour.
The proliferation of theories shows both how little we understand dark energy and cosmic acceleration, but also how creative minds are working to resolve it
Of course, the massive graviton is one hypothesis among many for explaining dark energy; even the version de Rham and Tolley describe isn’t the only version of massive gravity out there. The proliferation of theories shows both how little we understand dark energy and cosmic acceleration, but also how creative minds are working to resolve it. “Should we believe that massive gravity is the true theory of nature?” Rosen asks rhetorically. “The big deal is that [a massive graviton] is suddenly a possibility, where before we weren’t sure it was a possibility or not. The truth is we don’t know.”
When the data are signposts pointing us into the unknown, it’s hard to know exactly what guide is best to choose. One possibility may be to change – again – the way we think about gravity.
As I explain in the video above, this month we have a package of articles looking at some of the issues surrounding peer review, including a news-analysis piece by Physics World news editor Michael Banks, who talks to a range of figures in physics and publishing with views on this subject.
Our cover feature this month is on the new interdisciplinary science of “network physiology”. Elsewhere in the issue, John Campbell from the University of Canterbury in New Zealand looks at Rutherford’s secret work in the First World War using sonar to spot submarines, while science writer Matthew Francis looks at efforts to rewrite the rules of gravity.
“Peer review is similar to what Winston Churchill once noted about democracy,” says David Crotty, a senior editor at Oxford University Press, who writes for the Scholarly Kitchen – a leading blog about the scientific publishing industry. “It’s the worst system apart from all the others.” Since its introduction in the 1700s, peer review has formed the backbone of scientific publishing. Used to judge the suitability of scientific manuscripts submitted to a journal for publication it has, like democracy, so far stood the test of time.
That is mostly thanks to peer review being valued and trusted. A survey of 18,000 researchers, carried out last year by Nature Publishing Group (NPG) and Palgrave Macmillan, found that the quality of peer review offered by a journal was ranked third – behind journal reputation and relevance – in a list of factors that authors considered when submitting their research. When asked about the value that publishers bring, the top response to the 2015 Authors Insight Survey was “improving papers through constructive peer review”, ahead of rapid acceptance of papers and their discoverability.
Such findings are backed up by a study published late last year – Peer Review in 2015 – by the publisher Taylor and Francis, which found that the vast majority of academics support peer review and believe that it improves their manuscripts. With responses from more than 7400 academics worldwide, 68% noted that they have confidence in the academic rigour of published articles because of peer review.
While both these reports suggest that the peer-review system is not broken, researchers’ views about how peer review should operate in the 21st century are changing in the era of digital publishing. Some complain about a proliferation of low-quality journals – most of which are open access – that seek to boost publishers’ revenues by cutting corners on rigorous refereeing procedures. Other researchers, meanwhile, complain that refereeing is done by the community as an unpaid or unrewarded service.
Another issue is the difficulty of finding enough researchers who are enthusiastic and skilled at peer review. Those who are good at the job often end up being over-burdened by requests – increasing the danger that journals promote a “clique” of trusted referees. Some also claim that peer review takes far too long. A final version of a paper can appear in a journal months after it was first uploaded to the arXiv preprint server, where many physicists deposit their paper before, or at the same time as, sending it to be peer reviewed.
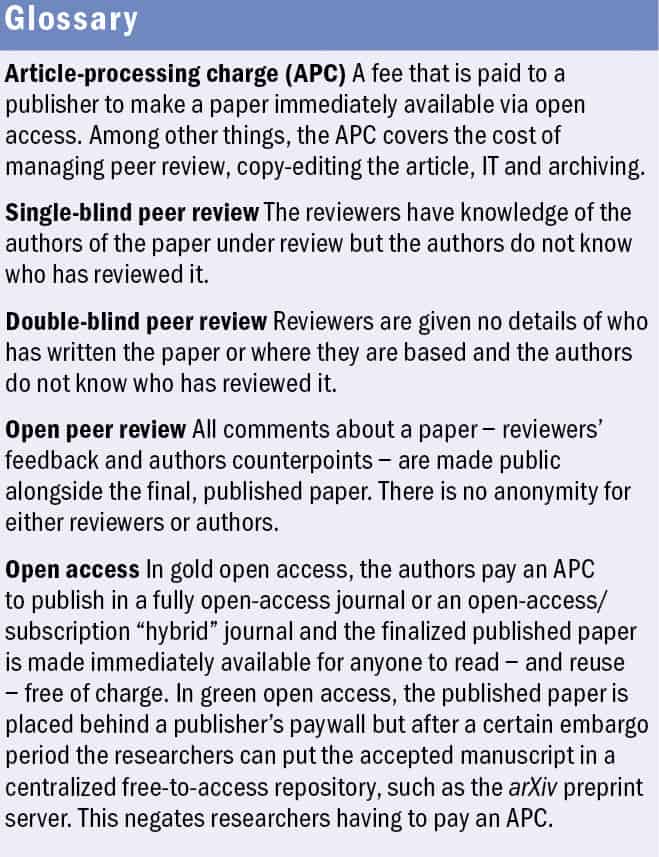
While Crotty believes that peer review works well in general, it could be “greatly improved” by making refinements to the current system. “Peer review isn’t perfect,” agrees medical physicist Penny Gowland of the University of Nottingham in the UK. “The public needs to recognize that and publishers need to recognize that.” She claims that gold open access, in which an author pays an “article-processing charge” (APC) to make it freely available to read upon acceptance, has weakened the peer-review process through the growth of publishers that exploit the system by accepting as many papers as possible to maximize their income. “It acts to undermine the scientific process and in the long term may undermine how the public views science,” she says.
Tweaks not reforms
When peer review was introduced as a means of testing the eligibility of a paper for publication, it was initially performed by the editor of the journal. That changed in the mid-20th century when papers began to be sent to external referees who were not involved in the work but active in the field. They pass a judgement on whether an article is scientifically credible and appropriate for the journal to which it has been submitted.
But one major criticism of peer review is that this refereeing process is opaque. “Peer review is a gatekeeper, but it’s also a bit of a black box, and lots of it is hidden,” says Daniel Ucko, an associate editor at the American Physical Society who is also doing a PhD on the philosophy of peer review at Stony Brook University. “The public is curious about the process and is interested to know why certain science is getting published, especially in fields such as medicine.”
Traditionally, peer review has been performed on a “single blind” basis, in which the reviewers know who has written the paper but the authors of the paper are not told who has reviewed it. But because reviewers know the authors and where they work, a reviewer may judge the paper based on that before reading it. That could lead to a bias against women, people in developing nations, early-career researchers as well as those at smaller, less-established institutions.
Ironically, one way of improving peer review is to make it less transparent. Crotty advocates double-blind peer review, in which the authors do not know who is reviewing their paper – like single-blind review – but the reviewers also do not know who has written the paper. Although this added anonymity has some advantages such as reducing the effect of bias, particularly gender-based, it is not foolproof. Reviewers could easily use arXiv or an Internet search to track down the author’s identity or institution – not hard at all in small communities – even if it is hidden in the peer-review process. Meanwhile, removing references to an author’s own work would be time-consuming.
Yet Gowland, who is a proponent of the double-blind process, disagrees that arXiv would stop effective blinding. “A properly motivated reviewer would not simply search arXiv to find the author,” she says. Indeed, Crotty says that studies of double-blind peer review have shown that reviewers actually fail to guess the authors most of the time. “Even if you manage to guess the lab, blinding the authors is good for gender bias,” he adds.
One way to counter the lack of transparency during the review process is “open” peer review, in which the reviewers’ comments – and authors’ counterpoints – are made public online together with the final accepted version of the paper. In January Nature Communications announced a year-long trial to publish all reviewer comments and author rebuttal letters for published papers in the journal, unless authors ask them not to do so. This “peer-review file” will be published along with the accepted version of the manuscript. The success of the trial will be determined by opt-out rates and other “monitoring parameters”.
Tim Smith, an associate director at IOP Publishing, which publishes Physics World, says that it would be relatively simple to publish such a peer-review file, but there would be practical issues to address such as the level of any editing required on referee comments to meet language criteria for publication.
In 2014 the European Union set up the first government-funded, multinational effort “to improve efficiency, transparency and accountability of peer review”. Chaired by Flaminio Squazzoni, a sociologist at the University of Brescia, Italy, PEERE will analyse peer review in science and evaluate different models of peer review as well as explore new incentive structures, rules and measures to improve the peer-review process.
Squazzoni, who is a fan of double-blind peer review, says there are, however, many advantages of open peer review. It would solve the transparency issue, increase the quality of reviews and encourage reviewers to stop making authors cite their own work. But Squazzoni admits it would be tricky to implement. “Imagine a junior scientist reviewing a manuscript from an established scientist. If the review is open, it might be difficult for them to reject it,” he says. “Then there is the issue of retaliation, and peer review must protect reviewers from that.”
Ucko agrees, adding that much of the effort of peer review is placed on junior scientists’ shoulders, who stand to lose by having their identities revealed. Indeed, Ucko believes that referees must remain unknown. “Anonymous referees provide candid critique,” he says. “They may have bias, but that is where the editor’s job comes in to safeguard the peer-review process.” That view is backed by Smith, who points out that IOP Publishing journals are run by in-house “peer-review experts” with responsibility for preserving the integrity of the referee selection and decision-making processes.
Credit where credit’s due
Another possible reform of the system is to incentivize reviewers to do a good job in the first place. “Peer review doesn’t have any kind of reward for scientists – except for making the authors cite your paper – so reviewers rationalize the time they spend on peer review,” says Squazzoni. “And the more people who think peer review is not the top of their agenda, the more difficult it will be to get people to do it.” While reviewers get to influence the community through peer review, as Crotty points out, “nobody would get tenure for being good at peer review”.
One way of crediting researchers for their efforts could be to pay them to do peer review. But Crotty says that would create problems. Apart from deciding who should pay, he fears a tiered system, with the best reviewers demanding more money. “That would end up being more trouble than it’s worth,” says Crotty, who adds that in March, NPG’s Scientific Reports started a trial in which authors could fast-track peer review for a fee of $750, around $100 of which went to each referee. Resignations from the journal’s editorial board over what would be a two-tiered system forced the journal to quickly backtrack.
Squazzoni agrees that financial reward is not the way forward, claiming that this would have a “crowding-out effect on intrinsic motivations of scientists”, while Ucko says anything more than a nominal financial reward would be a particular drain for journals published by learned societies, which often rely on journal income to fund their activities. Paying referees could end up increasing APCs and journal subscription costs.
Smith says that referees for IOP Publishing journals receive discounts on APCs, but admits more could be done by publishers to give individual credit to researchers for their overall refereeing activity. “Serving as a referee, editorial board member or guest editor has become an integral part of a researcher’s career and should be recognized as such,” he adds.
Another way of crediting researchers for peer review could be through the Open Researcher and Contributor ID (ORCID) system. This provides a “digital identifier” to distinguish scientists from one another and creates a record linking scientists to their research outputs such as papers and grant submissions. Some 1.8 million researchers have already registered for a unique identifier and Crotty says that the system could be expanded to include peer-review data such as introducing “peer-review citations”. Indeed, last month seven science publishers announced that as of 1 January they require researchers to identify themselves using the ORCID system when submitting papers.
For all the talk about reforming peer review, Squazzoni warns that a greater threat is the lack of data about the peer-review process itself. “We don’t have data about peer review and as a result it is poorly understood,” he says. Squazzoni says this is starting to change, with publishers offering their data to scientists to study (like in PEERE), but he says that more needs to be done. “Peer review is essential for how science works,” he continues. “And the more we know about the process, the better.”
A source of single photons that meets three important criteria for use in quantum-information systems has been unveiled in China by an international team of physicists. Based on a quantum dot, the device is an efficient source of photons that emerge as solo particles that are indistinguishable from each other. The researchers are now trying to use the source to create a quantum computer based on “boson sampling”.
Devices that emit one – and only one – photon on demand play a central role in light-based quantum-information systems. Each photon must also be emitted in the same quantum state, which makes each photon indistinguishable from all the others. This is important because the quantum state of the photon is used to carry a quantum bit (qubit) of information.
Quantum dots are tiny pieces of semiconductor that show great promise as single-photon sources. When a laser pulse is fired at a quantum dot, an electron is excited between two distinct energy levels. The excited state then decays to create a single photon with a very specific energy. However, this process can involve other electron excitations that result in the emission of photons with a wide range of energies – photons that are therefore not indistinguishable.
Exciting dots
This problem can be solved by exciting the quantum dot with a pulse of light at the same energy as the emitted photon. This is called resonance fluorescence, and has been used to create devices that are very good at producing indistinguishable single photons. However, this process is inefficient, and only produces a photon about 6% of the time.
Now, Chaoyang Lu, Jian-Wei Pan and colleagues at the University of Science and Technology of China have joined forces with researchers in Denmark, Germany and the UK to create a resonance-fluorescence-based source that emits a photon 66% of the time when it is prompted by a laser pulse. Of these photons, 99.1% are solo and 98.5% are in indistinguishable quantum states – with both figures of merit being suitable for applications in quantum-information systems.
Lu told physicsworld.com that nearly all of the laser pulses that strike the source produce a photon, but about 34% of these photons are unable to escape the device. The device was operated at a laser-pulse frequency of 81 MHz and a pulse power of 24 nW, which is a much lower power requirement than other quantum-dot-based sources.
Quantum sandwich
The factor-of-ten improvement in efficiency was achieved by sandwiching a quantum dot in the centre of a “micropillar” created by stacking 40 disc-like layers (see figure). Each layer is a “distributed Bragg reflector”, which is a pair of mirrors that together have a thickness of one quarter the wavelength of the emitted photons. The micropillar is about 2.5 μm in diameter and about 10 μm tall, and it allowed the team to harness the “Purcell effect”, whereby the rate of fluorescence is increased significantly when the emitter is placed in a resonant cavity.
Lu says that the team is already thinking about how the photon sources could be used to perform boson sampling (see “‘Boson sampling’ offers shortcut to quantum computing”). This involves a network of beam splitters that converts one set of photons arriving at a number of parallel input ports into a second set leaving via a number of parallel outputs. The “result” of the computation is the probability that a certain input configuration will lead to a certain output. This result cannot be easily calculated using a conventional computer, and this has led some physicists to suggest that boson sampling could be used to solve practical problems that would take classical computers vast amounts of time to solve.
Other possible applications for the source are the quantum teleportation of three properties of a quantum system – the current record is two properties and is held by Lu and Pan – or quantum cryptography.
Its been a strange week for scientists and celebrities popping up together on the world stage – what with rapper B.o.B and Neil deGrasse Tyson’s very public face-off about the former’s conspiracy theory claims of the Earth being flat – but it didn’t end there. In a celebrity trio that is even more surprising, physicist Stephen Hawking has come together with Hollywood actor Paul Rudd, (most recently starring in the film Ant-Man) in a video narrated by Keanu Reeves. Earlier this week, Caltech’s Institute for Quantum Information and Matter hosted the event One Entangled Evening: a Celebration of Richard Feynman’s Legacy. As a promo of sorts for the event – which had special appearances by Rudd, Reeves, Hawking, Bill Gates and even Yuri Milner, apart from actual quantum physicists such as John Preskill and Dave Wineland – they filmed the above video with Rudd and Hawking battling each other at a game of quantum chess. You will have to watch the video to see who wins.
Ancient Babylonian astronomers may have used geometry to calculate the motion of Jupiter in the night sky, which means that their understanding of applied mathematics is much more sophisticated than historians had previously thought. That is the conclusion of astrophysicist and historian Mathieu Ossendrijver of Humboldt University in Berlin, whose analysis of five stone tablets implies that the Babylonians were capable of applying geometry in an abstract sense, rather than just using it to measure physical spaces.
Ossendrijver has deciphered the cuneiform inscriptions on a tablet stored at the British Museum and linked it to four other known tablets that describe the motion of Jupiter along the ecliptic in an arithmetical fashion. The inscriptions, says Ossendrijver, indicate that the Babylonian scribes could take that arithmetical data and represent it as a graph of angular velocity versus time. Just like when solving quadratic equations graphically, the area underneath the curve of the graph can be split into segments called trapezoids, and calculating the area of the trapezoids then gives the distance that Jupiter has travelled across the sky in a given time.
“The tablet contains a complete description of the motion of Jupiter, describing how its angular velocity in degrees per day varies in different segments,” explains Ossendrijver, who is an expert in Babylonian sciences and mathematics. “So for the first 60 days, it decreases linearly, then it decreases linearly but at a faster rate, and so on.”
Prophetic omens
Astronomy was a significant part of Babylonian culture, with priestly scribes watching the skies to provide prophetic omens. Although mathematical geometry had been invented by the Babylonians sometime between 1800 and 1600 BCE, there had been no evidence of it being used for astronomy, only for measuring physical things such as plots of land. If Ossendrijver is correct, then the Babylonians were able to make the conceptual leap to apply their knowledge of geometry in more abstract fashion.
“This is the first and only time, that we know of, that the Babylonians applied it in this way,” says Ossendrijver, who dates the tablets to between 350 and 50 BCE. “There’s no other evidence that they used it outside of astronomy; in fact there’s no evidence that they even used it for any planet other than Jupiter.”
Francesca Rochberg, professor of Near Eastern studies at the University of California, Berkeley, who was not involved in Ossendrijver’s research, says it is “exciting that [he] has been able to see the connection between such procedures involving trapezoids and the problem of the ecliptical progress of Jupiter through its synodic cycle”.
Missing graphs
Not everyone is entirely convinced, however. The physicist and historian James Evans, at the University of Puget Sound in the US, says that it is “far from clear that the Babylonian scribes would have seen it that way,” noting that there is an absence of any graphs on the tablets, unlike other mathematical tablets showing the geometrical measurement of land. “So while I don’t think it is reasonable to see the Babylonian scribes as anticipating the graphical methods described by [European scholar] Nicole Oresme in the 14th century, it does seem fair to say they had an instinctual grasp of the mean-speed theorem. That’s new and very interesting.”
The tablets are all damaged in some way, so perhaps the sections containing the graphs had broken off, suggests Ossendrijver. Alternatively, perhaps there are tablets yet to be discovered that feature the graphs.
Equally puzzling is why the trapezoid method seems to be limited to only a handful of tablets describing Jupiter, and why the knowledge was subsequently lost before being reinvented in Medieval Europe. Ossendrijver suggests one possibility is that it could have been “invented by a very clever astronomer, but wasn’t then taken up or understood by others”.
The latest results from the Antihydrogen Laser Physics Apparatus (ALPHA) experiment at the CERN particle-physics laboratory in Geneva have confirmed that the electric charge of antihydrogen is indeed neutral. The experiment has improved the measurement precision of the charge of antihydrogen – a bound antiproton and positron – by a factor of 20 compared with previous results. Because the charge of the antiproton is already known to a similar precision as this latest measurement, the result also helps to refine the bound on the charge of the positron.
One of the big unanswered questions in physics is why our universe contains so much more matter than antimatter today, when equal amounts of both were thought to have formed after the Big Bang. As the Standard Model of particle physics can offer no explanation for this missing antimatter, measuring tiny differences between the behaviour of matter and antimatter could shine a light on this cosmic conundrum.
Current theories say that antimatter particles are identical to their matter counterparts, but with an opposite charge. A hydrogen atom is made up of a positively charged proton and negatively charged electron, and has zero net charge. Similarly, an antihydrogen atom is made up of a negatively charged antiproton and a positively charged positron, and should also be neutral. An asymmetry between matter and antimatter must lie somewhere, and one possible difference is that antihydrogen has some very subtle but measurable net charge. However, this has been difficult to test because of the experimental challenges involved with trapping and holding antihydrogen for long enough to make precise measurements of its charge.
Caught in a trap
ALPHA’s main aim is to study the internal structure of the antihydrogen atom and see if any discernible differences set it apart from regular hydrogen. In 2010, ALPHA was the first experiment to trap 38 antihydrogen atoms for about one-fifth of a second. The team then perfected its apparatus and technique to trap a total of 309 antihydrogen atoms for 1000 s in 2011.
With the launch of their new ALPHA-2 magnetic trap last year, and use of lasers for spectroscopy, ALPHA spokesperson Jeffrey Hangst told physicsworld.com that the team will study the antihydrogen atom’s spectrum and pick up any differences between it and hydrogen, if they exist. In its latest experiment, the team looked at the trajectories of antihydrogen atoms released in the presence of the trap’s electric field. If the antihydrogen atoms have an electric charge, the electric field would deflect them and alter their trajectories.
ALPHA-2’s latest measurement has shown that antihydrogen, just like its matter counterpart, has no charge. “That means the electrical charge of antihydrogen – the antimatter analogue of hydrogen – can be ruled out as the answer to the antimatter question,” says ALPHA team-member Scott Menary, at York University in Canada. Indeed, the result showed that both are electrically neutral at a level 20 times more precise than before. Because the charge of an antiproton is also known to a similar precision, the collaboration has also improved the previous best measurement on the positron charge by a factor of 25.
ALPHA researcher Andrea Capra, at the TRIUMF lab in Canada, says that this result is one piece in the antihydrogen puzzle, the others being comparisons of hydrogen and antihydrogen’s spectra and how antihydrogen responds to gravity, both of which are also being probed by the ALPHA team.
“Science has always been the Cinderella amongst the subjects taught in schools…not for the first time our educational conscience has been stung by the thought that we are as a nation neglecting science.”
Sounds like something David Cameron or Barack Obama might have said last week, right? Wrong. In fact, it comes from a report by the grandly named Committee to Enquire into the Position of Natural Sciences in the Educational System of Great Britain, which presented its findings clear back in…1918.
I came across this quotation thanks to Emma Smith and Patrick White, a pair of education researchers at the University of Leicester who have spent the past few years studying the long-term career paths of people with degrees in science, technology, engineering and mathematics (STEM). Smith and White presented the preliminary findings of their study at a seminar in Leicester yesterday, and one of the themes of their presentation – reflected in the above quote – was the longevity of concerns about a shortage of STEM-trained people, especially university graduates. As Smith pointed out, worries about the number and quality of STEM graduates are not new and, historically, reports of a “STEM crisis” have been as much about politics as they have economic supply and demand.
In 1950 US president Harry S Truman was asked about the possible use of an atomic weapon in the Korean War. “It is a terrible weapon, and it should not be used on innocent men, women and children who have nothing whatever to do with this military aggression,” he replied, adding “That happens when it is used.” His reply is instructive, because five years earlier, Truman had authorized the use of such a weapon on the Japanese city of Nagasaki, resulting in the deaths of more than 70,000 civilians and serious long-term illness for an even larger number.
In Nagasaki: Life After Nuclear War, Susan Southard tells the stories of five people who were in the city when it was bombed on 9 August 1945 and who survived into old age. In the days immediately following the bombing, all five of these hibakusha (“atomic bomb affected people”) helplessly witnessed the swift deaths of family members, friends and hundreds of others who had received horrific injuries from the explosion. Most hibakusha received no immediate treatment due to the severe shortage of medics and facilities, and many were confined to bed for months. Later, they endured decades of social stigma as well as a range of physical and psychological illnesses, including multiple cancers, disfigurement and post-traumatic stress. By telling their stories of lifelong suffering, they express hope that there will be “no more hibakusha” in the future.
In relating these personal stories, Southard touches on several aspects of nuclear weapons, including the military, political and historical implications of their use and the scientific study of how radiation affects people. The book’s extensive notes and source listings highlight that these subjects have been covered elsewhere (often by those with more authority on the subject), while a few other relevant topics, such as the physics of nuclear explosions and the status of nuclear weapons in international law, are virtually ignored. However, Southard did interview the hibakusha and others extensively, and within these limits, she clearly illustrates how the various aspects overlap and influence each other. For example, the personal views of the hibakusha that their bodies were “burned from the inside out” overlaps with scientific analyses conducted after the bombing. This research indicates that, in addition to external exposure to radiation, the hibakusha also ingested radioactive materials, which then irradiated their cells internally. Among those who did not survive, autopsies showed severe damage to internal organs, tissue and veins.
By 1950, as the above quotation shows, Truman had made a clear link between the personal impact of nuclear weapons and their military significance. But was such a link made before 1945? The effect of small doses of radiation on human organs, tissues and cells was certainly well-established, and while no studies could be done on people whose entire bodies were suddenly exposed to massive doses of radiation, theoretical analysis would have been possible. Southard suggests that instead of performing such an analysis, US scientists and military leaders made assumptions – for example, presuming that anyone who might be exposed to fatal radiation levels would be killed by the blast. In contrast, other writers (notably Peter Pringle and James Spigelman in their 1983 book The Nuclear Barons) have suggested that (a) scientists knew many would die from delayed radiation effects in subsequent years; (b) they failed to tell the politicians this, not realizing its relevance; and (c) had politicians known that an atomic bombing would result in people dying from radiation effects decades later, they would have regarded it as different from other military options.
Regardless of how much politicians and scientists knew before August 1945, politics certainly influenced science afterwards. As Southard explains, when reports of radiation effects on the hibakusha began to emerge, US authorities dismissed them as propaganda. Indeed, for most of the 1945–1952 US occupation of Japan, censorship effectively blocked all such reporting except for the official US investigations. Research on radiation effects carried out by Japanese scientists during the occupation years was not published until after 1951, and in the US, most media organizations complied with a request that all reporting of radiation effects be approved by the War Department before publication. One extensive US account of the plight of the hibakusha (John Hersey’s Hiroshima) did emerge in 1946, and was widely read; however, an immediate counter-campaign by the US government was so influential that US media reports on the hibakusha virtually ceased. The mushroom cloud became the iconic image of the weapons, with no representation of the people beneath them.
Southard states that she hopes her book will “help shape the course of public discussion and debate over one of the most controversial wartime acts”. As she observes, the view that the use of atomic weapons on Japan “ended the war and saved a million American lives” was promoted by US politicians at the time and “became deeply ingrained as the truth in American perception and memory”. Such views persist to this day, despite the fact that, following the declassification of many relevant documents, “no serious historian regards those as the sole considerations driving the use of the bombs”.
Southard also aims to “transform our generalized perceptions of nuclear war into visceral human experience”. The wording of this aim, and of the book’s subtitle, is ambiguous. A “nuclear war” is generally understood to mean the use of several nuclear weapons by more than one state. According to many recent analyses, the human and environmental consequences of such a war would be so devastating that any “life after nuclear war” would be unimaginably worse than that of the hibakusha.
In the 1990 book Hiroshima: Three Witnesses, which contains the writings of three hibakusha, the editor and translator Richard Minear describes these personal accounts as “their Hiroshimas”. Without such accounts, he adds, “we know little of the human truth of Hiroshima. And without the human truth of Hiroshima, we know little of Hiroshima.” The same can be said of Nagasaki, and Southard’s book is one way for us to know a little more of its human truth.