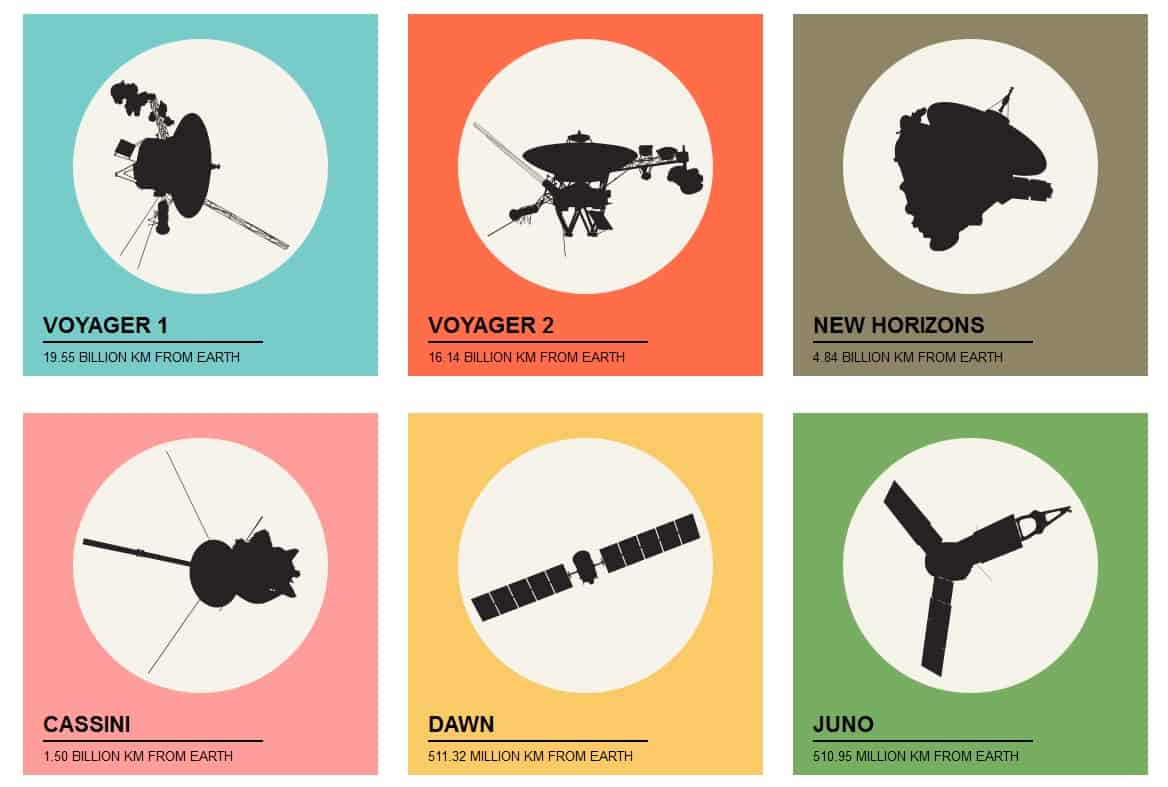
Mission accomplished: these graphics were created by Ariel Waldman and Lisa Ballard. (Courtesy: spaceprob.es)
By Hamish Johnston
“Dr Heisenberg’s Magic Mirror of Uncertainty” is the name of a series of photographs taken in 1999 by the American photographer Duane Michals. The picture over at that link is lovely, but I don’t really see the connection to quantum mechanics. I suspect my artist friends would accuse me of being a scientific literalist, which doesn’t bother me one bit.
More to my liking are the graphics pictured above, which have been created by Ariel Waldman and Lisa Ballard. The pair run a website called spaceprob.es, which “catalogues the active human-made machines that freckle our solar system and dot our galaxy”. Here is their page on Voyager 2, which is packed with facts about the mission’s instruments and many accomplishments. These and other illustrations of space missions can be bought as stickers and posters – the perfect gift for the space enthusiast in your life.
Physics experiments are not normally the stuff of “viral” videos on the Internet, but that is precisely what happened when physics students at the University of Bath in the UK decided to get creative with the Leidenfrost effect. If you are a regular reader of Physics World, you may get that déjà vu feeling when you watch the video above of water droplets zipping about the “Leidenfrost maze” built by (at the time undergraduates) Carmen Cheng and Matthew Guy – but rest assured you have seen it right here on this blog in 2013 when editor Hamish Johnston wrote about itbefore it amassed a whopping 120,150 views on YouTube.
Filaments of plasma created by a high-powered laser beam undergo a similar type of phase transition as liquid percolating through a porous material. That is the conclusion of physicists in Switzerland who have studied filament patterns in the lab and say that their findings could improve our understanding of phase transitions in general. The research could also lead to plasma filaments being used for the diversion of lightning strikes and for cloud seeding.
Filaments are bright streaks of light a few microns wide and up to several metres long that are created when a laser beam ionizes the air it travels through. This occurs at laser powers above a certain threshold when the beam “self-focuses” and so increases its intensity to the point where ionization occurs.
Variations and fluctuations
If the beam measures just a few millimetres across, then all of its power will be self-focused into one narrow beam and it will produce just a single filament. However, small variations in transverse intensity as well as fluctuations in atmospheric refractive index will cause beams with diameters of a few centimetres to self-focus at multiple narrow beams across its width. This results in large numbers of filaments – up to 1000 – more or less randomly distributed across the beam’s cross section.
In 2010 Jérôme Kasparian and Jean-Pierre Wolf of the University of Geneva, working with several groups of physicists from Germany, reported observing multiple filaments in 100 TW(1014 W) laser pulses with diameters of 9 cm. Recording the beam’s intensity using photographic paper positioned at various distances up to 15 m from the light source, the researchers saw that the filaments initially joined together to form a single cluster but then broke up into several clusters as the beam propagated forward – the result, they say, of each filament progressively draining the light from around itself.
However, Kasparian’s Geneva-based colleague Wahb Ettoumi, who is a statistical physicist, noticed something else. Looking more closely at the beam’s changing cross-sectional structure, Ettoumi observed a single cluster stretched across the width of the beam at distances of up to about 5 m. But he noticed that, within the space of a few tens of centimetres, the single cluster is replaced by many small, disconnected clusters centred on individual plasma filaments. Furthermore, the precise distance at which this occurred depended on the parameters of the beam. The sudden switch, he thought, resembled a phase change in models that describe percolation.
Coffee connections
Such models describe how individual pores within a solid material, be it a permeable rock or ground coffee beans, for example, suddenly connect up to allow a liquid to pass from one side of the material to the other as that material’s porosity is gradually increased. In the case of laser filaments, however, the connectivity instead drops suddenly as beam displacement increases. “I asked myself whether this was just an accidental resemblance,” Ettoumi says, “but then when we started studying these patterns we slowly realized there was something deeper going on.”
To check that his hunch was correct, Ettoumi, Kasparian and Wolf made a careful study of the filament patterns. They also carried out computer simulations of the beam in order to visualize the beam’s profile at a greater range of propagation distances. Doing so, they confirmed that the beam does indeed undergo a phase transition. However, they found that the transition differed slightly from the one that governs percolation. In particular there exists a minimum size of filament cluster – due to the robustness of single filaments – that does not occur under standard percolation.
The researchers say the results show laser filamentation to be a “very promising” system for investigating phase transitions, given that the transition can be directly observed and the relevant parameter – propagation distance – changes continuously. But they also believe that the work could find applications outside the lab. In principle, filaments produced by a powerful laser beam pointed at a cumulonimbus cloud could be used as conducting channels to guide lightning safely to ground. However, the limited length of individual filaments means that electrons would have to “hop” from one filament to another. Optimizing this hopping, says Ettoumi, would depend on knowing the intensity distribution across the beam.
Rainmaking filaments
According to Ettoumi, laser filaments might also be applied to rainmaking. They could, he explains, be used to break apart molecules in the atmosphere in order that the resulting fragments serve as nuclei around which water vapour condenses and forms droplets. “This could be used to trigger rain,” he says. “To date it has been shown to work in a cloud chamber, but not over longer distances.”
Daniele Faccio of Heriot Watt University in the UK believes the latest work could prove useful both scientifically and practically. He says that seeing a new kind of phase transition in an optical system, as opposed to a more conventional atomic system, “stimulates new ways of thinking”. But he cautions that any new insights will need to account for the observed phase transition’s departure from standard percolation theory.
In this International Year of Light (IYL 2015) we don’t just want to tell you about how great light and its applications are, we want to show you too. So in this short video, industrial scientist and outreach enthusiast Neil Downie demonstrates the phenomenon of strong focusing using nothing more than a basic laser and some cheap magnifying glasses he bought on the high street. It is a demonstration that you could easily replicate – either for your students or just for your own amusement.
In the first part of the demonstration, Downie shows how light can be transmitted to a point straight in front of the laser, even when it has to pass through a series of magnifying glasses that are aligned slightly off-axis. You can see how the light wiggles its way along the line of magnifying glasses, with its deflections appearing to be “corrected” as the light is focused on the centre of each lens. It is a similar effect to that found in particle accelerators where electromagnetic lenses are used to focus beams of charged particles.
In the second part of the demo, Downie uses the same equipment to show how light can be bent around an arc. This time, rather than the strong focusing effect, instead he is using the fact that light is deflected as the beam passes through the edges of each of the lens. It is the combination of strong focusing and deflection that enables particles to be accelerated to high speeds while remaining focused at particles accelerators such as CERN’s Large Hadron Collider (LHC).
Downie is the author of The Ultimate Book of Saturday Science, in which he collects a selection of his favourite science demonstrations that he has presented at a long-running Saturday-morning science club for high-school students in the UK. He is the author of a feature article that will appear in the upcoming April issue of Physics World, in which he provides instructions for five other quirky demonstrations, including a “vacuum bazooka” and a “ball river bobsleigh”. The digital edition of that issue will feature videos of each demonstration for you to enjoy.
If you want to enjoy more light-related content, then the March issue of Physics World is a special issue devoted to light and light-based technology to mark IYL 2015. If you’re a member of the Institute of Physics (IOP), you can enjoy access to new issues as soon as they are available with the digital edition of the magazine on your desktop via MyIOP.org or on any iOS or Android smartphone or tablet via the Physics World app, available from the App Store and Google Play. If you’re not yet in the IOP, you can join as an IOPimember for just £15, €20 or $25 a year to get full access to Physics World both online and through the apps.
Avid readers of this blog may remember the 560-piece LEGO model of CERN’s ATLAS detector at the Large Hadron Collider (LHC), which was built by particle physicist Sascha Mehlhase of the Niels Bohr Institute in Copenhagen.
Not to be outdone, LEGO fan Jason Allemann then created a LEGO-inspired particle accelerator – dubbed the LEGO Brick Collider – that was submitted to the LEGO Ideas site, which lets fans share blueprints of their own models.
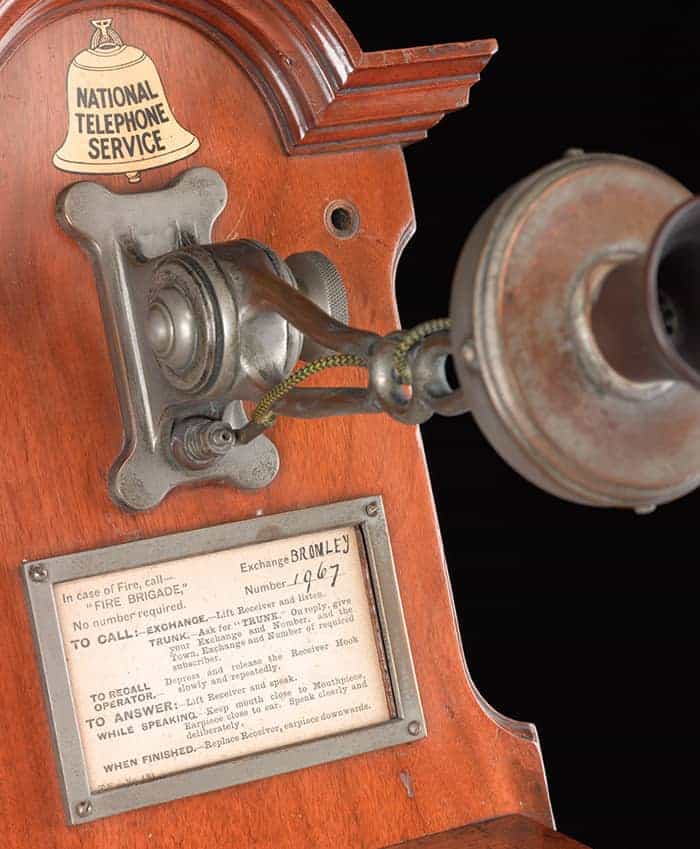
Transformative Like many new technologies, the telephone took a while to be considered a technology in its own right, rather than an update to the electric telegraph. (Courtesy: Science Museum, London)
Those of us who have lived through the past two or three decades cannot help but be amazed by the revolutionary transformation of communications, both in scientific research and in everyday life. But how does one convey this defining phenomenon of our time in a museum exhibition? After all, the fascination of computers and mobile phones lies mostly in what their software can do, rather than in the external appearance of the hardware – despite the endless efforts of designers and advertisers to persuade us otherwise.
This was the problem the Science Museum in London faced when planning its permanent new gallery on “The Information Age” and in compiling the general-interest book (published under the same title) that acts as a companion to the exhibition. As Tilly Blyth, the museum’s keeper of technologies and engineering, confesses in the book’s introduction, “There is something fundamentally contradictory and incongruous about ‘capturing’ or ‘displaying’ the information age in a museum. What is the meaning of displaying an information machine, if the information it carried or processed cannot be seen?” By way of analogy, observing the players in an orchestra is a lot less satisfying for an audience than hearing them play music.
Both the exhibition and the book solve the problem brilliantly, though, each in a way that suits its medium. The exhibition displays 19th-century, 20th-century and near-contemporaneous objects (including a model of an Apple computer I discarded only in 2010!), mixed with information that moves, speaks and sometimes interacts with the viewer via screens, soundtracks and computer keyboards. The book, for its part, offers easily readable and authoritative text written by Blyth, her fellow curators and several outside contributors, including the journalist Tom Standage writing on telegraphy (a technology he dubbed “The Victorian Internet” in his 1998 book on the subject); David Attenborough on the introduction of colour television; and entrepreneur Mo Ibrahim on the spread of mobile-phone networks in Africa. Their words are illustrated throughout with numerous, well-chosen colour photographs of such ravishing three-dimensionality that some readers will feel like running their fingers over the wires of the first transistor (admittedly a replica) or warming their hands with the heat of thermionic valves. (But let’s not become sentimental and nostalgic about childhood electronics…)
Both the exhibition and the book cover the last two centuries of information technology by dividing the period into six thematic sections (hence the reference to “six networks” in the book’s subtitle). The first section, “The Cable”, covers electric telegraphy, invented in the 1830s; the second, “The Broadcast”, is about radio and television; the third, “The Exchange”, concerns telephony; the fourth, “The Constellation”, deals with satellite communications; the fifth, “The Web”, investigates computer networks; and the sixth, “The Cell”, is devoted to mobile and cellular networks. In each instance, the science behind the technology is explained (albeit more fully in the exhibition than in the book) along with its impact on society.
One persistent theme that emerges is that new technologies can require a long time to find their way in the world. For example, the tele-phone took until the 1970s – some 80 years after its commercial introduction into Britain – to realize its potential “to ease domestic isolation and sustain British women’s relationships with family and friends”, as historian Lucy Delap observes in her essay “Women and the ‘tele-phone habit’?”. Indeed, when the tele-phone was invented in the 1870s, it was initially regarded not as an altogether new technology but rather as an improvement of the electric tele-graph; Alexander Graham Bell’s 1876 patent on the telephone was entitled “Improvements in Telegraphy”. In a letter to potential British investors, Bell argued that “All other telegraphic machines produce signals which require to be translated by experts, and such instruments are therefore extremely limited in their application. But the telephone actually speaks.”
Almost as surprising is that the scientists and engineers who founded the computing industry between the 1940s and 1960s did not foresee that personal computers would be useful to white-collar workers in offices; that vision arrived only in the mid-1970s with the founding of Apple and Microsoft. Lasers are not part of the book, but I was nevertheless reminded of how they were regarded as potentially useless for several years after their invention in the 1960s. Colleagues famously used to tease Charles Townes, one of the inventors, by calling the laser “a solution looking for a problem”. As Townes admitted some four decades later, “The truth is, none of us who worked on the first lasers imagined how many uses there might eventually be.”
Often, of course, the barrier to a technology’s establishment is an economic one. In “Connecting Africa”, Ibrahim – who was born in Sudan, but trained as an engineer in Britain with what was then British Telecom – writes of the impossibility of raising international finance for telephony in Africa in the 1990s, because of the continent’s reputation for genocide, dictators and famine. But in the end, he notes, this failure had an upside: “The failure to build robust fixed-line networks enabled African countries to leapfrog that technology and land firmly in the mobile age.”
The book’s only serious weakness might be said to be terminological, rather than technological. Exactly what do we mean by “information”? James Gleick, author of The Information, takes up the challenge of defining this slippery concept in his introductory essay “Information: the blood and the fuel, the vital principle”. He deals well with how Claude Shannon mathematized the hitherto vague concept of information in the late 1940s, but then takes refuge in a hyperbolic comment by quantum theorist John Wheeler (of “It from Bit” fame): “What we call reality arises in the last analysis from the posing of yes/no questions.” He also aptly informs the reader that “hardly any information technology becomes obsolete”, citing the earliest information technology of all, written language, which remains crucial to communication. But then he seriously misleads by claiming that “The first code of all – the one that gave birth to all the rest – is the one we take for granted: the alphabet.” Not only were the most ancient writing systems – the decidedly non-alphabetic Mesopotamian cuneiform and Egyptian hieroglyphs – invented a millennium and a half before the first appearance of the alphabet in Palestine, some current writing systems, such as those of China and Japan, did not originate from the alphabet.
That said, it is heartening to find the Science Museum and its publisher Scala still investing substantial money, time and expertise in an information technology that is so many centuries old. The Information Age is a book that will undoubtedly “inform, educate and entertain” – in the famous phrase of the first director-general of the BBC, John Reith – for many years to come.
Has anyone ever asked you to explain physics “in terms your grandmother would understand”? If so, did you ever stop to think that this might be just a tad unfair on those grandmothers who have, say, several scientific diplomas squirrelled away in their attics, or who started programming computers back when it involved vacuum tubes and punch cards and actual bugs crawling in and shorting out connections, so don’t you come to me complaining about the battery in your smartphone, young lady, I mean, honestly, kids these days, tcha! Grandma Got STEM is a blog that collects and disseminates the stories of women like this, with the goal of inspiring the next generation and countering assumptions about the kinds of people who “get” science and technology.
Who is behind it?
The blog’s founder and editor is Rachel Levy, a mathematician at Harvey Mudd College in California, US. She started Grandma Got STEM after becoming frustrated at the casual (but usually not malicious) ways that older people, especially women, are stereotyped as being unable to understand complex concepts in science, technology, engineering or mathematics (STEM). Most of the blog’s entries are written by other contributors, who are often children, grandchildren or colleagues of scientifically minded women. Occasionally, the “grandmas” themselves contribute first-person accounts of their careers and experiences in science.
Who are some of the women profiled?
There are a few well-known names in the mix, including the physicists Lise Meitner and Maria Goeppert-Mayer and the crystallographers Dorothy Hodgkin and Rosalind Franklin. However, the real strength of Grandma Got STEM is the way it brings recognition to dozens of women who had perfectly ordinary scientific careers – ordinary, that is, except for the fact that they worked in fields that were (and in some cases still are) heavily dominated by men. A good example is an entry written by Gizem Karaali, a mathematician at Pomona College in the US who counts two STEM-savvy women among her forebears. One of them is her mother, Artemis Karaali, a chemical engineer and food scientist who recently retired from Istanbul Technical University. The other is her paternal grandmother, Selma Karaali, who earned a PhD in optics and spent most of her career as a physicist at Ege University in Izmir, Turkey. Karaali describes her grandmother as “the smartest woman I ever met” and recalls spending afternoons working with her on geometry proofs as a schoolgirl. When she took the proofs to class the next day, Karaali recalls, “if there were no volunteers to put the solution on the board for the problem, my teacher would ask: ‘So Gizem, what has your grandmother to contribute to this discussion?'”
Are all of them actually grandmothers?
A few of them aren’t – at least, not in the strict biological sense. One of the other physicists featured in the blog is Elizabeth Rona, a Hungarian-born nuclear scientist who worked with Frédéric and Irène Joliot-Curie in Paris in the 1920s and later on the Manhattan Project in the US. Rona never married and had no children, but the author of her entry on Grandma Got STEM, retired physicist Carl Helrich, remembers her as “a grand old lady of nuclear physics” and an inspiration to him and many other scientists at Oak Ridge National Laboratory, where she spent her later career.
I know a couple of STEM grannies. Can I write about them?
Of course! Grandma Got STEM is a collaborative project and Levy welcomes contributions from anyone with a story to tell about inspiring older women who work, or used to work, in a STEM field. If you like the idea, but can’t think of anyone to interview, check out Levy’s post from December 2014, which includes some tips about selecting interviewees and deciding what questions to ask them. She is particularly keen to get students to become “junior reporters” for the site by interviewing women in their own families or communities (it would make a great class project for almost any age group), and she is also trying to make the blog more geographically diverse, as the “grandmas” featured in it currently hail from only a handful of countries. Finally, it must be noted that there aren’t many physicists yet in Levy’s list of STEM-friendly grandmas. Surely this is a problem that Physics World readers can help solve?
Scientists in the US have made the first direct measurement of the increase in the greenhouse effect caused by rising carbon-dioxide levels in the atmosphere. Their ground-based observations were carried out over a period of 11 years at two different locations – Oklahoma and Alaska – and show that infrared emissions from carbon dioxide have increased during that time in agreement with theoretical predictions for man-made climate change. Their study also includes the first direct observation of the large annual dip in greenhouse heating that occurs in spring, when there is a sharp increase in the uptake of carbon dioxide by plants.
Much of the near-infrared, visible and ultraviolet light from the Sun passes straight through the atmosphere and warms the surface of the Earth. The warm surface emits infrared light that gets absorbed by carbon dioxide and other atmospheric gases, before being re-emitted in all directions. Much of this emission is downwards, making the surface of the Earth warmer than if it had no atmosphere. The strength of this greenhouse effect is quantified in terms of “radiative forcing” – the difference between the rate at which solar energy is absorbed by the Earth and the rate at which it is radiated back into space.
Atmospheric struggle
Although the role of carbon dioxide as a greenhouse gas has been well established by lab experiments, scientists have struggled to measure its effect in the real atmosphere, which contains a mixture of different greenhouse gases, as well as clouds and other weather-related phenomena. Now, however, Daniel Feldman and colleagues at the Lawrence Berkeley National Laboratory and other institutes in the US have used two ground-based Atmospheric Emitted Radiance Interferometer (AERI) facilities to measure how much infrared light is returned to the surface of the Earth from carbon dioxide alone. According to Feldman, the team has also “controlled for other factors that would impact our measurements, such as a weather system moving through the area”.
Feldman and colleagues examined a total of 8300 measurements made in Oklahoma and 3300 made in northern Alaska between 2000 and 2010. They found that radiative forcing by carbon dioxide has increased in both locations at a rate of about 0.2 W m–2 per decade. To put that into perspective, scientists have calculated that the total forcing today caused by human-related carbon-dioxide emissions since the start of the Industrial Revolution is about 1.82 W m–2.
The results agree with radiative-forcing values calculated using CarbonTracker 2011, which is a measurement and modelling system that provides carbon-dioxide concentrations at a regional level. This means the measurements back up predictions that the greenhouse effect is becoming more significant as a result of increased carbon-dioxide emissions from human activities such as the burning of fossil fuels. The results also suggest that current climate models are doing a good job of describing the impact of carbon dioxide on the Earth’s climate.
Critical link
“Numerous studies show rising atmospheric carbon-dioxide concentrations, but our study provides that critical link between those concentrations and the addition of energy to the [Earth] system, or the greenhouse effect,” Feldman says. His team’s measurements also show the sharp annual drop in radiative forcing that occurs in the spring when plants absorb large amounts of carbon dioxide from the atmosphere. While this effect is predicted by theory, this is the first time the effect of plants has been measured directly.
The standard approach in the developed world is for people with a vision impairment to visit an optician for an eye test. They are given a prescription, the lenses are produced and they can choose the frames they would like from a shop. In this scenario one relies on the presence of trained opticians and the infrastructure to produce and distribute the required materials. But these are not present in many parts of the world. “Roughly speaking, in parts of sub-Saharan Africa there’s going to be about one optician per million of the people,” says Silver.
To get round this limitation, Silver – who is an atomic physicist at Oxford University – developed a concept in the 1980s for glasses that can be self-tuned to meet an individual’s prescription. The basic idea is that each lens consists of two flexible membranes filled with a liquid. So, by adding or removing fluid, the shape and thus the power of the lens can be adjusted by the individual wearer.
In this podcast, Silver talks about how the first incarnations of his so-called Adspecs have already made a huge difference to individual lives in some parts of the world. But he has also been busy developing the technology to improve the quality and make it more accessible. Silver’s team at the Centre for Vision in the Developing World is now producing an updated version of the glasses called “New Adspecs”, which make it easier for individuals to set their own prescriptions. Some 500 pairs of these were distributed to Syrian refugees in Jordon in 2014. He is also looking to develop new styles of glasses, which could also help to improve the uptake of the technology.
Silver was interviewed by Physics World reporter James Dacey at the UNESCO headquarters in Paris during the opening ceremony of the International Year of Light (IYL 2015). Find out more about that event and some of the other light-based technologies in the spotlight this year in this short film.
Also, don’t forget to check out our free-to-read digital collection of 10 of the best Physics World features related to the science and technology of light, including an in depth article about Silver’s Adspecs initiative.
Astronomers studying the spectrum of a distant quasar have found that the ratio between the mass of the proton and that of the electron is constant – its value 12.4 billion years ago was identical to its value today – with a precision of 10–6. The study is crucial if physicists are to test theories that go beyond the Standard Model, as well as the nature of the mysterious dark energy that is accelerating the expansion of the universe. The results allude to the fact that dark energy – if it exists – has remained unchanged since the universe’s early days.
Using data gathered by the European Southern Observatory’s Very Large Telescope (VLT) in Chile, the team of astronomers, led by Julija Bagdonaite of VU University of Amsterdam, made use of light from a quasar – a distant galaxy powered by a hugely energetic and luminous supermassive black hole – shining through a “foreground” galaxy. In this case, the foreground galaxy itself existed 12.4 billion years ago, at a redshift of 4.22, when the universe was barely a 10th of its current age, while the quasar, at a redshift of 4.42, is even more distant. Molecular hydrogen in the foreground galaxy absorbs the quasar’s light, so that it is possible to detect specific energy transitions thanks to their recognizable spectral features. Should the value of the mass ratio “μ” be different, it would shift the levels of the energy transitions in the hydrogen.
Varying constants?
The mass of the proton – 1.67 × 10⁻²⁷ kg – and the mass of the electron – 9.11 × 10⁻³¹ kg – are fundamental constants, along with other supposedly invariable properties such as Planck’s constant, the speed of light and the gravitational constant. The values of these constants cannot be derived from theory; as far as we can tell, they just are. However, some speculative theories that attempt to take physics beyond the Standard Model predict that these constants can change. The presence of scalar fields in the universe – fields with a single mathematical quantity that inhabit every point in space, such as dark energy’s quintessence or the Higgs field – may provide a means for this variance.
“Such scalar fields are likely to interact with fundamental particles such as electrons and quarks, and possibly affect how massive they appear,” says team member Michael Murphy of the Swinburne University of Technology in Melbourne, Australia. “It is possible that scalar fields, including a quintessence field, may cause variations in the fundamental constants, including μ.” The universe spent the first half of its life gradually transitioning from a matter (gravity)-dominated cosmos to a universe dominated by dark energy. Should μ be found to be different on either side of this transition, it would hint at the nature of dark energy. As well as measuring the proton–electron mass ratio, last year Murphy was also part of a team using this method and data from the VLT, Keck and Subaru observatories to search for variations in the fine-structure constant.
Methanol measurements
In 2013 Bagdonaite and co-author Wim Ubachs, also from VU Amsterdam, were part of a team that constrained any variation in μ to less than 10–7 in a galaxy that existed seven billion years ago, based on energy transitions in the spectra of methanol in interstellar clouds. This is an order of magnitude more precise than the new measurement, but it is much more difficult to make these measurements at higher redshifts. Rodger Thompson of the University of Arizona, who has made previous measurements of μ but who was not involved in the current research, says that the team’s result is very important as “it is the highest redshift limit on the variance of μ that exists”.
The results do not signal the end for unchanging constants. Indeed, Bagdonaite told physicsworld.com that “finding a variation at, say, the 10–9 level would be just as exciting and revealing, and I think that efforts to improve on the current limits will continue”.