Astronomers in the UK and Sweden say that they have found important clues in a mystery surrounding a type of supernova that could be the main source of calcium in the universe. The team looked at “calcium-rich supernovae”, which are relatively weak and short-lived stellar explosions that appear to occur inexplicably far from the centres of galaxies. Its study suggests that such supernovae probably involve a white dwarf and neutron star that are ejected from a galaxy in an initial supernova and then merge sometime later to create the second explosion.
Supernovae are exploding stars that can outshine entire galaxies before fading after a few weeks or months. They occur either when a star no longer produces enough energy to prevent gravitational collapse, or when a star suddenly acquires large amounts of matter from a disintegrating neighbour.
Vast amounts of calcium
These explosions are an important source of elements in the universe that are heavier than oxygen. In 2003 astronomers discovered a new type of supernova that produces vast amounts of calcium. Observations suggest that about half of the material produced by these explosions is calcium and this could explain the large quantities of the element seen in galaxies like the Milky Way – and here on Earth where calcium is essential for life.
A puzzling aspect of the 12 known calcium-rich supernovae is that they appear to occur at large distances – tens of thousands of light-years – from any possible host galaxies. This is unlike other types of supernova, which tend to occur in regions that are populated by lots of other stars.
Now, Joseph Lyman and colleagues at the University of Warwick, Lund Observatory and the University of Leicester have used the Very Large Telescope in Chile and the Hubble Space Telescope to study the regions surrounding these supernovae and have confirmed that they exist far from the nearest possible host galaxy.
How did they get there?
“We present observations, going just about as faint as you can go, to show there is in fact nothing at the location of these transients – so the question becomes, how did they get there?” he ponders. Furthermore, the observations revealed no remnant stars in the vicinity of the supernovae, which means that they are unlikely to be formed by the explosion of a very massive star that has been ejected from a galaxy.
What the team did notice, however, is that the light given off by the supernovae is similar to that seen during short-duration gamma-ray bursts (SGRBs). These also occur in isolated regions of space and are thought to involve the collision of two neutron stars or a neutron star with a black hole. While SGRBs are much dimmer than calcium-rich supernova – and do not appear to produce much calcium – this coincidence suggested to Lyman and colleagues that a neutron star might be at the heart of the mystery.
Fleeing companions
Neutron stars are themselves produced in supernovae and often emerge with high velocities that can take them far from their galaxies of origin. Furthermore, neutron stars can sometimes exist in binary systems. Putting all of this together, Lyman and colleagues believe that calcium-rich supernovae occur when a high-velocity neutron star is accompanied by a white-dwarf companion as it speeds away from its galaxy of origin. Material being sucked into the neutron star from the white dwarf will eventually trigger a supernova, which the astronomers calculate would provide the right mechanism for producing both lots of calcium and the amounts of light seen from calcium-rich supernovae.
While this latest work can explain many of the mysterious properties of calcium-rich supernovae, it is by no means the last word on the subject. Indeed, the team’s calculations suggest that the merger of a neutron star and a white dwarf should produce a burst of high-energy gamma rays. As a result, the team recommends that the gamma-ray output of any new calcium-rich supernovae be monitored.
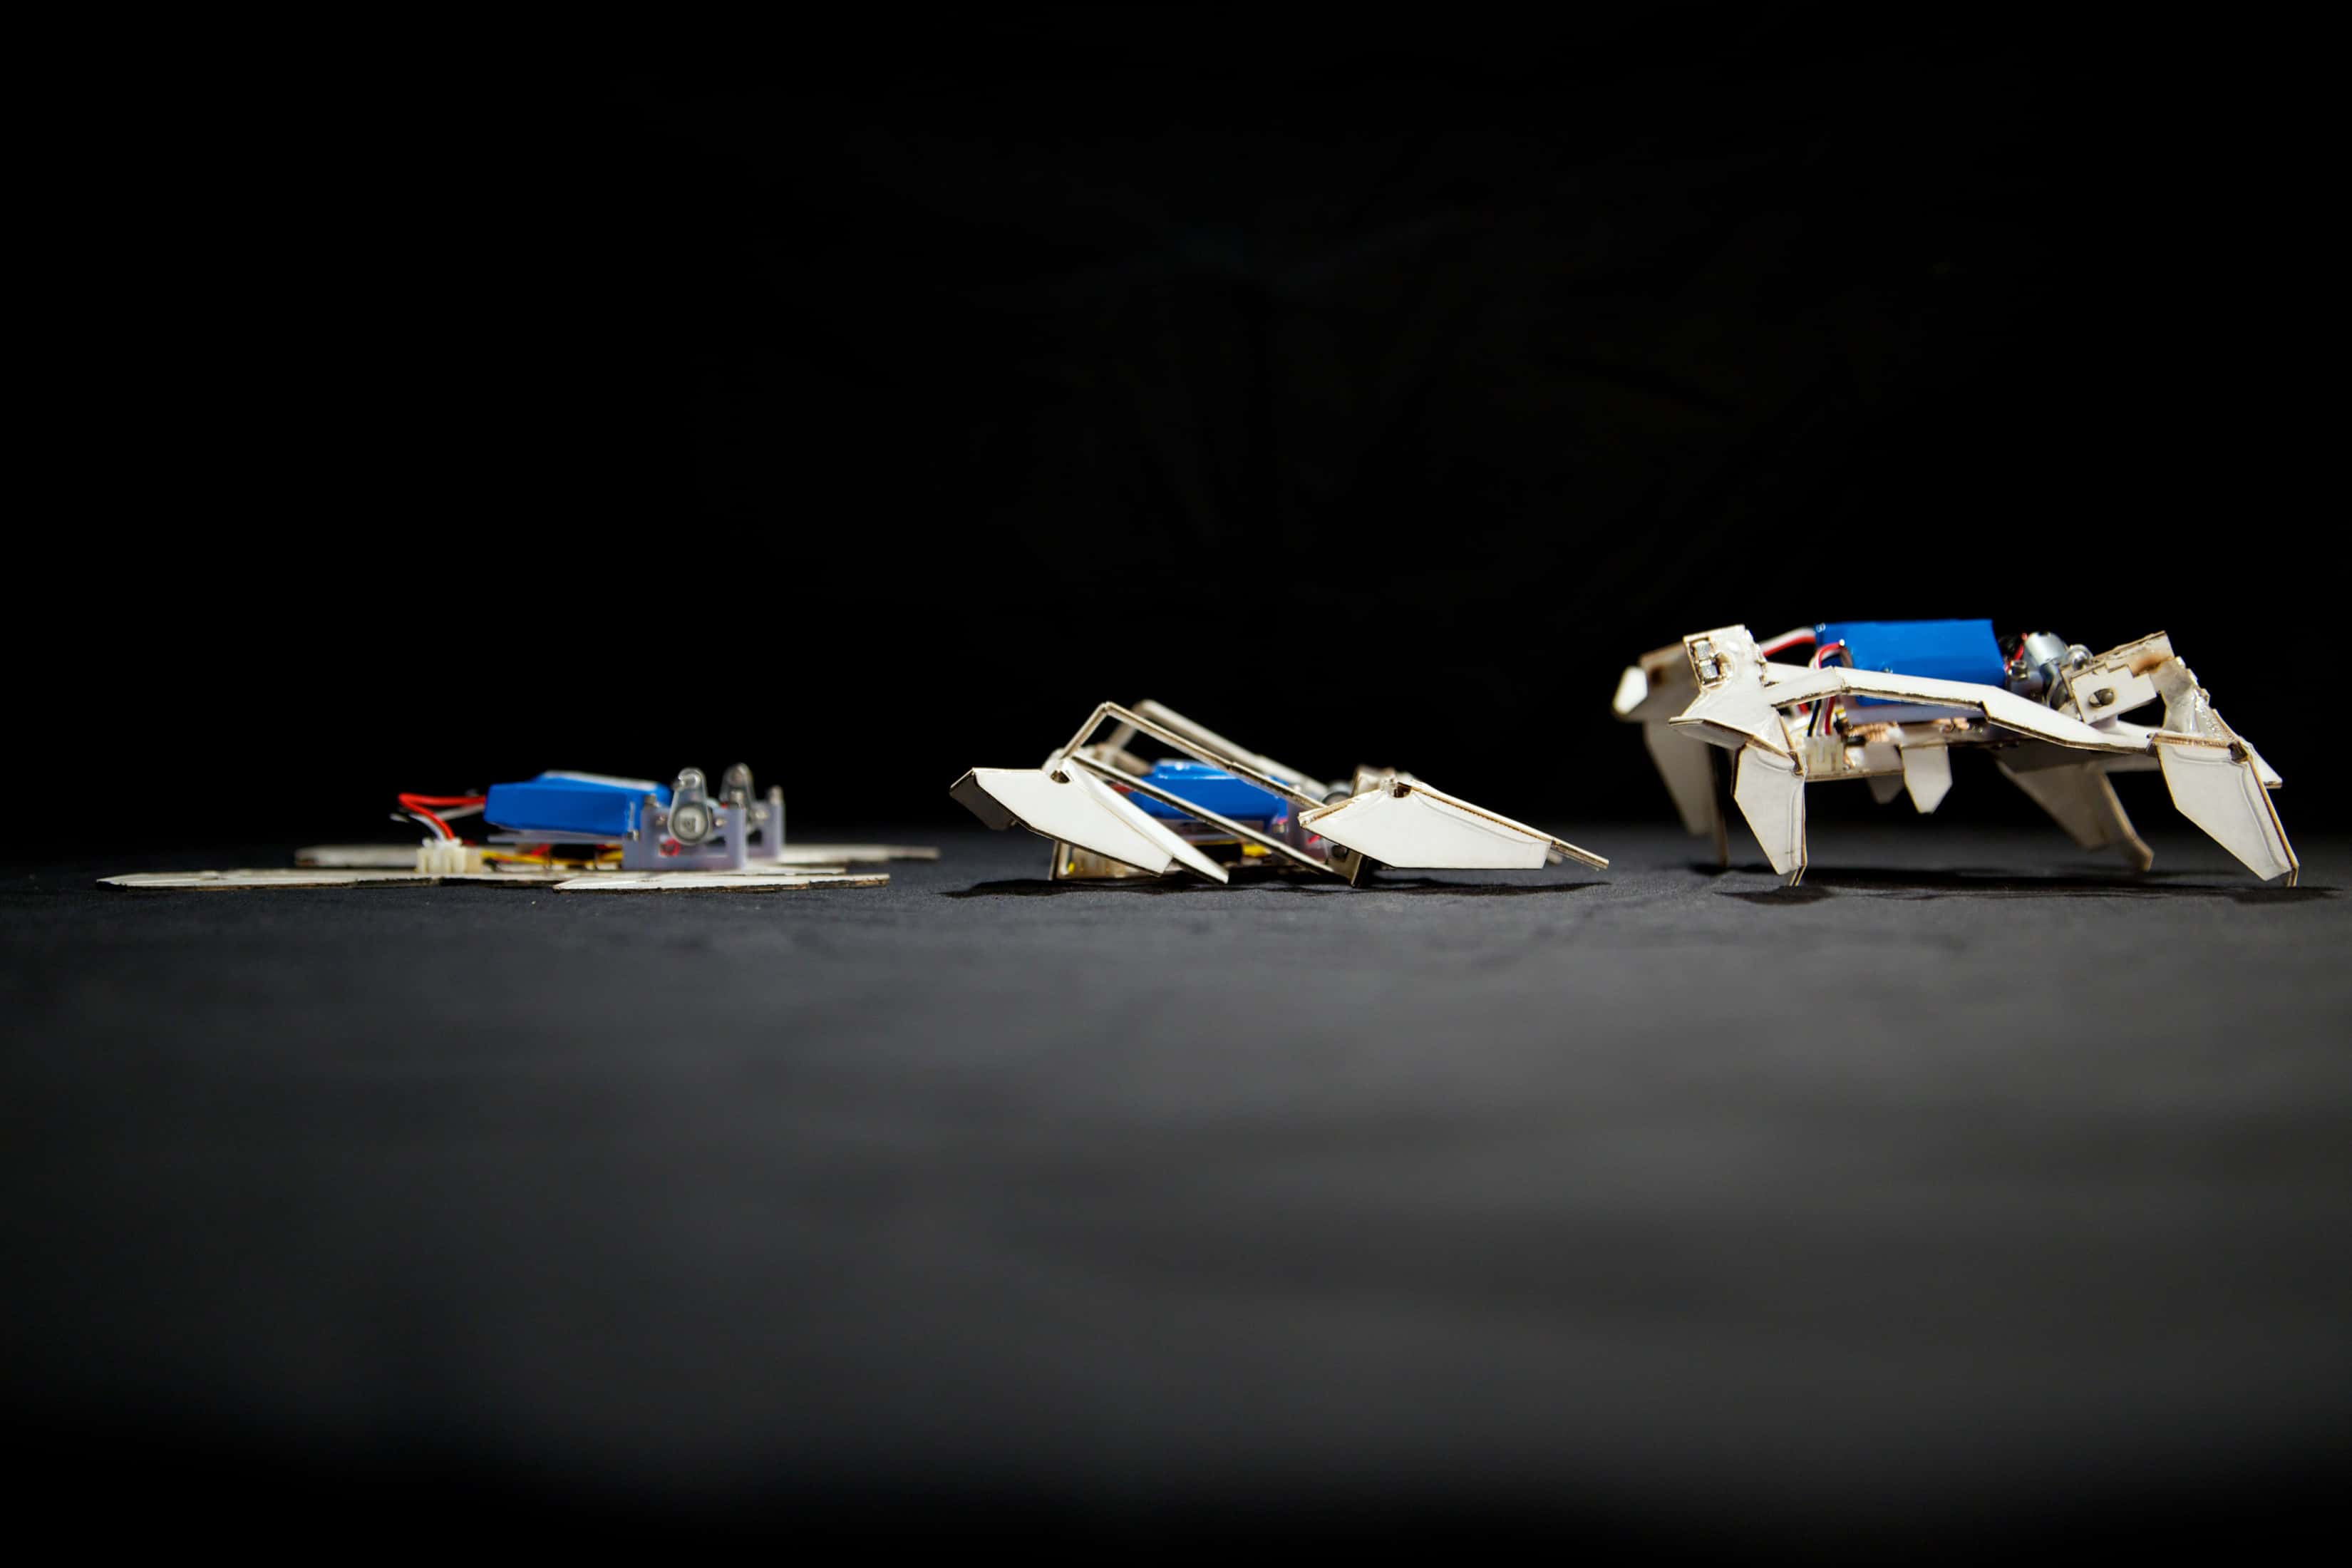
Ready, steady, go: a profile view of the “transformer” robot. (Courtesy: Seth Kroll, Wyss Institute)
By Tushna Commissariat and Michael Banks
While the latest Transformers film hit cinemas in the UK earlier this month, scientists in the US at Harvard University, along with colleagues at the Massachusetts Institute of Technology, have developed the very first “real life” transformer: a robot that starts out flat, folds and assembles itself into a complex shape and can then crawl away – all without any human intervention. Indeed, these printed robots can self-fold themselves in about four minutes – a huge improvement on previous models that could take up to two hours. They can even turn and naviagte around, making them a handy and practical tool.
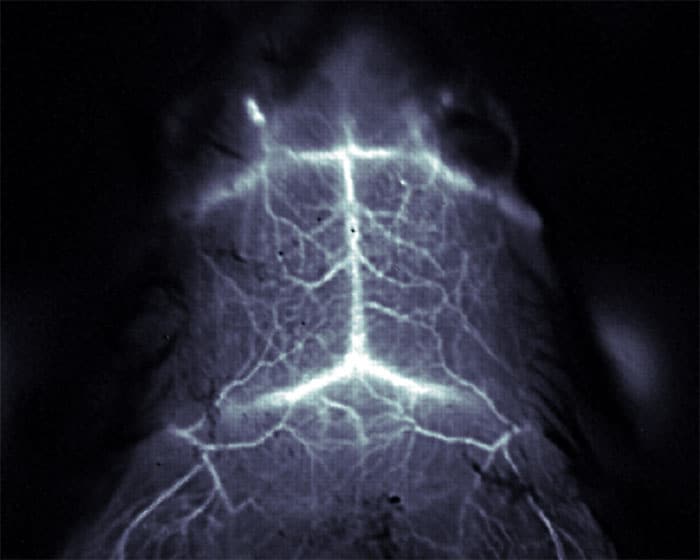
Researchers at Stanford University in the US have developed the first non-invasive imaging technique that can detect micron-sized structures within blood vessels in the brains of mice. The method involves detecting near-infrared fluorescent light from single-walled carbon nanotubes (SWCNTs) that are injected into the mice. The ability to monitor the structure of blood vessels – and the blood flow within them – is extremely important for treating conditions such as strokes, dementia and brain tumours.
Today, brain imaging mainly relies on techniques such as X-ray computed tomography and magnetic resonance angiography. However, these methods cannot image structures several microns in size. In addition, with these approaches it can take several minutes to acquire an image, which means that it is not possible to use them to monitor blood flow in real time.
Fluorescence-based brain imaging in the visible and near-infrared (NIR) regions of the electromagnetic spectrum (400–900 nm) is a good alternative but at the moment it requires skull-thinning or, worse still, craniotomy – where sections of the skull are removed and replaced with a transparent “window” – to work properly. This is because light at these wavelengths can only travel about 1 mm through the skull.
Window of opportunity
Now, a team led by Hongjie Dai and Calvin Kuo at Stanford has developed a new through-scalp and through-skull fluorescence imaging technique that goes a long way in overcoming these problems. The method makes use of the intrinsic fluorescence of SWCNTs in the 1.3–1.4 µm range. “We define this wavelength as the NIR-IIa window, and it represents just about the longest wavelengths for fluorescence imaging reported thus far,” explains Dai.
“Photons at these wavelengths are much less scattered than those in the 400–900 nm window when traversing biological tissues and are not absorbed significantly by water either,” says Dai. “All in all, this allows us to see deeper into the brain through intact scalp skin and bone than is possible with traditional fluorescence imaging, which is mostly done with <800 nm wavelength photons.”
“Compared with all other techniques for in vivo brain imaging (including MRI and CT), our technique affords higher spatial resolution”, he says. “It allows us to image single capillary blood vessels that are just microns across and as deep as 3 mm inside the brain.”
Need for speed
And that is not all: the technique is also fast, at 200 ms per frame or less, which allows blood flow to be monitored in real time. This is particularly important when treating stroke patients because in these cases blood flow in parts of the brain can be drastically reduced, causing serious damage.
Image showing the blood vessels in the brain of a mouse. The image was obtained by detecting fluorescent light emitted by carbon nanotubes. (Courtesy: Calvin Kuo and Hongjie Dai)
The team tested the technique by injecting mice with SWCNTs. The heads of the mice were shaved and illuminated with an infrared laser. The fluorescent light was detected using an array of photodiodes that created a 2D image of the brain. The researchers are now busy trying to image in 3D using their method. “We are also developing imaging agents for an even longer-wavelength window to further minimize photon scattering,” adds Dai. “And, we are looking at making NIR-IIa fluorophores that might potentially be used in human clinical trials.”
Topological light travels easily around the edge of the lattice, yet it gets muddled in the middle. (Courtesy: JQI)
Last year we reported on a fascinating experiment that simulated the quantum Hall effect using light. Mohammad Hafezi and colleagues at the Joint Quantum Institute (JQI) of the University of Maryland created a lattice of ring-shaped silicon waveguides that are placed just nanometres apart (see image above). This allows light in one ring to “tunnel” into a neighbouring ring and make its way across the matrix, hopping from ring to ring.
The first effective technique for growing a batch of single-walled carbon nanotubes (SWCNTs) that all have the same molecular structure has been developed by scientists in Switzerland. The new process involves using “seed molecules” on a platinum substrate to grow SWCNTs with the desired structure. The breakthrough could be extremely important to those developing electronic devices based on SWCNTs because nanotubes with different structures can have very different electronic properties.
An SWCNT can be thought of as an atomically thin sheet of carbon that has been rolled up to form a tube about 1 nm thick, resembling a drinking straw. The carbon sheet always has the same honeycomb structure, which it shares with graphene. However, there are about a hundred different ways that the edges of the sheet can join together to make a tube, and this defines whether an SWCNT conducts electricity like a metal or a semiconductor. In the case of semiconducting nanotubes, the size of the electronic band gap also depends on how the edges are joined.
Electronic devices based on SWCNTs could, in principle, be used to create transistors and other components that are smaller, faster and more energy efficient than those based on silicon. But before that can happen, scientists have to come up with reliable ways of producing batches of SWCNTs with identical structures.
Costly separation
Careful control of how SWCNTs are prepared can limit the number of different structures to as few as five. Then SWCNTs with the desired structure can be separated from a mixture. However, this is a very costly process with a structurally pure sample of SWCNTs costing about $1000 per milligram from a chemical supplier. As a result, scientists are very keen on developing methods for producing batches containing just one structure.
Artist’s impression of single-walled carbon nanotubes growing from seeds on a platinum surface. (Courtesy: Empa/Universität Erlangen/Konstantin Amsharov)
The new technique is based on the fact that, unlike a drinking straw, the tips of SWCNTs are capped by carbon atoms and each species has a cap with a different structure. The team used the established technique of organic chemical synthesis to create cap molecules with the same structure as the cap of the desired structural species of SWCNT. These cap molecules are placed on a platinum surface, which is heated in the presence of a carbon-rich gas such as ethylene. The platinum surface acts as a catalyst, pulling carbon atoms from the gas and passing them to the cap molecules. This steady supply of carbon molecules attaches itself to the bottom of a cap and pushes it up from surface, creating an SWCNT with the desired structure.
Metallic armchairs
The cap molecules were designed to seed SWCNTs with the “(6,6) armchair” structure. This much-studied type of nanotube is of interest to device designers because it conducts electricity like a metal. The SWCNTs were grown to several hundred nanometres in length before they were analysed using scanning tunnelling microscopy (STM) and Raman spectroscopy. This revealed that the SWCNTS were all of the same type and were free of structural defects.
“The clever thing about this is that they predesign the cap and that cap then defines the nanotube type,” explains SWCNT expert James Tour at Rice University in the US, who was not involved in the research. Although the team did not show that the technique can create other types of SWCNTs by using different cap molecules, Tour says that this possibility “seems to be implied and it is likely that that would be the case”.
Making tonnes of nanotubes
An important benefit of the new technique is that 1 kg of seed molecules could, in principle, produce 5 tonnes of SWCNTs, each 10 μm in length. On the downside, a platinum surface measuring about 30 km2 would be needed to grow such a quantity of SWCNTs.
An additional challenge facing anyone wanting to use the technique to produce commercial quantities of SWCNTs is how to deal with the entanglement of neighbouring nanotubes. This occurs before the SWCNTs reach a usable length, and disentangling nanotubes can be a tricky process.
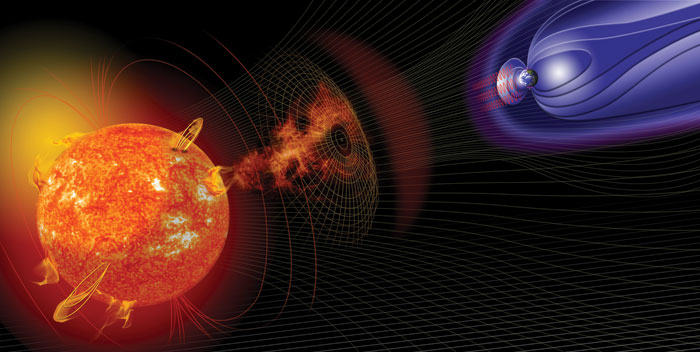
One September day in 1859, over the course of a few minutes, an event occurred that was to have spectacular consequences here on Earth. A sudden flash of brightness, known as a solar flare, had just erupted on the Sun, releasing about 1022 kJ of energy – equivalent to 10 billion Hiroshima bombs exploding at the same time. A massive coronal mass ejection (CME) hurled out about a trillion (1012) kilograms of charged particles at speeds of some 3000 km/s. As the material interacted with the Earth’s magnetosphere – the magnetic shield that usually protects us from high-energy charged particles from space – it triggered the largest ever “solar super-storm” on record.
Known as the Carrington Event – after the English astronomer Richard Carrington who spotted the flare – this super-storm saw the magnetic field around the Earth being stretched and torn apart. Accompanied by numerous sunspots, it led to the northern lights being seen as far south as the equator and created surges of energy that crippled the world’s electronics infrastructure.
Back in the mid-19th century, that infrastructure amounted to no more than about 200,000 km of telegraph lines and so the impact on the human population was relatively benign. But today’s world, which relies hugely on space technology and massively interconnected networks of power lines and fibre-optic cables, would be severely damaged if a Carrington-type event were to repeat itself. The consequences could be catastrophic and long-lasting.
In fact, it has now dawned on us – thanks to data from NASA’s Kepler mission, numerical modelling and the study of historical records – that the mood of our nearest star is far more hostile than we used to think. According to Jim Green, director of NASA’s planetary-science division, the Earth is, on average, in the path of Carrington-level events every 150 years – putting us five years overdue. Moreover, according to estimates made by Pete Riley, a heliophysicist at NASA and the US Department of Defense, the probability of another Carrington Event occurring within the next decade is as high as 12% (Space Weather10 S02012).
In recent decades, we have already seen glimpses of the dangers that could lie in store. In March 1989, for example, a geomagnetic storm that was about a third of the strength of the Carrington Event caused an electricity grid operated by the Canadian firm Hydro-Québec to fail, triggering a nine-hour blackout for about six million people. Meanwhile, the “Halloween storm” of October 2003 – which was about half as intense as Carrington – disabled a number of satellites, destroyed a dozen transformers in South Africa and crippled a large section of its power systems. These events should have been a wake-up call, but little has been done about the potential threats. As the heliophysicist Pete Worden, director of NASA’s Ames Research Center, candidly puts it: “Space weather destroys stuff.” So what can be done?
SolarMAX is on the case
To help find answers, I was last year invited by the UK and European space agencies to take part in a 40-strong international, multidisciplinary task force of experts, led by Worden and Green. Over a period of six weeks, our group – dubbed SolarMAX – gathered at the International Space University in Strasbourg, France, to work out the risks from a solar super-storm to our modern way of life and to identify the best ways of limiting the potential damage. The result was a 100-page document to be disseminated to governments, space agencies and industry. You can read the full report online, although the human impact of a storm might be more apparent in my fictionalized account of the dramatic aftermath of such an event (see “Solar super-storms: a possible tale”, below).
It would be nice to pretend that everything will be fine in the event of a solar super-storm striking the Earth, but our findings were sobering. Severe disturbances to the Earth’s magnetic field would induce electric currents in the ground and overhead transmission lines – in fact, if the cables are long enough, the currents would be large enough to melt high-voltage AC transformers, which are critical components in all power grids. New transformers typically take up to a year to manufacture and install – and utility companies rarely keep backups as these devices cost at least $10m each. Any Carrington-level event would therefore generate widespread power outages that would last months, if not years, across most of the developed world, in particular North America and Europe. The lower latitudes of India and China, coupled to generally less conductive soil and more robust power infrastructures, means they would not be nearly as badly affected.
Without power, people would struggle to fuel their cars at petrol stations, get money from cash dispensers or pay online. Water and sewage systems would be affected too, meaning that health epidemics in urbanized areas would quickly take a grip, with diseases we thought we had left behind centuries ago soon returning. Worse still, most of the developed world works on a “just-in-time” philosophy, meaning that there is never more than two to three days’ worth of supplies available in urban areas at any given moment, be it food, fuel or medicine.
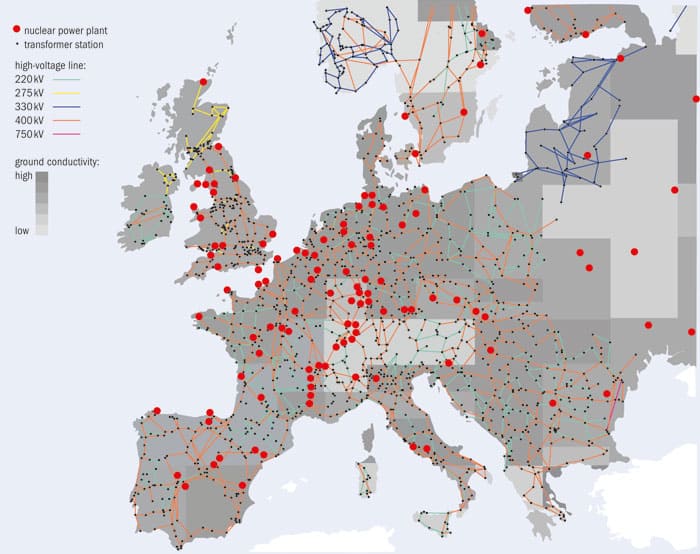
Nuclear power plants are another concern as they rarely have more than a week’s worth of backup power onsite to run their cooling systems. A switched-off reactor usually takes a month to cool down far enough to avoid a meltdown, which means that firms would find themselves fighting to get their hands on supplies of diesel fuel to operate those backup systems. With more than 300 nuclear power plants across North America and Europe, how many catastrophic meltdowns could be avoided? The relative vulnerability of the power grid across Europe to a solar super-storm coupled to the location of nuclear plants can be seen in figure 1, below.
1 Danger points This map shows the location of European nuclear power plants (red dots) and the known main power-grid transmission lines linking them, with higher voltages indicating a more vulnerable line. Also shown are power-grid transformers (black dots) and ground conductivity, which ranges from pale grey (low) to dark grey (high). The power surge a transformer will receive during a solar super-storm depends on the voltage on the transmission lines and on the geomagnetically induced current in the cable, which itself depends on the intensity of the storm, the geomagnetic latitude and the length of the line. (Data supplied by Ashley Dale)
Major disturbances to the ionosphere, caused by increased X-ray emissions from the Sun, would cause aircraft on the Earth’s dayside to lose their on-board navigation management systems and communications with the ground. Without air-traffic control, pilots would struggle to land their planes safely, while passengers, pilots and crew would receive much higher doses of cosmic radiation, which the Earth’s magnetic field and atmosphere together normally shields us from. Pilots, who are classified as radiation workers, typically fly above about 97% of our atmosphere – exposing them to an order of magnitude more radiation than people on the ground – but the increase in radiation dosage at such altitudes during a Carrington-like event would significantly threaten pilots’ and passengers’ health.
Satellites would be affected too, with the electrostatic discharges generated by geomagnetic storms frying electronics, damaging solar panels and confusing star-tracking orientation systems. The Earth’s atmosphere would also heat up and expand during such an event, increasing the drag on satellites in low Earth orbit and causing them to burn up on re-entry. Many TV broadcasts would cease, radios and mobile phones would not function, weather forecasts would end and defence systems would be made redundant.
Spacecraft that run satellite-navigation systems would either be lost entirely or produce data of limited use – hitting agriculture, surveying, oil drilling and timing. Our transportation-management infrastructure would grind to a halt, from air to sea. With more than 1000 operational satellites in orbit (costing an average of nearly $100m each), our space infrastructure could take a decade or more to recover. In fact, a study carried out in 2008 by the US National Research Council estimated that the satellite blackouts caused by space weather could cost upwards of $2 trillion in the first year alone. Meanwhile a separate 2013 study by insurance broker Lloyd’s of London and Atmospheric and Environmental Research, a climate and weather risk-management agency, estimated that the total collateral damage of a Carrington-level event on the world economy would amount to some $2.6 trillion.
Super-sized solutions
You might think I am scare-mongering, but the plain fact is that our reliance on electricity has made us extremely vulnerable to anything that could cut supplies. So to get a clearer idea of how often Carrington-level events are likely to occur, researchers at NASA are currently mining data from the Kepler space observatory. The mission was designed primarily to discover Earth-like planets orbiting other stars and has so far gathered data on more than 170,000 “main-sequence” stars in our galaxy. But by observing the variation in the luminosity of these stars over time, astronomers can spot and quantify the scale and likelihood of stellar super-storms.
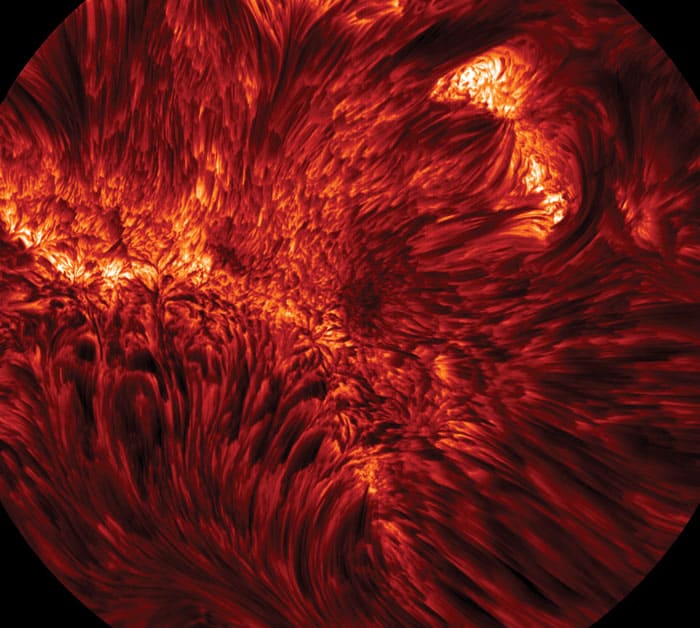
Red hot A close-up of the solar surface as seen by the Big Bear Solar Observatory using the Visible Image Spectrometer H-alpha filter (red light produced by energetic hydrogen atoms). (Courtesy: Big Bear Solar Observatory)
Although only about 4% of the Kepler data has been scoured for super-storms, the work has shown that the Carrington event of 1859 really was nothing special. Preliminary estimates reveal that super-flares with an energy of 1024 kJ occur on the surface of stars just like our own once every 350 years, while those with energies of 1025 kJ take place every 800 years, and 1026 kJ flares every 3500 years. In contrast, an asteroid colliding with the Earth and creating as much collateral damage probably takes place only once every few thousand years. Policy-makers and politicians need to realize that super-flares are not just a threat, but inevitable.
Studying the Kepler data also gives us insights into how the properties of a star affect its volatility. For example, its rotation rate does not seem to alter the scale of super-flares produced, but the higher the rate, the more likely a super-flare event is to occur. The good news – if you can call it that – is that our star has a relatively low rotation rate. But we also need to get a better understanding of the Sun’s magnetic field and its weather because its field lines are intricately connected to those of each major body in the solar system. These lines in particular act as “channels” for solar wind to propagate along, triggering the formation of Van Allen belts – layers of plasma extending out to about 60,000 km beyond the Earth – and also “ring currents” carried by ions trapped in the magnetosphere. Both phenomena influence how solar weather generates solar super-storms so knowing more about them is vital (see “The nature of the Sun”, below).
The bottom line is that a deeper understanding of the Sun’s magnetic field and how it interacts with the Earth’s would help us obtain more accurate and longer-term forecasts of solar weather, as would a deeper knowledge of other solar mysteries, such as the origin of the Sun’s 11-year solar cycle, how sunspots form and why the surface of the Sun is so much cooler than the corona above. In fact, a sub-group of scientists in the SolarMAX project concluded that the best solution would be to send an array of 16 lunchbox-sized cube satellites into orbit around the Sun, located at about 45 million km from the Sun at their closest point and about 150 million km at their furthest. Such a mission would give us enough empirical data on the nature of the magnetic field between the Sun and the Earth with a high enough spatial resolution to help develop our understanding and therefore more accurate models for forecasting. The mission would also let us observe the Sun’s entire surface in almost real time, giving scientists the full picture of the surface when forecasting weather. And by splitting the satellite constellation into two elliptical orbits, tilted relatively, it would be possible to get a full 360° view in 3D of the surface features and solar phenomena. Right now we only ever look at the Sun from one side.
Current satellites give us no more than 15–30 minutes’ advance notice of imminent solar events and all have gone beyond their expected mission lives. Our proposed mission would let us make accurate forecasts – for up to a week into the future – of when, where and with what magnitude solar events will take place. Such forecasts would let us save the power grid by pre-emptively switching off vulnerable lines before a solar storm occurs. Planes could be grounded in time, satellites could be reoriented to limit damage, and national recovery programmes could be swung into action. Such warnings could also reduce the chance and expense of false alarms. What is more, we estimate that such a fleet of satellites would cost no more than $500m at today’s price – just 3% of NASA’s annual budget.
Smart ways forward
Another possible way of minimizing the potential disruption from space weather is to exploit the fact that many nations – at least in the developed world – are slowly updating their power transmission lines so that energy use can be measured at different points in the grid in real time via “smart meters”. This technology lets energy companies monitor and adjust performance to deliver power more efficiently in response to local changes in demand, but such information would be invaluable during major solar events. A real-time solar-weather response system would help to reduce the damage to the power grid by isolating vulnerable segments of the network from the rest of it to allow for smaller local failures rather than large inter-connected failures. The US is leading the way on this front – albeit in a small way – with a bill unanimously approved in 2010 to allocate $100m to developing protection for the bulk-power system and electric infrastructure from cybersecurity and solar-weather threats.
An accurate space-weather forecasting system would also help maximize the life expectancy of satellites by giving us time to manoeuvre them to minimize damage to solar panels. But future satellites need to be designed so that instruments vulnerable to sudden increases in radiation are better protected. The SolarMAX consortium examined some quite far-out ways of doing this, although it bugged me that there had to be simpler solutions to the problem. In fact, I quickly realized that engineers designing satellites and spacecraft had not thought much about simply optimizing the internal layouts of a craft so that sensitive, on-board instruments are shielded as well as possible from radiation.
It occurred to me that such equipment (and astronauts too for that matter) could be better protected simply by redistributing the existing internal architecture of a craft so that sensitive payloads are surrounded by non-sensitive bulk material such as polyethylene, aluminium and water. It would be a kind of “free lunch” because we would not need to make the craft heavier and so avoid making the mission more expensive; we would just need to rearrange what needs to be on board anyway. Not only would the craft be more likely to survive a major solar event, but it would also function for longer because prolonged exposure to radiation is essentially what kills off spacecraft in the long term.
After outlining my thinking to the group, I was allowed to pick a team of seven people – including Chunhui Wang, an “astronaut ergonomist” at the Astronaut Center of China – who together spent a few weeks exploring the potential advantages of my approach. We developed a case study based around a potential Mars mission that is currently being developed by the US-based Inspiration Mars Foundation, which wants to send a two-person manned probe on a Mars fly-by mission, reaching within 150 km of the red planet some time in the next decade. We worked with the foundation on its latest plans for the craft’s internal architecture and – by characterizing the radiation profile associated with its particular trajectory – were able to estimate the dose that astronauts flying to Mars might expect to receive. By redistributing the existing internal architecture of the spacecraft, we were able to cut the expected radiation dosage of the two-person crew by 15–20%. Though the radiation problem associated with space activities currently has no single solution, I saw this as a big win.
My proposal is just one of many practical – and feasible – solutions to the potential dangers of space weather. The risks are real. Solar super-storms are inevitable. Whether one affects civilization here on Earth is not a question of “if”, but “when”. However, damage can be averted with the technology we have today. The primary obstacle and danger lies not within the Sun, but with the ignorance of decision-makers concerning space weather: governments, industry and the public. As a species, we have never been more vulnerable to the volatile mood of our nearest star, but it is well within our ability, skill and expertise as humans to protect ourselves.
The nature of the Sun
(Courtesy: NASA)
What is the Sun made of?
All matter in the Sun is plasma: hot, ionized gas. Consisting mostly of protons, electrons and helium ions along with some oxygen and iron, this plasma moves across the surface like a deep and frothy ocean, circling the equator once every 25 days (at about 2 km/s) and once every 35 days near the poles. This rotation acts like a dynamo, producing the magnetic fields of the Sun. Over time, these field lines form vast channels, or “flux tubes”, on which the ionized gas is lifted up out of that fiery ocean in massive waves, leaving the Sun in a stream known as the solar wind.
What are sunspots?
The turbulence in the Sun’s superheated ocean, which is instigated by the differences in lateral rotation speed, makes the flux tubes gradually twist, break and reconnect with other lines beside them. These twisted and entangled magnetic field lines eventually inhibit the convection and effectively cut off the plasma flow in those channels, leading to a small but powerful local magnetic pole. Isolated from the circulatory system of the Sun, this pole gradually cools and forms a sunspot that can last for several days or weeks.
What about solar flares?
Magnetic field lines in the Sun’s corona – the aura of plasma encircling the Sun – contain lots of energy, which means that when the lines reconnect, lots of energy is released to create a huge explosion that we call a solar flare. Consisting of gamma rays, X-rays, protons and electrons, these flares are typically equivalent to 100 million Hiroshima bombs in terms of released energy.
How are coronal mass ejections created?
Occasionally, huge bubbles of plasma and magnetic field lines are ejected from the Sun over several hours in an event that is more energetic than any other in our solar system. Known as a coronal mass ejection (CME), such an event typically occurs after a solar flare, which means they are most common during a solar maximum (when the Sun is most active during its 11-year cycle). However the Carrington Event (see main text) occurred during a solar minimum, while not all solar flares cause CMEs and not all CMEs accompany solar flares.
How do CMEs affect us?
The Earth lies in the path of about 10% of all CMEs, with us typically getting hit eight minutes after a solar flare and anywhere between eight hours and three days after a CME, depending on their magnitude and trajectory. Like the Sun, the Earth also has a magnetic field originating from its molten core and how the two fields interact with the trajectory of a CME through the vacuum of space makes its path not at all simple.
What about Van Allen belts?
These are vast shells of plasma surrounding the Earth held in place by our own magnetic field. Disruptions to the Earth’s magnetic field through solar events affect the location of these shells, which can go some way to damaging the spacecraft they envelop. This plasma is delivered from the Sun via solar wind and any plasma lost from the Van Allen belts through disruption is quickly replenished.
And the ring current?
This is a doughnut-shaped region of mainly hydrogen, helium and oxygen ions surrounding the Earth’s equatorial plane. It shields the planet’s lower latitudes from electric fields induced in the magnetosphere. The waxing and waning of the ring current is a crucial element of our space weather as the process occasionally transfers charge from the surface of the Earth to satellites, potentially damaging them. Astronomers are not sure if these charged particles come from solar wind or our ionosphere – but better models of how particles are transported and accelerated between the Sun and the Earth would improve our understanding of the ring current.
Solar super-storms: a possible tale
(Courtesy: iStock/Destonian)
Day 1 Andrew has just returned from work and is settling down for the evening in his London flat. Susan should be home late, flying back from a business trip to Quebec. Suddenly the TV and lights go off. Eggs sizzling in the frying pan gently fall silent. A power cut. Andrew fumbles for his phone and uses the torch app. He opens the curtains to find the street lights are out too; it’s dark as far as he can see. His neighbours are out on the street chuckling to each other, lit only by their phones. He goes to make a Facebook status update – no 4G. No signal? An early night then, after some eggs that are luckily just about cooked.
Day 2 Andrew wakes up at 5 a.m. to a siren wailing outside. He stumbles around for a glass of water. The taps aren’t working. There is only some barely cool white wine in the fridge. Susan still isn’t home. Opening his curtains again, he sees what looks like rush hour traffic despite the early hour. He spots at least a dozen helicopters over the city. This must be serious. Looks like a day off work! Andrew dresses and steps outside to buy food and drink from the local shop. The ATM machines are not working. He hardly has any cash. The shops are empty. The shopkeeper says something about space weather causing this. Space weather?
Day 3 Susan still isn’t home. Andrew hasn’t been able to find out if her flight landed. They have no way of contacting each other. The battery on his mobile phone has died, anyway. There are looters in the streets. He has limited food and his only water is in the toilet cistern. He leaves a note for Susan and drives out to his parents in the countryside. But the GPS is not working and he’s not sure of the way. It’s a two-hour drive in normal traffic and he only has half a tank of fuel. He knows the fuel pumps are not working. There may be road-blocks.
A week later Andrew reaches his parents on foot after his car was hijacked. They have a large water tank and a good supply of food, but looters abound. A solar super-storm has crippled the power and space infrastructure. Most of Europe and North America is floundering. Several nuclear power plants have suffered catastrophic meltdowns around the country. Diseases are spreading in the cities. China and India have not been too badly affected and are sending in troops and aid to help recovery.
A month later Things seem to be on the road to recovery. The water is running again but power is temperamental. Susan’s flight was diverted to Lyon, France, where she has been stranded since. The Chinese have been distributing food, water, medical and sanitation supplies. The government has begun to regain some level of order.
A year later Susan and Andrew have been back at work for a few months, though things have been slow to restart and the future of their jobs is now uncertain. Their insurance firm refuses to pay up for the damage looters did to their flat. Oil and gas prices have spiralled out of control, and there are going to be severe food shortages for some time. It will take years before certain conveniences return to normal. The geopolitical map has drastically changed. Many of their friends are looking to leave the UK and start new lives in the East.
The European Space Agency’s Rosetta mission made history today, as it became the first spacecraft to rendezvous with a comet. After spending a decade in pursuit of the celestial body, Rosetta is now a mere 100 km from the comet’s surface, and will edge closer to it over the coming months as it studies the comet. The ultimate aim of the mission is to place its “Philae” landing module onto the comet’s surface in November.
Rosetta’s target, Comet 67P/Churyumov–Gerasimenko, is currently about 405 million km from Earth (about halfway between the orbits of Jupiter and Mars) and is hurtling towards the inner solar system at nearly 55,000 km/h. The comet’s 6.5-year elliptical orbit around the Sun takes it from beyond Jupiter to between the orbits of Mars and Earth. The spacecraft will accompany it for more than a year of its journey, as the duo swing around the Sun and back out towards Jupiter.
‘We are here’
“After 10 years, five months and four days travelling towards our destination, looping around the Sun five times and clocking up 6.4 billion kilometres, we are delighted to announce finally ‘we are here’,” says Jean-Jacques Dordain, director-general of ESA.
Rosetta’s journey to the comet saw it make three gravity-assisted flybys of Earth and one of Mars, to keep it on course since its 2004 launch. On its way, the spacecraft also passed by two asteroids – Šteins and Lutetia – and managed to gain excellent views and detailed measurements of the objects, revealing previously unknown information such as their core structures. Rosetta spent nearly 31 months in hibernation since it entered deep space in 2011, before the researchers sent a signal waking it up in January this year. The last of a series of 10 essential “rendezvous manoeuvres”, which began in May, to adjust Rosetta’s speed and trajectory to gradually match those of the comet were carried out today.
Rubber-ducky personality
According to the mission scientists, Comet 67P had already begun to “reveal its personality” while Rosetta was on its approach this year. Images taken by its OSIRIS camera between late April and early June showed that its activity was variable, with the comet’s gas and dust “coma” brightening up and dying down over six weeks. Other measurements made by the spacecraft showed that the comet was emitting water vapour into space at about 300 millilitres per second, and that its average temperature is about –70 °, indicating that the surface is predominantly dark and dusty rather than clean and icy. Last month, images taken from a distance of about 12,000 km began to reveal that the comet’s nucleus comprises two distinct segments joined by a “neck”, giving it a “rubber-ducky”-like appearance.
Comets are the primitive remainders of the clouds of dust and gas that served as the building blocks of our star system. In many ways, they are thought to have remained much the same during billions of years and should contain pure material from the early days of the solar system. There is also the possibility that comets could have brought with them the carbon-based organic molecules needed to start life on our planet and so comets are of great interest to researchers.
Celestial paparazzi: stunning close-up detail focusing on a smooth region on the “base” of the “body” section of comet 67P/Churyumov-Gerasimenko. The image was taken by Rosetta’s OSIRIS narrow-angle camera and downloaded today, 6 August 2014. The image clearly shows a range of features, including boulders, craters and steep cliffs. The image was taken from a distance of 130 km and the image resolution is 2.4 metres per pixel. (Courtesy: ESA/Rosetta/MPS for OSIRIS Team MPS/UPD/LAM/IAA/SSO/INTA/UPM/DASP/IDA)
Over the coming six weeks, Rosetta will describe two triangular-shaped trajectories in front of the comet, first at a distance of 100 km and then at 50 km, before eventually edging as near as 30 km to attempt a close, near-circular orbit. While doing so, the suite of instruments on board will conduct a detailed scientific study of the comet, scrutinizing the surface for a target site for its Philae lander.
Possible landing sites
The mission hopes to identify as many as five possible landing sites by late August, before the primary site is chosen in mid-September. The final timeline for the sequence of events for deploying Philae – currently expected for 11 November – will be confirmed by the middle of October.
“Over the next few months, in addition to characterizing the comet nucleus and setting the bar for the rest of the mission, we will begin final preparations for another space-history first: landing on a comet,” says Matt Taylor, ESA’s Rosetta project scientist. “After landing, Rosetta will continue to accompany the comet until its closest approach to the Sun in August 2015 and beyond, watching its behaviour from close quarters to give us a unique insight and real-time experience of how a comet works as it hurtles around the Sun.”
The National Institute of Standards and Technology (NIST) lacks independence and uncritically adhered to the wishes of US electronic eavesdroppers in releasing a weakened random-number generator in 2006. So says a group of mathematicians and computer scientists in a new report commissioned by the lab following the leaking of documents last year by the former National Security Agency (NSA) contractor Edward Snowden. According to those documents, the NSA designed an encryption algorithm to include a “back door” so that it could copy encryption keys from internet users without their knowledge. The algorithm was approved by NIST, which itself develops cryptography technology and advises US companies and government agencies on electronic security issues.
Random-number generators are at the heart of encryption on the Internet. In particular, they provide the 1s and 0s that make up many of the keys that are used to encipher and decipher communications – in e-mail exchange, banking and medicine, for example. While sequences of truly random numbers are notoriously difficult to generate, online randomization relies more on data-based “pseudo-random” processes. These usually involve taking a more-or-less random “seed” – such as the data associated with timings of key strokes or hard-drive access – and then stretching that seed into a sequence using a specially designed algorithm.
The NSA algorithm – Dual Elliptic Curve Deterministic Random Bit Generation (Dual_EC_DRBG) – relies on the fact that elliptic curves can be used to construct “one-way functions”. This means that while it is straightforward to multiply a pair of x, y co-ordinates on such a curve to generate a second set of co-ordinates, it is very hard to reverse the operation to arrive back at the original values of x and y. DUAL_EC uses elliptic curves with two publicly declared co-ordinates – P and Q. The algorithm multiplies Q by a factor that is initially dependent on a pseudo-random seed and then removes some of the bits from the resulting x co-ordinate. The programme then re-sets the factor by multiplying it by P, and the new factor is subsequently multiplied by Q to produce the next output sequence. Repeating this cycle many times, Dual_EC should produce a long string of pseudo-random bits.
Trivial for an attacker
However, there is a snag. It turns out that all future (and past) outputs can be predicted if an attacker is able to work out just one set of output co-ordinates from the truncated x value associated with them – a relatively trivial task given the fact that Dual_EC, unlike other similar algorithms, cuts off very few of the 1s and 0s describing the x co-ordinate (just two out of 32 bytes) – and, crucially, if that attacker knows the mathematical relationship between P and Q.
If P and Q were themselves selected purely at random then this kind of attack, cryptographers say, would be practically impossible. In contrast, however, the algorithm is vulnerable if the person setting it up chooses the values non-randomly – in other words, they set up a back door. Many cryptographers believe that the NSA probably knows the relationship between P and Q, and therefore has a back door allowing them to decipher encoded communications.
Being more open
When the story about DUAL_EC and its alleged back door broke last September, NIST responded to the “community concern” by putting the standard containing the algorithm – SP 800-90 (which contains three other random-number generators not under suspicion) open for “public comment”. NIST then announced in April that it had decided to remove the offending program from the standard. In the meantime, NIST also asked its Visiting Committee on Advanced Technology to investigate how the organization could improve its standards work in the future. The committee then entrusted that task to a specially appointed panel of seven experts.
The panel commended NIST for being “forthcoming, open and transparent” in responding to its enquiries, but concluded that these were qualities sometimes lacking when it is developing cryptographic standards. In individually submitted assessments of what had gone wrong, many of the panel members also said that NIST had made a mistake in approving the algorithm in the first place, arguing that it had done so because it had been overly trusting of the NSA.
NIST failed to exercise independent judgment but instead deferred extensively to the NSA
Edward Felten, Princeton University
Panellist Edward Felten, a computer scientist at Princeton University, argues that NIST should not have allowed the NSA to provide the values of P and Q, or, as a minimum, should have asked the agency to provide evidence of the variables’ randomness. “NIST failed to exercise independent judgment but instead deferred extensively to the NSA,” he wrote.
Fellow panellist Bart Preneel of KU Leuven University in Belgium believes that NIST has “lost its credibility” and estimates that it will need “several years” to regain the trust of providers and users of Internet services. “It is clear that this could only happen because in some sense NIST was misled by the NSA,” he says
Asking the wrong question
Chief cyber-security adviser at NIST, Donna Dodson, says that NIST “did not know that there was a back door” in DUAL_EC before September 2013, and that even today it “still doesn’t know” whether the deliberate weakness exists. She adds that “in hindsight” the organization probably would not have issued the algorithm, admitting that although it offered companies the possibility of generating their own values of P and Q, NIST “didn’t make it easy” for people to do this. “We focused on the question ‘did the algorithm have a back door?’, rather than the question we should have asked: ‘could the algorithm have had a backdoor?'”
However, mathematician Richard George, who worked for the NSA as a cryptographer for 41 years before retiring in 2011, says “The NSA has never attempted to put a backdoor in a NIST algorithm.” Indeed, he insists that the values of P and Q were randomly generated. “There is a relationship between those two values but we don’t know what it is,” he says. “We provide crypto-variables for the US government, and the same system that was used to generate those random values I was told was used to generate these.”
Ultrathin coatings that arbitrarily manipulate the phase and polarization of electromagnetic waves have been created by researchers in the US. The coatings are made from silicon nanorods using a technique that is compatible with industrial processes such as photolithography. The researchers say that the coatings could be used in new types of optical components that are much less bulky than traditional lenses. The technique could even be used to bend light in ways not possible with conventional lenses.
Fermat’s principle – the rule that light travels along the path of least time – says that electromagnetic waves travel along the path on which they accumulate the least phase. In a medium of higher refractive index, the wavelength shortens and so a wave accumulates more phase across the same distance. A wave therefore bends towards the normal to reduce the distance travelled in the medium and the phase accumulated.
Manipulative metasurface
In a conventional optical component such as a lens, phase accumulates continuously as the wave propagates and this determines the nature of the wave that emerges from the lens. However, if the phase of a wave could be changed discontinuously at a surface (called a metasurface), then the wave could, in principle, be manipulated in ways not possible with conventional optics.
While this is straightforward in theory, the challenge facing physicists is how to create such a phase discontinuity using real materials. In 2011 researchers at Harvard University led by Federico Capasso and Zeno Gaburro covered a surface with V-shaped gold antennas so that the surface could be used to introduce any desired phase shift to optical waves passing through it. While this allows the arbitrary redirection of visible light, there are two major problems with this approach. First, the metallic nature of the surface means that most of the visible light is lost as it travels through the surface. Second, thin layers of metal are very difficult to work with and incompatible with the complementary metal-oxide semiconductor (CMOS) process used to make modern electronic devices.
In the new research, Mark Brongersma and colleagues at Stanford University in California use lossless silicon optical antennas. When illuminated by a particular frequency of light (which can be selected by varying its diameter), the antenna will resonate strongly. This causes the light wave to pick up a phase shift that depends on the relative orientations of its polarization axes to the antenna. By appropriately tailoring the orientations and distances between the antennas, the surface can impart any desired phase shift to the light. This allowed the researchers to reproduce the functions of a bulk lens with a single layer of nanorods just 100 nm thick.
Axicons and Bessel beams
The team was able to create various types of “lenses” using this technique. These include traditional focusing lenses and an axicon. The latter is a specialized type of conical lens that transforms an ordinary laser beam into a Bessel beam – a ring-shaped beam used in optical tweezers and eye surgery.
Optics expert John Pendry of Imperial College London is impressed. “If anyone in the electronics or photonics game wanted to use a material, it would have to be silicon,” he explains. “You can lay down silicon extremely flat and shape it very precisely. Metals are nowhere near silicon in terms of the precision and the control you can exert over them; so, if you can translate a technology like metasurfaces into a silicon environment, you’re on to a real winner because you can hook on to this bandwagon that’s been rolling for half a century now.”
I think that Intel or other companies based on CMOS technology can implement such a metasurface now
Erez Hasman, Technion-Israel
In the experiment, the metasurfaces were fabricated by electron-beam lithography, but team member Erez Hasman, now at the Technion-Israel Institute of Technology in Haifa, says that commercial companies could produce large quantities using industrial processes such as photolithography. “I think that Intel or other companies based on CMOS technology can implement such a metasurface now,” he says.
“The theoretical concept is not surprising at this point, but the fact that they built it and it works is interesting,” agrees Andrea Alù, an expert on metasurfaces at the University of Texas at Austin. He looks forward to the development of optical components that are not possible with normal lenses. Hasman suggests that one of the first such uses might be to interface waveguides with free space. “In general, the modes of a laser resonator or a waveguide are very complex and different from the modes of free space,” he says. Coupling the two together to allow signals to pass between them, he explains, is very difficult using a lens or a prism but should be no problem using the 2D metasurface.
Shades of pink: the Xamaleón ice cream in action. (Courtesy: IceXperience)
It has been a cracker of a summer here in south-west England, with lots of sunshine and temperatures in the mid-twenties just about every day. Not surprisingly, I have been eating my fair share of ice cream, but unlike this concoction whipped up by a physicist-turned-chef in Spain, the stuff you get in Bristol does not change colour when you lick it!