
The power of YouTube

“No, put the pen down. No equations.” “But. But. But…” Asking a physicist to forgo mathematics when explaining a particularly challenging concept is always going to lead to some consternation – as is obvious from my response above to film-maker Brady Haran’s request. And this wasn’t the first time that we’d argued this point. Haran put down his camera and made his point. Again.

“Start writing equations and you might as well speak in a completely different language – you’re going to lose most of the viewers.”

Sighing, I countered that explaining physics without including at least a sprinkling of maths was selling the viewer short. “Brady, it’s like the difference between listening to a guitarist playing alone compared to the music they create as a member of a band,” I argued. The interplay of the instruments completely changes the perception and impact of the song, I reasoned, adding that maths similarly adds that extra dimension to the physics. (I’m rather keen on the links between music and physics and maths – see “Where heavy metal meets maths and physics”, below.)

But Haran was having none of it. “No, it’s like explaining Shakespeare to a non-English speaker,” he replied. “Sure, they miss out on the true beauty and cleverness, but at least you can tell them the story and why it’s so important. Stubbornly reading them Hamlet in English will achieve nothing.”

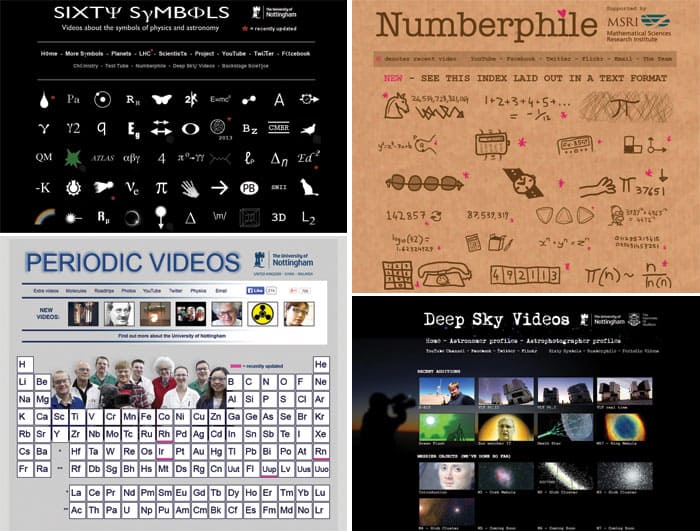
This type of exchange is par for the course when making videos with Haran – the exceptionally talented and remarkably prolific film-maker and journalist behind a slew of very successful science-related YouTube channels. His films include the physics-focused Sixty Symbols series, Periodic Videos (covering all 118 known elements), Numberphile and Computerphile (about mathematics and computing, obviously) and the forerunner of them all – TestTube (“videos behind the scenes in the world of science”).

Where heavy metal meets maths (and physics)

Drawings depicting various physicists' names as heavy-metal logos

If there is one thing I have learned from the last 15 years of teaching undergraduates, supervising PhD students and co-ordinating physics postdocs, it’s that a Venn diagram of physicists and fans of heavy-metal music (and its plethora of sub-genres) has quite a large overlap. I’m certainly not the first to have noticed the link – just visit the excellent Monsters of Grok website to see the huge range of T-shirt designs that rather niftily combine the names of famous physicists and the logos of popular rock and metal bands. I particularly like the Gauss/Kiss design, the Newton/Iron Maiden hybrid and the Sagan/Slayer cross-over (see above).

Given this connection, I regularly try to brow-beat Brady Haran into doing videos that incorporate some aspect of metal into our descriptions of maths and physics. For example, we have made a music video on the Numberphile channel with the multi-talented Dave Brown, which involved writing and recording a “math metal” song whose riffs, rhythms, lyrics and “sound effects” have been derived from the digits of the golden ratio, φ. Meanwhile, Sixty Symbols has videos on the physics of mosh pits, and the relationship between the wah-wah pedal used in rock guitar and Fourier analysis.

Another idea that we are developing (and which the UK’s Engineering and Physical Sciences Research Council has agreed to fund) is a song and video based on the Schrödinger equation: what better aide-mémoire for students studying quantum physics than to have it as part of the lyrics to a metal song? In fact, the response to the metal-physics theme has been extremely encouraging: our videos have so far attracted almost half a million views and the comments on them have been overwhelmingly positive. Their aim is not just to preach to the converted, but to encourage an interest in maths or physics among those who may not have thought about the subject before. We’ve certainly made at least one convert who posted this comment under the golden-ratio video: “I think you just tricked me into liking math. Clever bastards.

Haran’s motivation for making videos has always been to connect viewers with scientists much more naturally than is the norm with traditional media – to provide a “window” into a scientist’s world. His videos are raw, honest and direct, lacking the “corporate sheen” that so many science films veer towards. It is an approach that has proved incredibly popular: at the time of writing, the subscriber base for all of Haran’s channels is over two million, and his videos have been viewed a total of 155 million times – and rising fast. Haran has the uncanny ability to know exactly what will work, and what won’t, in the videos he makes. (And he almost always wins in spats like the above.)

Daunting and rewarding

Having worked with Haran since 2009 and featured in some 45 of his videos, the experience has transformed my ideas on public engagement and outreach. A big challenge when communicating physics concepts and ideas via YouTube is the diversity of the audience, which ranges from academics, subject experts and teachers to students, school pupils and those with no background in science at all but an intense interest in it. And from comments left beneath the videos – as well as via social media, e-mails and face-to-face conversations – we know that viewers range in age from five to at least 75.

This wide spread in backgrounds and ages, which is very different from that in a typical university lecture theatre, means that making YouTube videos is extremely rewarding but also rather daunting. Just how should we pitch our explanations? To make matters worse, the first time my colleagues or I get to see the final video is generally only once it has been uploaded to YouTube. Our lack of involvement in the editing process makes some sense – it lets Haran get his films out quickly and give them a tighter focus than if we were constantly sticking our noses in. But because the subscriber base for each of Haran’s channels runs into the hundreds of thousands, once we watch the video it can easily have already picked up thousands of views and hundreds of comments. Any verbal slip-ups, perceived or actual, can be rapidly subjected to intense scrutiny by the YouTube audience. And they take no prisoners.

But as Haran and my colleagues at the University of Nottingham describe (see “YouTube science – from those who’ve taken part”, below), the benefits of communicating physics via YouTube generally far outweigh the occasional discomfort of a small number of negative viewer comments. They also compensate for the irritations of the “trolls” who populate any online forum, and the many e-mails we receive written in various weird and wacky fonts – almost always with a liberal smattering of BLOCK CAPITALS – which claim that the correspondent has discovered a new and astounding grand theory of everything and that [insert world-renowned physicist of choice] had got it all wrong.

Nagging reservations

Yet in spite of the benefits it brings, I do have some nagging reservations about online education, both via YouTube channels and through massive open online courses (or MOOCs). I think we need to temper our enthusiasm for online education with some healthy scepticism about the extent to which actual learning is taking place. Enthusing and engaging viewers is exceptionally important (and fun), but learning is a complex and messy business that needs at least as much effort from the student as from the teacher. Indeed, Frank Noschese – a physics teacher at John Jay High School in New York – has gone as far as describing education via video (including the work of the extremely popular Khan Academy channel) as “pseudoteaching” because students do not actively engage with the material.

This is obviously a deeply contentious issue, particularly among the growing YouTube education community (and I’ll return to it later). But what’s interesting is that when I asked Haran about his approach to video-making, he said he did not label his online videos as education, entertainment or even as “edutainment”. According to Haran, his main mission is simply to “find out interesting stuff and tell other people about it”. In other words, Haran sees his videos as essentially a form of journalism, which is not surprising given that he worked as a journalist both for the BBC and the Adelaide Advertiser in his native Australia before moving to Nottingham in 2002.

This journalistic bent gives rise to a none-too-subtle tension when making YouTube videos in the Haran style. As academics, our approach to explaining a concept is arguably the polar opposite of what journalists like to do: we prefer to painstakingly lay the groundwork, carefully building up an explanation in as precise a fashion as possible, with a sometimes rather too intense focus on the minutiae of the science. Journalists instead want to get to the headline as quickly as possible – to grab the audience from the start and compel them to read, watch or listen to their story via a strong “hook”. It took me some time to get used to this approach, and it can still be uncomfortable to let go of the detail, particularly when you know that at least some of the Sixty Symbols audience will call you out for it in the comments section under the video.

Indeed, the ability of viewers to give instant feedback to YouTube videos is both a blessing and a curse. You’re glad that people have responded to your videos and want to read what they have to say, but you have to be braced for the worst. The universal advice regarding YouTube videos, which is to ignore the comments entirely, can be pretty well impossible to follow. I too usually disregard the wise counsel of PhD students and postdocs in my research group, many of whom think YouTube comments are nothing more than the condensed collective stupidity of humanity.

Haran’s channels tend to buck this trend: the comments can often prompt a well-informed and, at times, quite erudite discussion. Still, you do have to learn to put up with some unpleasant stuff. My astronomy colleague Meghan Gray, who has featured in many of Haran’s videos, points out that there is an infuriating gender bias that often taints the comment threads, with the comments she gets often being far more focused on her appearance than those received by male colleagues. “Whether the intention is to flatter or be nasty, it can be uncomfortable and unpleasant, and the scientific message becomes secondary,” she says. “Fortunately, other viewers will tend to quickly censure those who express views of this type, which is heartening – we do have some lovely fans.”

Getting the balance right

Although Haran is not a scientist by training, and has no formal education in physics, chemistry or mathematics beyond secondary school level, he has an abiding interest in – and passion for – science and mathematics. This plays a pivotal role when it comes to engaging the audience. “Perhaps my most important role is to represent the viewers,” he says. “I try to think about what they’d ask if they were in the room. Not necessarily what the scientists want to say, but what do the viewers want to know? Nothing makes me happier than when a viewer writes to say ‘Thank you Brady – that was just the question I was hoping you would ask next!’?”

Screenshots of various YouTube science-video series: Sixty Symbols, Numberphile, Periodic Videos and Deep Sky Videos

For us academics on the other side of the camera, however, this aspect of film-making can be daunting: whatever “narrative” we may have developed for a particular topic can be shot down in flames by a single unanticipated and perceptive question from Haran within seconds of the record button being pressed. “We don’t know what Brady is going to ask, and he asks some really good, pertinent and challenging questions that can leave you a bit flummoxed,” says my Nottingham colleague Ed Copeland, a cosmologist whose appearances in Sixty Symbols and Numberphile have rightfully won him a dedicated following on Facebook and Twitter.

Copeland admits getting the balance right is “very challenging” – to make explanations neither too verbose and technical nor too short and shallow. “Brady plays a crucial role there, pulling me back from getting too technical but giving me enough leash to discuss some technical aspects,” he says. Even Roger Bowley, an emeritus professor in physics and astronomy at Nottingham who’s been a member of the Sixty Symbols team right from the start, admits that “simplifying complex ideas into a single, logical story-line that can be understood by the general public” is the most challenging aspect of the process.

Powerful impact

The key to a successful YouTube video, according to Mike Merrifield, an astronomer at Nottingham, is to put yourself in the position of the viewer and avoid confusing or jargon-filled explanations. “You need to simplify things to a point where they are understandable in this format without compromising the underlying science”, he says. Yet keeping things simple without fundamentally compromising the description of the science is an exceptionally difficult balancing act. Indeed, last year I decided I wasn’t getting this balance right and grew ever more concerned about the perception we were creating by trying to put across physics in easy-to-digest, video clips lasting just a few minutes. Physics is not easy and we shouldn’t pretend it is – it needs hard work but the rewards are great if you put the effort in.

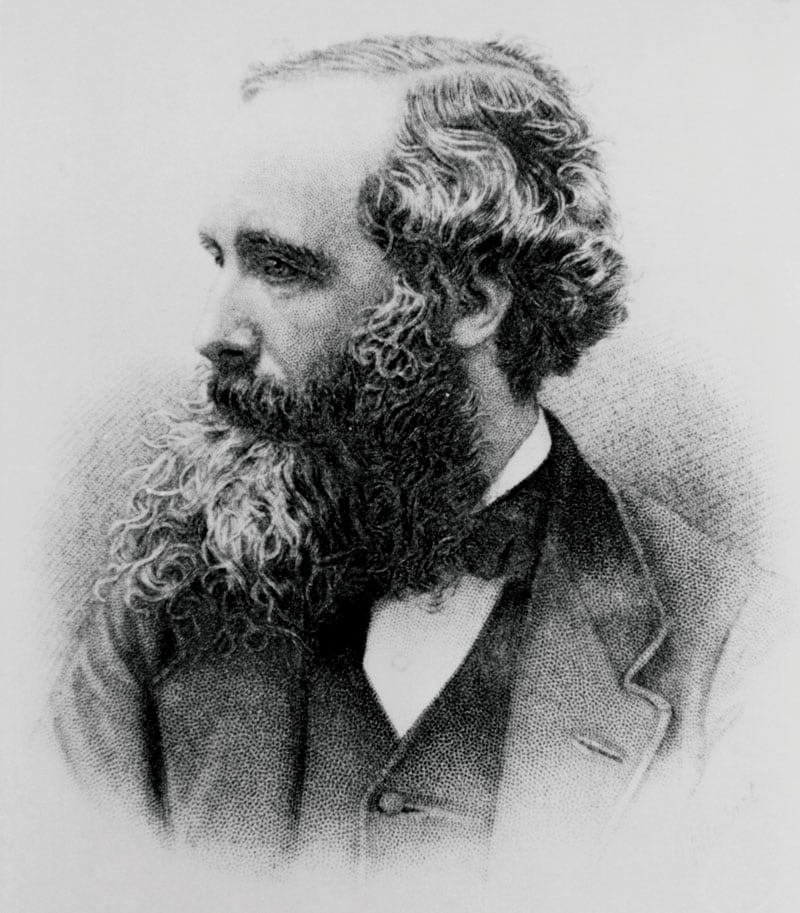
When the great physicist Richard Feynman was asked to describe how magnets work, he made an exceptionally important point about explaining physics to a general audience. Feynman believed that not everything can be, or should be, reduced to an explanation of just a few minutes and a simple, but potentially misleading, real-world analogy. As he famously said when asked to briefly explain his Nobel-prize-winning work on quantum electrodynamics: “Listen, buddy, if I could explain it to you in a minute, it wouldn’t be worth the Nobel prize.”

To me, Feynman’s comments illustrate the inherent tension between the journalistic and academic approaches to science communication – and it is a point that I have debated at length with Haran and a number of other colleagues involved in Sixty Symbols. Indeed, so concerned was I at having misrepresented important physics in a couple of videos that last year I decided I would bow out of contributing to Sixty Symbols. What changed my mind was a message from a 16 year old in Dublin who said that the Sixty Symbols videos are what had inspired him to pursue a career in science. Since watching them, he had ended up getting an A in his Junior Certificate exam, having previously scraped Bs and Cs.

Perhaps it’s the Irish connection (I did my undergraduate degree and PhD at Dublin City University) but I found that message affecting and humbling. When Sixty Symbols has that type of influence, I can live with a few qualms about the nature of YouTube edutainment.

YouTube science – from those who’ve taken part

Laurence Eaves, Meghan Gray, Mike Merrifield, Tony Padilla

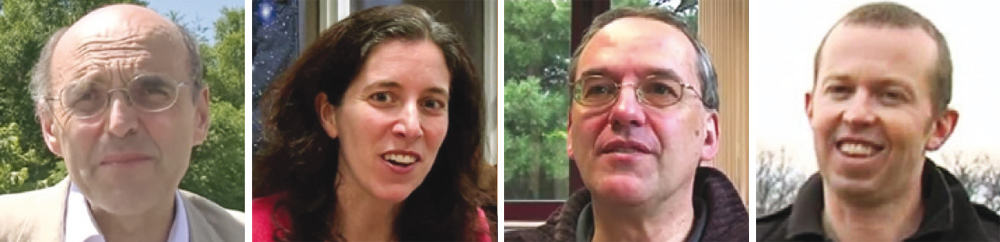
Laurence Eaves, semiconductor physicist
Appears in: Sixty Symbols, Numberphile
It’s rewarding that people come up to me in a railway station, museum or cinema foyer and tell me that they are fans of our videos. It’s like Alvy Singer being recognized by a fan in Woody Allen’s Annie Hall!

Meghan Gray, astronomer
Appears in: Sixty Symbols, Deep Sky Videos
It’s wonderful that by chatting to Brady Haran for half an hour in my office, I can reach tens of thousands of people around the world, many of whom kindly take the time to get in touch and express their appreciation.

Mike Merrifield, astronomer
Appears in: Sixty Symbols, Deep Sky Videos, Backstage Science
A rewarding aspect of the YouTube experience is when the DHL delivery man says “Nice videos, by the way” as he’s leaving.

Tony Padilla, cosmologist
Appears in: Sixty Symbols, Numberphile
Making videos about stuff you aren’t as expert on as you’d like to be is challenging. When you really stray away from home, you have to put in much more preparation time, and it can be a bit like revising for an exam. And the examiners are the viewers. They don’t miss a trick.

Finding better ways to pack polyhedrons

Finding the most efficient way to pack simple objects such as spheres has entertained and infuriated mathematicians from Aristotle to the present. Now, a team of physicists and mathematicians in the US has taken a new computational approach that puts the problem on a more systematic footing. The team looked at how packing efficiency varies as the shape of the object is modified. The results could have important consequences in nanotechnology and other areas of science.

Greengrocers stacking oranges, sailors filling ships’ holds with cannonballs and chemists growing nanoparticles all want to arrange objects in containers with as little wasted space as possible. While the problem is simple to conceive, it has proven to be fiendishly difficult to solve mathematically. In 1611, for example, Johannes Kepler published his famous conjecture that the most efficient way of stacking spheres is the face-centred cubic arrangement, in which the spheres occupy about 74% of the container’s volume. But it was not until 1998 that the American mathematician Thomas Hales proved Kepler correct in a paper that ran to more than 100 pages.

For other simple objects such as a triangular pyramid (or tetrahedron), exact solutions have proven to be elusive. Instead, mathematicians calculate the packing efficiencies of known arrangements of these objects – often using powerful computer programs – in search of the highest value.

Edges and corners

In this latest research, a team of mathematicians and physicists at the University of Michigan has taken a new approach to this old problem. Sharon Glotzer and colleagues looked at how the maximum packing efficiency of tetrahedrons and several other simple polyhedrons varies according to two parameters. These parameters describe the amounts by which the edges and the corners of the polyhedron are truncated. Glotzer, who is a physicist, explains that this choice was not entirely arbitrary. “For any kind of particle, the corners and the edges are the highest energy and most fragile parts.” She adds: “Whether you have grains of sand being sheared over one another or 10 nm cadmium telluride semiconducting crystals, the corners and the edges are the places most likely to become blunted or be able to be manipulated.”

By allowing the shapes of the objects to change, the team was able to describe the packing in terms of maps of 2D surfaces in an infinite-dimensional “shape space”. “The question in the packing community has always been ‘What is the densest possible packing of this shape?'”, says Glotzer. “We’re trying to flip that question to ask ‘what does the packing surface look like in the neighbourhood of your shape?'”

To keep the problem manageable, the researchers assumed that the structures fell into regular lattices with four or fewer objects per unit cell. This arrangement is found in most efficient packing structures, but has never been rigorously proven to be the most efficient.

Missing regions

The researchers started by using a computer model to calculate and maximize the packing density for various values of corner and edge truncation. Michigan mathematician Elizabeth Chen calculated the equations for the various surfaces generated by different packing structures in shape space. She then set the equations equal to each other to find the values at which one packing structure would become more efficient than another and what the packing efficiency would be at those points. “This is how we figure out whether two regions are neighbouring”, says physicist Daphne Klotsa. “If we have two sets of equations and we can never make them meet, that means that there is another region in between that we didn’t find, so we have to look for it in the simulations with a finer grid.”

The results were intriguing and often unexpected. In some cases, a particular packing structure dominated and the packing efficiency varied smoothly across large regions of parameter space. In other cases, however, the packing efficiency varied rapidly and in a highly corrugated manner. Chen jokes that the graph of maximum packing efficiency for one shape looked like “an angry alien spider”, and another resembled “a psychedelic quilt” (see figure).

Glotzer says that experimentalists have already shown interest in the team’s findings, which could help chemists and colloid physicists to create ordered crystals. “Immediately it can start guiding them into what kinds of shapes have the highest propensity to pack into high-quality crystals,” she explains.

Lowering the pressure

Joost de Graaf, at the Institute for Computational Physics in Stuttgart, says: “I was not surprised to see the paper but I was interested in it because it does solve some questions that were left open in previous studies and I think that’s really helpful to the community.” He suggests that further work could focus on other parameters that dictate how particles pack in alternative conditions. “These are all densest packings,” he says, “and while at infinite pressure the densest packing will be the stable phase, it is not given at all that at lower pressures the configuration the particles assume is the same or even remotely similar.” Klotsa is currently preparing a paper examining the question of when particles will adopt the densest possible configuration.

The research is published in Physical Review X.

“Mile-high” physics

By Tushna Commissariat at the APS March Meeting in Denver

The city of Denver, Colorado has been invaded…or so I am sure the locals will feel over the next few days, as more than 9000 physicists from all over the world have arrived to take part in the APS March Meeting. I have been here in the “Mile-high city” of Denver – so nicknamed thanks to its official elevation that is exactly one mile or 5280 feet above sea level – since Sunday morning, and physics is the talk of the town as everyone descends upon the Colorado Convention Center (pictured above).

As always, there is a wide variety of interesting talks, sessions and press conferences over the next few days and I would have to clone myself multiple times to get around to all of them. Talking about cloning, though – I have just been to my first session, where Stanford researcher Patrick Hayden was taking about quantum information and asking whether or not it could be cloned in space–time. I will be speaking with Hayden later in the day, so watch this space if you would like to know more.

I will also be going to hear more about historians and the work they do to extend the “half-life” of science stories, how bacteria evolve and invade, and how they could be used to build circuits, as well as a talk about the visa-application hurdles faced by international scientists who visit the US and more – and all of this is just today!

Make sure you keep an eye on the physicsworld.com blog over the next four days and also keep an eye on my Twitter feed @tushna42 (and the hashtag #apsmarch). I will try to live Tweet and post images from some of the more interesting sessions I attend.

Between the lines

Mastering quantum mechanics

Leonard Susskind’s book The Theoretical Minimum was a surprise bestseller in 2013, defying conventional wisdom about the perils of mixing equations and popular science. Its sequel, Quantum Mechanics: the Theoretical Minimum, is similar in many ways. Both books are based on Susskind’s popular continuing-education course at Stanford University. Both were co-written with one of his students in that course, although this time around, Art Friedman, a data consultant and former software engineer, has taken over the co-author role from science educator George Hrabovsky. And of course, the new book is just as mathematical as its predecessor. But there are also some differences. As Susskind and Friedman point out, quantum mechanics is “technically much easier” than its classical predecessor, but it is famously hard to get one’s head around. Their book also takes a different approach from that of many undergraduate quantum-mechanics courses, covering entanglement, quantum information and even tensor products before encountering that old standby, the simple harmonic oscillator, in the 10th and final lecture. Readers who have seen such material before, even if in the distant past, will probably get more out of Quantum Mechanics than complete newcomers will. Indeed, Friedman himself qualifies as a lapsed quantum mechanic, having earned an undergraduate degree in physics before switching to computer science. As he puts it, “the world seems filled with people who are genuinely, deeply, interested in physics but whose lives have taken them in different directions. This book is for all of us”.

  • 2014 Allen Lane/Basic Books £20.00/$26.99hb 384pp

Now try writing about it

Tendencies towards over-formality and obfuscation in written communications by scientific practitioners have been shown to inhibit reader comprehension. Fortunately, as Anne Greene demonstrates in her book Writing Science in Plain English, such problems are not inevitable. Greene teaches scientific writing at the University of Montana, and her book offers solutions to many common faults, including wordy phrases, passive voice and poor sentence structure. She also digs into topics such as the “register”, or tone, of a piece of writing. In casual conversations, most people employ an informal register (“How the heck do porcupines manage to mate with all those spines everywhere?”), but authors of journal articles tend to use the abstract register (“The assessment of strong direction tendencies of the North American porcupine was made…”). In Greene’s view, neither register is appropriate for scientific writing. Instead, she recommends the “conventional register”, where the author tells a story with identifiable characters in a formal and emotionally neutral way (“Male porcupines are polygamous and defend several females, and I hypothesized that competitively dominant males would have larger home ranges”). The book’s numerous exercises give readers the chance to practise their writing and editing skills, while excerpts from well-written papers in a variety of disciplines (including astronomy and genetics as well as wildlife biology) offer inspiration. Slim enough to read on a short-haul flight and small enough to tuck into a laptop case, this book makes a good travelling companion for physicists who want to improve their professional communication skills. After all, education doesn’t stop when you graduate.

  • 2013 University of Chicago Press £9.00/$13.00pb 136pp

Fun and educational

When the list of children waiting to join Caroline Alliston’s UK-based science club grew longer than the club’s actual membership roll, she knew that she was doing something right. However, the engineer and mother of two also knew that she couldn’t be in three places at once. Her solution was to collect some of her club’s most successful experiments and publish them for others to use. Alliston’s latest collection, Physics for Fun, follows two that were nominally devoted to technology and features 30 all-new projects. The book gives roughly equal space to mechanical projects (such as a miniature trebuchet) and electrical ones (including a hydrogen generator and a model house with working doorbell, lights and fan). Most experiments require only common household items, and tweens and young teens should be able to build them without much adult guidance. However, the physics behind some is rather complex, and Alliston’s short, child-friendly scientific explanations do not always do it justice. The second project in the book, for example, is a spectroscope made from an old compact disc. Although the spectroscope is fairly easy to construct, a proper explanation of how it actually works would challenge A-level students, never mind the book’s target audience of children aged 7–14 years. Long on fun but perhaps a little short on physics, Physics for Fun nevertheless makes a good source of ideas for parents, teachers and would-be science-club founders.

  • 2013 Alliston Publishing £5.00pb 60pp

Homework help from NASA, rescue missions, top technologies and more

By Tushna Commissariat

Who doesn’t like a bit of help with their homework – not 4-year-old Lucas Whiteley from West Yorkshire in the UK.  When faced with some tough and rather complex scientific questions, the enterprising child filmed a video of himself asking the US space agency NASA for some help. And much to his delight, he got a video response courtesy of NASA engineer Ted Garbeff of the Ames Research Center in California. In the 10-minute video, Garbeff answers Whiteley’s questions including “How many stars are there?” and “Did any animals go to the Moon?” Of course, the story garnered nation-wide interest and was covered by the Huffington Post, the Telegraph and others. Take a look at Garbeff’s response video above.

(more…)

Physics World brings Feynman lecture to life

Commissioned by Physics World for the March 2014 education special issue, which examines new ways to teach and learn physics, this colourful image is based on a lecture by Richard Feynman called “The Great Conservation Principles”. It is one of seven Messenger Lectures that the great physicist gave at Cornell University in the US exactly 50 years ago, a video of which can be watched here or in the digital version of Physics World.

The drawing’s creator is professional “science doodler” Perrin Ireland – science communications specialist at the Natural Resources Defense Council in the US – who describes herself as “a learner who needs to visualize concepts in order to understand them”. For people like Ireland, thinking visually or in a story-like way helps them to recall facts and explanations, which can come in very useful when trying to learn something new.

So to find out what science doodling could bring to physics, we invited Ireland to watch Feynman’s 1964 lecture and create a drawing for us – the picture above being the result. Half a century after his lecture, Feynman remains an iconic figure in physics and although we’ll never know what he would have made of Ireland’s doodle, our bet is he would have been amused.

You can click on the image to see it in greater detail, and if you’re a member of the Institute of Physics (IOP), you can find out more about Ireland’s work and her motivations in an article in the digital version of the magazine.

Physics World March 2014 cover


If you’re not yet in the IOP, you can join now to get full access to Physics World as well as many other member benefits.

The issue is well worth checking out as it contains a heap of other great material on physics education. We examine the huge growth of “massive open online courses”, or MOOCs, in which universities make their lectures freely available in video form on the Internet, while physicist Philip Moriarty describes his experiences as one of the stars of the Sixty Symbols series of YouTube science videos. Both articles have specially made videos embedded in the digital magazine.

We also look at the importance of giving children computer-programming skills from an early age and there’s a great feature by BBC science presenter Fran Scott, who reveals her golden rules for engaging children with science. Physics-education experts Eugenia Etkina and Gorazd Planinšič, meanwhile, examine the implications for teachers of the fact that learning involves physical changes in the brain.

For the record, here’s a a run-down of highlights in the issue.

Taking modern physics into schools – Having helped to introduce a new curriculum in Scottish schools that showcases the latest physics research, Martin Hendry describes the lessons learned in bringing cutting-edge physics into the classroom

Feynman’s failings – They were never successful as a textbook. So why, a half-century after their publication, do so many physicists keep Richard Feynman’s three volumes within reach? Robert P Crease has a theory

Computing in the classroom – Computer science is essential for modern physics, yet students come little prepared for it. That may soon change, says Jon Cartwright

The power of YouTube – As one of the presenters of the hugely successful Sixty Symbols series of YouTube science videos, Philip Moriarty describes his experiences in front of the  camera and how they have transformed his ideas about bringing physics to wider audiences

Rules of engagement – Empowering children to look at the world around them with curious, questioning eyes is the goal of Fran Scott, who describes the golden rules she follows to do just that

Learning by doodling – Do your reams of written lecture notes ever really sink in? Louise Mayor investigates how visual methods can help you process and remember information

The MOOC point – Massive open online courses give students free access to some of the world’s top educators. James Dacey explores the benefits and drawbacks of these courses compared with those traditionally offered by universities

Thinking like a scientistEugenia Etkina and Gorazd Planinšič describe how research into how people learn – plus the desire to help all students develop scientific “habits of mind” – is reshaping the way they teach physics

We are bound by symmetryMatthew R Francis reviews The Universe in the Rearview Mirror: How Hidden Symmetries Shape Reality by Dave Goldberg

Plutopia foreverKate Brown reviews The Girls of Atomic City by Denise Kierman

Graduate careers special – Our bi-yearly special looks at the challenges of working abroad for physicists

Navigating new cultures – Working overseas is a common career step for physics graduates, but moving countries can produce a culture shock. Sharon Ann Holgate explains how to manage the effects of cultural differences

Making the right move – Your first steps into the world of work after graduation are an adventure and working abroad can seem like an especially exciting way to begin. But is it right for you? Marcia Malory investigates

Lateral Thoughts: But it’s obvious David Pye on strange conventions in physics

Enjoy the issue – and if you fancy trying a doodle of your own, we’d love to see your efforts, which you can e-mail to pwld@iop.org.

Black hole winds stronger than expected

Black holes release more energy into their host galaxies than previously thought, according to an international team of researchers. The team observed a microquasar in the galaxy M83 and found that the outgoing kinetic power of the object was more than predicted for a black hole of that mass. Their finding should help improve models of how black holes evolve over time, as well as improve our understanding of the effects of black holes on gas in the early universe.

A microquasar is made up of a compact central object such as a black hole, which is surrounded by an accretion disc of in-falling matter and a pair of bright radio jets. While normal quasars consist of supermassive black holes that are millions of solar masses, microquasars involve a “stellar mass” black hole that is usually about three to ten times the mass of the Sun. Another common feature of microquasars is that their accretion discs tend to be very luminous in the optical and X-ray regions.

Jet setting

In the new work, Roberto Soria at Curtin University, Australia, together with other colleagues in Australia, the US and the Netherlands monitored the outflow of the black hole MQ1 for over a year. “We observed a bubble of hot gas, with characteristic optical and infrared lines from hydrogen, sulphur, oxygen and iron. This suggested that something was heating or shocking this gas,” says Soria. The bubble has two lobes sticking out of it, suggesting that there is a pair of jets. “We detected very strong radio emission from that same bubble…that is usually a signature of a powerful jet slamming onto dense gas and producing energetic electrons,” he says.

Indeed, when they looked at the X-rays coming from the object they saw a point-like source in the centre of the bubble. This type of emission is exactly what is expected from the vicinity of a black hole that is sucking in a lot of mass, according to Soria. They then used the spectral information to estimate the power of the jet. Combined with the temperature and luminosity of the X-ray emissions from the accretion disc, they estimate that the black hole is about 100 km across. From that, the researchers can tell it is definitely less than 100 solar masses. “In fact, I think probably much less…about 10–50 solar masses, but we cannot be sure because that depends on black hole spin and viewing angle, and we do not have any information,” explains Soria.

Going with the flow

What is surprising about the system is that the black hole appears to be emitting more energy than expected for its mass. As mass accretes around a black hole, it gets heated and ionized and the black hole releases energy in the form of radiation (X-rays) and an outflow of particles referred to as mechanical power. The radiation flowing outward cannot exceed the “Eddington limit”, which is related to the black hole’s mass. The Eddington luminosity is the maximum luminosity a stellar body can achieve when there is a balance between the outward force of radiation and the inward gravitational force. While the radiation is strictly governed by this limit, it has not been clear if the mechanical power – in the form of particle jets and winds – is constrained by the same limit.

If you have a few of those beasts in a small galaxy, they can easily heat and blow away all the gas in the galaxy

Roberto Soria, Curtin University

“The jet is not limited by the Eddington luminosity, because it’s very thin…very collimated. It pierces a hole straight through the gas, like shooting bullets at a cloud,” explains Soria. But astronomers use the Eddington limit as a unit of measurement for “absolute power” of a black hole. Soria explains that the luminosity itself can go three or four times past the limit, which can be thought of as the point at which a further increase in mass has a negligible effect on the power. This occurs because it takes an exponential increase of the mass falling in to cause a linear increase in power.

In the past, it was thought that the mechanical power produced by a stellar-mass black hole was always less than the radiation, but the team’s latest work shows that it can be as high or higher. Soria tells physicsworld.com that over the last few years, astronomers have discovered about a dozen stellar-mass black holes with powerful jets in nearby galaxies and that MQ1 is one of the most powerful. Also, MQ1 is the first object whose mass is constrained, allowing the team to confirm that stellar-mass black holes can reach this mechanical power of a few million times the current output of the Sun. Intriguingly, another class of powerful black holes found in nearby galaxies that reach characteristic luminosities of a few million times the Sun, but with radiation rather than mechanical energy, have been detected. Such “ultraluminous X-ray sources” (ULXs) are also thought to be powered by stellar-mass black holes.

Early ionization

Soria says that because of recent work on microquasars and ULX research, astronomers are starting to form a coherent view of stellar-mass black holes in the local universe. He adds that this knowledge could lead to a better understanding of quasars in the early universe, which were then accreting at the maximum rate.

Mitch Begelman, a theoretical astrophysicist from the University of Colorado, Boulder in the US, who was not involved in the work, says that while the result is not surprising “it does provide a new, intriguing piece of evidence along the lines of what many of us have long suspected. I don’t think it requires a new view of black hole physics, but might help to settle some lingering questions about the nature of ULXs and outbursts from microquasars”.

In the long run, the new work could help researchers understand how stellar-mass black holes may have had a significant role in ionizing and heating ambient gas in the early universe. “Today such powerful sources are rare, but we think they were much more common at the time. Star formation was more active at that time, so more of these microquasars were formed. If you have a few of those beasts in a small galaxy, they can easily heat and blow away all the gas in the galaxy,” says Soria.

The research is published in Science.

How fictional models shape science

Too often, the word “fiction” is used to describe highly speculative hypotheses put forward by modern science. This is especially true in high-energy physics, cosmology and astrophysics (to name a few). For example, string theory is frequently slapped with the “fiction” label because it fails to make empirically testable predictions, has a tremendously large number of solutions and involves a very large set of possible universes.

But to claim that this type of research is somehow science fiction rather than physics is to misunderstand not only the role that fictional modelling has in science, but also the importance of theoretical speculation. After all, James Clerk Maxwell’s prediction of electromagnetic waves that travel at the speed of light was not testable when he made it in 1862; indeed, a quarter-century passed before Heinrich Hertz verified the existence of such waves. Similarly, when the Higgs boson was proposed in 1964 it was not testable either, and finding evidence for its existence took even longer.

Attempts to differentiate fiction from theoretical speculation give rise to an important question: how should we interpret scientific models that incorporate idealized, abstract descriptions that bear little resemblance to the physical and social world we inhabit? The question is important because much of our knowledge of physical phenomena, such as superconductivity and the Higgs boson (not to mention government decisions related to economic policy and plans for urban development), originates with model-building activities.

From an ideal world…

In some contexts, such as architectural design, models are miniature replicas of what the finished building will look like. But in other fields, models are highly idealized descriptions of phenomena that don’t (and won’t) exist in nature. For instance, many economic models presuppose that people have perfect information about the economic system they are dealing with, and that all of us make wholly rational decisions on the basis of this information. No real person is capable of such behaviour, yet the idealized human known as “rational economic man” lies at the foundation of many economic models.

Similarly, in modern physics, gases are often modelled as if they were composed of infinitesimally small molecules that have no forces acting between them, when in fact molecules do have a finite size and are subject to intermolecular forces. And in population genetics, many models assume random mating and infinite populations when calculating the effects of natural selection.

These types of modelling share a common feature: although the basis for the model is in some sense a fictional entity (one that doesn’t exist in reality), we know how to add corrections to the model to bring it closer to actual situations. We can adjust economic models in ways that incorporate relevant but less than perfect information; we can add mass and forces to gas models to make them more realistic; and we can use approximation techniques to adjust for populations that are very large but not infinite. Hence, although these models are fictional, there are strategies available that enable us to use them to explain and predict features that interest us.

But while I have used the word “fictional” to describe these models, this is somewhat of a misnomer. The model-maker’s goal is not to create a fictional representation and see how (or whether) it compares with reality. Rather, the process of creating an ideal, abstract version of a system is often a way of making models more mathematically tractable, or of focusing on properties of interest for the problem at hand. For instance, when we want to model fluid flows, we do not take account of quantum properties; in fact, we sometimes don’t even take account of frictional forces. Instead, the fluids are modelled in an “ideal” way. So in some sense, models of this type are not really fictional at all, because their aim is to provide accurate information about real phenomena.

…to an imaginary one

Many models used in physics, economics, biology and other sciences involve descriptions that are fictional in a stronger sense. Models of this type cannot be said to describe real phenomena even in principle, regardless of how many parameters or approximations are added. For example, fictional models frequently occupy centre stage in econophysics, a field that uses physics techniques to study the dynamical behaviour of financial and economic markets. In statistical econophysics, economic agents are treated like microscopic particles in statistical physics: they are modelled as having no intelligence; their behaviour is completely random; and the mathematical outputs of the model are analogous to diffusion reaction models in physics. In this case the fictional, unrealistic aspects of the model(s) are its essential features, and part of its very structure. Moreover, there is no question of adding realistic parameters to it, since the model’s fictional status is the reason it functions in the first place. Not only does it enable the user to manipulate large data sets in a relatively simplified way, it also highlights various aspects of financial markets that had not previously been studied in traditional economic analysis. These include phenomena such as the inverse relation between market stability and the range of financial instruments available for facilitating trades.

Some models cannot be said to describe real phenomena even in principle, regardless of how many parameters are added

It is possible, of course, to object to this example on the grounds that the use of some econophysics modelling techniques was partly responsible for the financial crisis in 2008. For example, the famous Black–Scholes model, which describes how the prices of stocks and other financial instruments vary over time, assumes that price changes follow a Gaussian distribution where the probabilities of extreme effects are negligible. Unfortunately for the world’s investors, wildly fluctuating markets – like physical systems exhibiting critical behaviour – resist this type of modelling. Instead, they require tools from dynamical systems theory (specifically renormalization group techniques) that allow for “fat-tailed” non-Gaussian distributions of price changes that take account of strongly correlated events. However, it is important to remember that these other tools are also idealized. Hence, it wasn’t the use of highly idealized models that was the culprit in the financial crisis; rather, it was the use of the wrong type of model for the problem at hand.

Another example of the usefulness of fictional modelling can be found further back in the history of physics. To derive his famous field equations for electromagnetism, Maxwell relied on a model of the aether – the supposed carrier of light waves – that consisted of rotating elastic vortex cells separated by electrical particles. We know now that the aether does not exist, and Maxwell himself referred to his model as “imaginary”. However, it nevertheless enabled him to formulate the equations governing electromagnetic phenomena, and to show that light and electromagnetic waves are one and the same.

Under these circumstances, it seems natural to ask how a fictional structure can deliver information about real concrete physical systems or financial markets. How do we get from a model that is “false” to information that is true or reliable?

Turning fiction into reality

James Clerk Maxwell

To see how a fictional structure can give rise to reliable explanations, let us look at Maxwell’s work in more detail. His four equations – which appeared together for the first time in his 1861–1862 paper “On physical lines of force” (Philosophical Magazine, available online at http://ow.ly/scEDk) – describe the electric and magnetic fields arising from varying distributions of electric charges and currents, and how those fields change in time. Before Maxwell, accounts of electromagnetic phenomena had been based on (among other things) Ampère’s law, which related the magnetic field to its electric current source. In addition, Michael Faraday had put forward the idea that the seat of electromagnetism was in the spaces surrounding wires and magnets, rather than in the objects themselves. Faraday used iron filings to visualize the patterns of electromagnetic forces in space, referring to their spatial distribution as “lines of force” that constituted a “field”.

Maxwell hoped to build on this work by creating a model that showed how electromagnetic phenomena could be accounted for in terms of a field rather than by charged objects (which he interpreted as “centres of force”) acting at a distance. He wanted to develop these ideas in a visualizable but mathematically precise way – a process that involved formulating equations that could describe the propagation of electromagnetic waves through space. This was especially challenging because, at the time, light waves were thought to be distinct from electromagnetic phenomena, and while there was supposedly an aether that carried light waves, no such structure existed for electromagnetic waves. So how could a fictional model enable Maxwell to derive field equations that ultimately identified light with electromagnetic waves?

To find the answer, we need to understand how the model first allowed Maxwell to mechanically represent wave propagation in a field, and then enabled him to formulate the proper mathematical equations describing behaviour such as the build-up of charge – all without any appeal to explanations involving charged objects. Maxwell constructed his model by assuming that the aether was composed of elastic “vortex cells”, separated by electrical “particles” that acted like idle wheels in a system of gears (figure 1). These particles were assumed to exert tangential forces on the surfaces of the vortices, causing the vortices to deform. The resistance of the vortices to this deformation resulted in an inertial reaction force on the particles, which Maxwell identified as electromotive force.

1 Wheels within wheels

Schematic diagram of James Clerk Maxwell’s model of electromagnetismJames Clerk Maxwell’s schematic diagram of his model of electromagnetism, which hypothesized an aether filled with elastic vortices (represented by large hexagonal spaces) and surrounded by electrical particles (small circles) that acted as idle wheels. In the model, interactions between the vortices and the particles give rise to electromotive force, electric current and displacement current. If a current flows between point A and point B, the row of vortices labelled g–h will be set in motion in an anticlockwise direction (denoted +). The layer of particles p–q will be acted on by the g–h vortices, causing them to move in a clockwise (–) direction from right to left – thereby forming an induced electric current. If this current is checked by the electrical resistance of the aether, the rotating particles will act on the row k–l of vortices, causing them to also revolve in the (+) direction. This movement continues until the vortices reach a velocity such that the motion of the particles is reduced to simple rotation, resulting in the disappearance of the induced current.

When the vortex cells in Maxwell’s model rotated, their rotation set the particles between them in motion. This movement of particles was, naturally, interpreted by Maxwell as an electric current. However, Maxwell also reasoned that the progressive distortion of the vortices would cause the particles to move in the direction of the distortion (figure 2). This motion would produce an elastic restoring force that led to a reverse polarization, and hence a reverse current. Maxwell identified the distortion of the vortex cells as the displacement of electricity, and the current that resulted from it came to be known as the displacement current.

We can see how Maxwell’s model worked by considering a basic circuit for charging a parallel-plate capacitor. When current flows through the circuit, electric charge will gradually build up on the capacitor plates. Maxwell’s model accounts for this behaviour by suggesting that progressive distortion of the vortices in the space between the plates – and the displacement current such distortion produces – causes tension to build up in the aether. Maxwell identified this build-up of tension with electric charge.

The capacitor example is important because it represents a situation not covered by the original formulation of Ampère’s law, which involved only closed circuits. But if electromagnetic waves were capable of travelling through space, as they do when current flows through the space between the capacitor’s plates, then an additional term – the displacement current – needed to be added to Ampère’s law to account for the free transmission of electricity. It was this displacement term that essentially represented the field theoretical features of electromagnetism.

Maxwell used this model of elastic, deformable vortices and the accompanying displacement of electricity as a basis for deriving his electrostatic force law. In doing so, he was able to account for the fact that a changing magnetic field induces an electric field and a changing electric field induces a magnetic field. This, in turn, led to his crowning achievement, which was not just to show that the electromagnetic field was responsible for the propagation of electromagnetic waves, but to calculate that the velocity of such waves coincides with that of light. Ultimately, what the various mechanisms in the model provided was a way of showing how electricity could travel in free space – all on the basis of a fictitious representation.

2 A build-up of tension

The motion of particles in Maxwell's model of electromagnetism produces a distortion in the aetherIn James Clerk Maxwell’s diagram of his model of electromagnetism, the motion of the particles produces a distortion in the aether.

Seeking generalizations

In Maxwell’s case, the route from fictional model to reality came via the fundamental mechanical features of the model, such as the vortices, the electrical particles and the ways they interacted. These features constrained how the physical and mathematical aspects of electromagnetic forces could be described, in much the same way as character development in a novel determines, to some extent, how the story will play out. In other words, the model furnished a “possibility structure” that helped bring into being the mechanical laws and equations representing the behaviour of electromagnetic field phenomena.

Of course, it remained for experiment to decide whether those equations matched reality. But understanding how the fictional model could function in this way requires a careful analysis of the model itself, one that includes both the kind of information the model yields and how that information can be used to develop physical hypotheses and predictions. Although the fictional representation supposedly bears a certain structural similarity to physical reality (for example, both obey mechanical laws) the model functioned as a self-contained entity in Maxwell’s investigations. The model, rather than some experimental reality, was the object of inquiry, and predictions were made about the electromagnetic field on the basis of its output.

This example suggests that the answer to our question about how fictional models provide accurate information is that there is no general answer. The process takes place in a way that is specific to the particular model and system under investigation. For example, not all models display the kind of mechanical intricacy that Maxwell’s did. A good example is the comparatively simple Ising model, which is used in explaining the behaviour of magnets and other types of phase transitions. It consists of a set of magnetic spins arranged on an abstract mathematical structure called a lattice. How such mathematical structures provide information about physical systems is also an important question for understanding scientific modelling. To answer that question we need to know how mathematics relates to the world. But are mathematical entities real? Or are they, too, a kind of fiction?

Exoplanets are everywhere

Just a few years ago the idea that more than 700 exoplanets could be discovered in a single study would seem fantastical. But that’s exactly what astronomers working on NASA’s Kepler mission have just done.

By analysing data obtained by the space telescope between May 2009 and March 2011, the team has verified the existence of 715 exoplanets. This brings the total number of planets that orbit stars other than the Sun to nearly 1700.

Many of these recent discoveries were found in multiple-planet systems, suggesting that our solar system could be the norm. For those keen on finding life on other planets, four of the new exoplanets are less than 2.5 times the size of Earth and orbit within their star’s habitable zone.

Indeed, as the above image shows, this latest haul of exoplanets is skewed towards smaller bodies like the Earth. This is unlike earlier discoveries, which tended to be Jupiter-sized worlds that are easier to detect. As a result, it’s looking more likely that Earth-like planets could be very common in the local universe.

The results of the study will be published on 10 March in The Astrophysical Journal and are available as two preprints on the arXiv server: “Validation of Kepler’s Multiple Planet Candidates II” and “Validation of Kepler’s Multiple Planet Candidates III“.

Stay tuned to Physics World for more about what the climate could be like on exoplanets, and whether some could be suitable for life.

Data stored in magnetic holograms

A new type of memory device based on the interference of spin waves has been unveiled by scientists in the US and Russia. Data are stored in the form of magnetic bits and read out simultaneously as holographic images. Because the wavelengths of the spin waves are much shorter than those of light, the storage density of the memory has the potential to be much greater than systems based on optical holograms, and could someday be used to store very large amounts of information.

Conventional holography involves splitting a beam of laser light into an illumination beam and a reference beam. The illumination beam is fired at the object of interest and the deflected light is sent to a detector (or photographic film), where it is reunited with the reference beam. The detector records the interference between the two beams and this information is then used to create a 3D image of the object. As well as being used as a security feature on credit cards and banknotes, holograms also have the potential to store and retrieve large amounts of information in a very efficient way.

However, the storage densities that can be achieved using optical holograms are limited by the relatively long wavelengths of visible light – about 500 nm. Now, Alexander Khitun and colleagues at the University of California, Riverside and the Kotel’nikov Institute of Radioengineering and Electronics in Saratov, Russia, have created a holographic memory that uses spin waves, which have much shorter wavelengths.

X and Y orientations

The team’s prototype device comprises two small magnets – each about 360 μm wide – that are connected by a magnetic wire. Data are stored in the device in terms of the orientations of magnetic moments of the magnets. For example, the “00” state corresponds to both magnets being oriented along the x-axis and “01” corresponds to the first magnet being oriented along x-axis and the second along the y-axis.

As well as being connected to each other, each magnet also has three other magnetic wires connected to it for the purposes of inputting and outputting spin waves. The waves are created by applying an electrical signal to tiny antennas connected to the wires, and the antennas also act as spin-wave detectors.

Data are written to the device using spin waves with relatively large amplitudes that are capable of changing the orientation of the magnet bits.

The read process involves sending spin waves with smaller amplitudes through the device, where the phases of the waves are affected by the orientations of the two bits. The antennas are then used to measure the interference between the waves. By varying the relative phases of the input spin waves, the team can build up a holographic image of the orientation of the two magnets. This is analogous to how an optical holographic image is built up by varying the angle between the object and the illumination beam.

Simultaneous access to data

While creating a device based on two magnetic bits might not seem like a major breakthrough, the holographic nature of the technique means that it could be used to read and write huge numbers of data simultaneously to and from large arrays of magnetic bits. This is unlike hard-disk drives (HDDs), which read and write data sequentially from magnetic bits. What is more, because the wavelength of the spin waves is about 10 nm, devices with storage densities comparable to the best HDDs could be built – at least in principle.

The team’s first prototype uses relatively large wires and magnets, but Khitun told physicsworld.com that the team has already built a working prototype where the magnets have been shrunk to 12 μm. Furthermore, he says that numerical simulations suggest that reliable devices could be made with feature sizes as small as 10 nm. Khitun and colleagues are also working on a memory device based on a 4 × 4 matrix of 16 magnetic bits, which they plan to demonstrate later this year.

The memory is described on the arXiv preprint server.

Copyright © 2026 by IOP Publishing Ltd and individual contributors