Italy’s space activities have been thrown into uncertainty following the resignation of Enrico Saggese as president of the Italian Space Agency (ASI). Saggese stepped down in the wake of investigations by prosecutors regarding possible fraudulent contracting, expenses-paid holidays and questionable consultancies awarded by the agency. The organization, which has an annual budget of around €500m, will now be run by a government-appointed commissioner until a new president is nominated.
The presidency of Saggese, an electronics engineer, was controversial from the start. He took over as a commissioner in 2008, after the then government of Silvio Berlusconi removed the existing president, astronomer Giovanni Bignami. Saggese’s arrival angered many scientists not only for the treatment handed out to his predecessor but also because of question marks over the new chief’s independence. Saggese was vice-president for space activities at one of ASI’s biggest contractors – aerospace and defence giant Finmeccanica. Doubts notwithstanding, however, he was appointed president of the agency a year later.
According to the newspaper La Stampa, the latest investigations were sparked by a whistle-blowing ASI manager who told prosecutors in Rome that he had noticed “irregularities” in the agency’s operations, including “invoices for non-existent transactions”, and who said that Saggese had threatened to ruin his career when he brought the matters to light. The prosecutors subsequently put Saggese and six other individuals under investigation for their alleged involvement in bribery, the offices and homes of whom were raided by police on 6 February.
Investigators are also studying documents relating to a lavish trip to California that Saggese is alleged to have laid on for 33 guests using mainly public money. The visit, which cost a reported €930,000, is said to have involved business-class flights and nine days’ worth of luxury accommodation in order to watch a rocket launch that in the end did not take place.
Stepping down
In his letter of resignation, which he sent to research minister Maria Chiara Carrozza the day after police searched his offices, and which was accepted a few hours later, Saggese claims he is innocent of any wrongdoing, asserting his “complete extraneousness to the alleged actions”. He explains that he decided to quit “in the interest of the ASI’s international prestige” and in order to “better defend my uprightness, respectability and prestige”.
According to Rodolfo Guzzi, a former ASI director, the agency essentially stopped funding basic research during Saggese’s presidency. He says that of the agency’s roughly €100m budget for domestic activities, all bar a few million was awarded to commercial enterprises, whereas previously a substantial fraction of the money had supported projects at research institutes and universities.
That funding will now remain blocked until a new president is appointed, Guzzi adds. Although that should not lead to any of the ASI’s roughly 200 employees being laid off, it might, he points out, cause industry to cut back on personnel. Aldo Sandulli, a professor of administrative law from Suor Orsola Benincasa University of Naples, was appointed ASI commissioner – a temporary position – in an interim basis on 12 February. Carrozza has set up a selection committee to provide her with a short list of candidates for the presidency.
In addition to Saggese, the other suspects include a brother and a sister who are both employees of Finmeccanica and are based at the ASI, as well as the parents of the pair, who are the majority shareholder and administrator of a Turin-based company awarded contracts by the agency. Another two individuals are also under investigation and they work for ASI supplier companies – one in a travel agency that organizes holidays for the agency’s employees and the other for a firm that provided Saggese with a re-chargable credit card. Prosecutors are also looking into the activities of a number of consultants to the ASI, including the wife of a Finmeccanica manager who is reported to have earned €15,600 over six months for her “psychological support” to agency employees.
China’s first lunar rover, Jade Rabbit, has woken up after a two-week shutdown, but problems remain to get the probe fully operational. There were initially conflicting reports about the status of the mission after the English-language website of the state-owned China News Service reported that Jade Rabbit “could not be restored to full function as expected”. However, China’s official Xinhua news agency then said that mission control was still working to fix “control abnormalities”, and that the rover “can be saved”.
Jade Rabbit was launched on the Chang’e-3 probe on 2 December 2013 from the Xichang Satellite Launch Center in Sichuan province. The rover, which is expected to travel about 10 km over the surface of the Moon for a period of three months, is around 1.5 m long, 1 m wide, 1.1 m high and weighs 140 kg. In ancient Chinese mythology, Chang’e is the Chinese goddess of the Moon and Jade Rabbit was her pet. Chang’e-3 follows on from China’s two successful lunar orbiters – Chang’e-1 and Chang’e-2 – which launched in 2007 and 2010, respectively.
Jade Rabbit carries a camera, radar plus infrared and X-ray spectrometers. The main mission of the rover is to survey the Moon’s surface and geological structure. It will look for natural resources and take 3D images, as well as obtaining infrared spectra and analysing the lunar soil. The probe is also carrying a telescope and an ultraviolet camera to observe the universe and the plasma sphere around the Earth.
However, after initially taking some images of the Moon’s surface, on 25 January Jade Rabbit experienced mechanical problems. These were apparently related to the probe’s process for shutting down for the lunar night, which lasted more than two weeks and where temperatures plummet to –180 °C.
Upon waking up last month, Xinhau reported that the probe was “alive” and receiving signals from Earth. “It’s awake. We have a signal,” China National Radio quoted Pei Zhaoyu, a spokesman for the lunar-probe programme. “But the problem still hasn’t been resolved.” It remains unclear how long it will take to fix the problems and if the probe will ever be fully operational again.
It’s ice cold outside (–16 °C the last time I checked), but Chicago is still a hot ticket for scientists this week as the capital of the American Midwest prepares to host the 2014 meeting of the American Association for the Advancement of Science (AAAS).
As usual, there are plenty of fascinating talks planned for the meeting, which runs from today through Monday. Looking through the schedule just now, I’m pretty sure I could fill all five days with seminars on scientific entrepreneurship, policy and communication – although if I did, I’d miss out on some great physics topics such as dark-matter detection, quantum cryptography and next-generation materials for batteries. Which would be a shame.
I’ll be posting regular updates throughout the conference here on the physicsworld.com blog, and I’ll also be live-tweeting a few of the talks (only the really interesting ones, I promise) as @DrMLHarris on Twitter. So check back soon for more on the 2014 AAAS meeting.
If you have ever talked with your arty friends about the sense of “beauty” you feel from maths, you may well have been greeted with a sympathetic smile. Perhaps even with jeers of derision. Well, next time you find yourself in that position you will have some scientific evidence to back up what you are saying. A group of researchers in the UK has demonstrated that getting your noggin around an equation can trigger the same part of the brain as staring at the Mona Lisa or listening to The White Album.
In an experiment described in Frontiers in Human Neuroscience, 15 mathematicians were presented with a series of 60 equations and asked to rate them for their beauty on a scale of –5 (ugly), through to +5 (beautiful). The same subjects were then hooked up to a functional magnetic resonance imaging (fMRI) machine and asked to view the same list of equations. It turned out that when mathematicians viewed the equations they had previously rated as beautiful, it triggered activity in a part of the emotional brain associated with the experience of visual and musical beauty.*
“To many of us, mathematical formulae appear dry and inaccessible but to a mathematician an equation can embody the quintessence of beauty,” says Semir Zeki of University College London (UCL), the lead author of the study. “The beauty of a formula may result from simplicity, symmetry, elegance or the expression of an immutable truth. For Plato, the abstract quality of mathematics expressed the ultimate pinnacle of beauty.”
Among Zeki’s colleagues in doing the research project was Michael Atiyah, who shared the 1966 Fields Medal, the most prestigious prize that a mathematician can be awarded.
The formula most commonly rated as beautiful in the study, in both the survey and the brain scan, was Euler’s equation, eiπ+ 1 = 0. Interestingly, this equation was also one of the most frequently cited in a survey conducted 10 years ago by Robert Crease, a regular contributor to Physics World. Crease – who is a philosopher and historian at Stony Brook University in the US – asked Physics World readers to name their shortlists of great equations and to explain their nominations. Respondents described the Euler equation as “filled with cosmic beauty”, “mind-blowing” and “the most profound mathematical statement ever written”.
One of the reasons why people so often hail the Euler equation as the beauty queen of maths is that it links five fundamental mathematical constants with three basic arithmetic operations. In addition to being profound in nature, the Euler equation also possesses an aesthetic that is both simple and elegant. Several great physicists have spoken about the importance of seeking elegance and beauty in mathematics. For example, the British mathematician and physicist Banesh Hoffman said of his friend Albert Einstein: “The essence of Einstein’s profundity lay in his simplicity; and the essence of his science lay in his artistry – his phenomenal sense of beauty”.
Crease put it well in his 2004 article when he wrote: “Great equations change the way we perceive the world. They reorchestrate the world – transforming and reintegrating our perception by redefining what belongs together with what.” So 10 years after Crease’s survey, let us know what you think are the most beautiful equations. Either post a comment below this article, or let us know on Twitter using the hashtag #BeautifulEquations.
*FYI brain aficionados: field A1 of the medial orbito-frontal cortex (mOFC).
An experimental technique called “electron coincidence spectroscopy”, which provides important information about the electronic properties of surfaces, could be coming to a lab near you thanks to work done by physicists in Germany. Wolf Widdra and colleagues at Martin Luther University and the Max Planck Institute of Microstructure Physics in Halle have developed a version of the technique that does not require light from a large-scale synchrotron facility, but rather can be done on a bench top.
The technique involves detecting pairs of electrons that are emitted simultaneously when a photon or an electron is absorbed by a material. It could therefore be useful for studying superconductors and other materials with correlated electrons, which interact so strongly with each other that it is impossible to predict their properties simply by studying the behaviour of individual electrons alone.
Creating and detecting pairs
The researchers’ main challenge in developing their instrument was finding a way to create and then detect enough pairs of electrons to make a meaningful measurement reasonably fast. Simply blasting a sample with a continuous beam of radiation is no good because unrelated electrons can then be mistaken for simultaneously emitted pairs. What Widdra’s team did instead was to deliver the electrons or photons to the surface in short pulses before looking at electrons that are emitted shortly after each pulse is absorbed.
While this can be done in the lab using incident electrons, more useful photon-based experiments are restricted to large synchrotron facilities. Unfortunately, such labs only operate in the required pulsed mode for one or two weeks a year. As a result, doing electron coincidence spectroscopy at a synchrotron involves a lot of effort in setting up and dismantling an experiment for a very limited experimental run.
While the required ultraviolet pulses can be produced on a bench top, the rate had been limited to about a kilohertz, which is not fast enough to complete a measurement in a reasonable amount of time. Widdra’s bench-top system is able to deliver pulses of ultraviolet photons at a rate of 1 MHz by firing intense pulses from an infrared laser at a noble gas such as argon.
The intense electric field from the pulse can cause an electron to be pulled away from an atom before falling back into its orbital. This involves the emission of a “higher-harmonic” photon that is a multiple of the frequency of the photons in the original laser pulse. The team’s set-up produces short pulses of photons with energies in the range 13–45 eV, which are then sent through a monochromator to create a beam at a single photon energy of 30 eV.
To Halle and back
When a pair of electrons is produced, the two particles fly off in different directions and can be captured by two commercial time-of-flight (TOF) electron spectrometers that are arranged at 90° to each other. Each spectrometer has an acceptance angle of 30°, which means that pairs with a wide range of trajectories can be studied. The momentum of each electron is determined from the time it takes to travel from the sample to a position-sensitive detector at the opposite end of the TOF spectrometer – with the stopwatch starting with the arrival of the incident photon or electron pulse.
After calibrating their instrument using ultraviolet pulses at the BESSY II synchrotron, the researchers brought it back to the lab in Halle, where they used their new laser set-up to study the surface of a nickel oxide (NiO) sample. NiO is an ideal sample to test the efficacy of the spectrometer because its electrons are expected to have strong correlations. The team measured the momenta of electron pairs emitted by a NiO surface when illuminated by ultraviolet pulses, then did a similar measurement on a copper sample, which should not harbour strongly-correlated electrons. The study revealed that the energy distribution of the electron pairs from NiO was very different from pairs emitted by copper.
“Our observation is that metals and NiO behave very differently. This implies that our technique allows us to quantify the electron correlation strength,” says Michael Huth of the Max Planck Institute.
Superconductor studies
The team is now using its spectrometer to study other materials as well as making measurements over a range of different photon energies to gain a better understanding of electron correlations. The team expects that the instrument could be used to study the role of electron correlations in a number of different physical phenomena including superconductivity, metal-insulator transitions and long-range magnetic ordering.
Widdra adds that the team is also looking to commercialize its ultraviolet source because it would prove very useful for a wide range of surface-science experiments in addition to electron coincidence spectroscopy.
“It’s an extraordinarily simple set-up,” says Hal Metcalf as he switches on a small laser pointer, creating a bright green spot about 2 mm in diameter on a wall 10 m away. He then clamps an upright nail to a stand and puts a magnet on its head, before carefully suspending a ball bearing from its tip.
Placing this stand between the laser and the wall, Metcalf adjusts the beam to hit the ball bearing. Its shadow is now surrounded by a glowing green halo, the whole resembling a miniature solar eclipse. Except for one thing: in the dead centre of the shadow is a green spot, glowing as brightly as if the ball were not there. Unbelievable!
A pioneer of laser cooling and a distinguished teaching professor at Stony Brook University, Metcalf gives this demonstration in his third-year optics course and in the university’s Laser Teaching Center (LTC). He loves it. “There’s no tricks. No lenses, no mirrors, nothing! Just a laser beam and small ball bearing.”
It is one of several demonstrations that he and LTC director John Noé use to motivate students. Metcalf and Noé do them without using mathematics, until the students get curious enough about the mysterious happening to ask how to describe it. The ensuing conversations usually go like this:
Metcalf: “It’s easiest not to use English for the description but mathematics.” Student: “Really? What do I need?” Metcalf: “Well, differential equations or matrix algebra or calculus…” Student: “That’s all?”
“You have to motivate students to want the maths,” Metcalf adds. “I hate it when I hear, ‘This happens because it must satisfy that equation.’ No it doesn’t. This happens; that equation describes it.”
But this demonstration – I’m not going to name it, for reasons I’ll discuss – is not just a dramatic teaching aid. It is also an instructive episode in the ambiguities of discovery.
Fresnel, Poisson, Arago
At the start of the 19th century, the prevailing theory of light was Newton’s “corpuscular” or particle theory, according to which light travels in straight lines. But in about 1807 the British scientist Thomas Young demonstrated the wave-like nature of light through its interference effects. Opinion over the true nature of light was divided, not least among members of the French Academy of Sciences, most of whose members championed particles.
At the time, the academy held periodic competitions in a kind of miniature “grand challenge” series whose aim was to clarify controversial matters. And in 1818 it declared that diffraction would be the topic of the competition for the following year.
Enter Augustin-Jean Fresnel. In 1818 Fresnel was supporting himself as an engineer in Rennes, but seized every opportunity to travel to Paris to craft a wave theory of light inspired by Young’s observations. He developed a way to calculate the net effect of a set of waves by resolving each wave into two components, adding the components and combining the results. Barely making the deadline, Fresnel entered the academy’s competition with an essay proposing a theory that, he claimed, could allow the light intensity at any point behind a diffracting object to be calculated.
The committee charged with judging the competition was, however, dominated by partisans of the particle theory, including Siméon-Denis Poisson, who were sure Fresnel’s theory was flawed. In fact, Poisson noticed what seemed to be a show-stopper. According to Fresnel’s work, if light were shone on a circular obstruction, a bright spot would appear in the centre of the shadow, as bright as if the obstruction were not there at all. Obvious nonsense! Not only that, Fresnel’s equations indicated that light shining through a circular hole could produce a dark spot in the middle.
The committee’s head was, however, François Arago – one of the few French scientists besides Fresnel acquainted with Young’s work, and therefore able to appreciate Fresnel’s contributions. Arago carried out the experiment with a flame, filters and a 2 mm metal disc attached to a glass plate with wax. To everyone’s surprise, and Poisson’s chagrin, Arago observed the spot and Fresnel won the competition.
The episode was deeply satisfying to Fresnel, even if he had little patience with mere praise. “All the compliments that I have received from [committee members] Arago, [Pierre] Laplace and [Jean-Baptiste] Biot,” he wrote to Young a few years later, “never gave me so much pleasure as the discovery of a theoretic truth, or the confirmation of a calculation by experiment.”
If the demonstration is so simple, I asked Metcalf, why wasn’t it discovered earlier in things like eclipses? “The Moon’s not nearly round enough,” he snorted. “All those mountains! The Sun’s not a point source of coherent light. People didn’t always have laser pointers.”
The critical point
The episode illustrates the ambiguities of discovery. Who’s the discoverer? Fresnel, who produced the original framework? Poisson, who showed the spot was a direct consequence but was firmly convinced that it didn’t exist? Arago, who did the experiment? Moreover, two other scientists turned out to have noticed the spot a century earlier but did not know what to make of it.
What about the French Academy, whose actions set the discovery in motion? Didn’t Young play a role? Even Newton? Moreover, the spot is just an illustration of a more general phenomenon that complementary obstruction patterns produce complementary diffraction results, described by Jacques Babinet’s theorem.
To pick out any one person, or combination, may be useful in education, in naming the phenomenon, or in dishing out awards. But philosophically, it’s sloppy – like designating the most valuable player in a sports competition as the person who won it. The rigorous answer to the question “Who discovered that spot?” is the entire scientific community.
It was back in 1982, during his PhD, when Clive Speake first understood the true nature of gravity. “It was amazing,” he recalls fondly. “I remember going out the night I had done the experiment for the first time, and I just looked up at the Moon. It had given me a completely different feel for what the Moon is, you know? Why it’s there.”
Such epiphanies are not uncommon among those who perform measurements of the gravitational constant. Gravity is the most famous of nature’s forces, because it is the one that is most obviously present in our lives. Ever since Isaac Newton was inspired by a falling apple, everyone has known that it is gravity behind the inevitable phrase “what goes up, must come down”. Yet despite our familiarity with gravity, few of us have experienced the force other than when it is directed towards the ground beneath our feet.
To see why, you need only look at the numbers. Gravity is the weakest force – 1036 times weaker than electromagnetism, the force that governs most other everyday phenomena. The only reason we can feel gravity on Earth is because it scales with mass: our planet’s mass of five zetta-tonnes (5 × 10²¹ tonnes) is enough to bring gravity into the realm of normal human perception. But the force still exists between all other objects, and if you do ever witness it with Earth out of the equation – for example, in the faint shift of two suspended metal weights – it might at first seem like magic. “It’s a liberating experience,” says Speake, who is now based at the University of Birmingham in the UK.
Liberating – and infuriating. The gravitational constant – “big G”, as it is commonly known – is what characterizes the strength of gravity according to Newton’s law, and it is fiendishly difficult to measure. Experiments struggle to deliver uncertainties much smaller than one part in ten thousand – compare that, for instance, with the proton–electron mass ratio, which is known to four parts in ten billion.
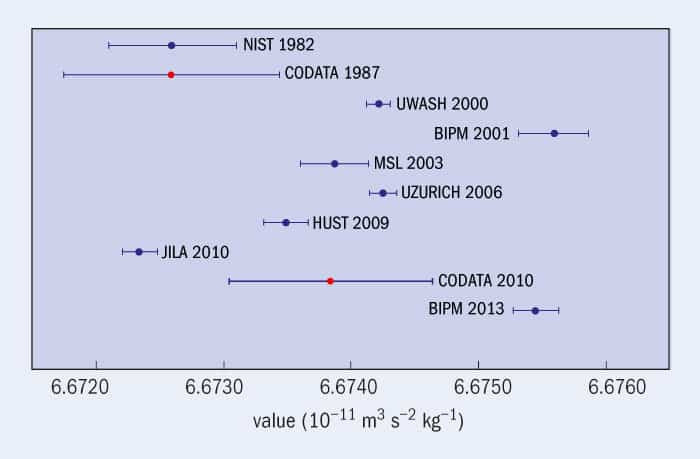
1 Disagreeing over “big G” This chart shows wildly differing values of the gravitational constant, G, as measured by various high-profile research groups (blue). The values do not agree even within their error bars. Also shown are two values of G adopted by the Committee on Data for Science and Technology (CODATA) as international standards (red). The groups are based at the National Institute of Standards and Technology (NIST), the University of Washington (UWASH), the International Bureau of Weights and Measures (BIPM), the Measurement Standards Laboratory of New Zealand (MSL), the University of Zurich (UZURICH), the Huazhong University of Science and Technology (HUST) and the Joint Institute for Astrophysics (JILA).
Low precision alone is enough to keep a metrologist up all night. But in recent years, a much more serious problem has arisen: measurements of big G are in wild disagreement with one another (figure 1). Since the turn of this century, values recorded by some of the best labs in the world have been spread apart by more than 10 times their estimated uncertainties. Something is amiss – yet no-one is quite sure what. “You go over it, and over it, and over it,” says Speake. “And there comes a time when you say, I just can’t think of anything we’ve done wrong.”
A massive task
On the face of it, an experimental determination of big G should be straightforward. Newton’s law states that the gravitational attraction between two bodies is proportional to the product of their masses, and inversely proportional to the square of the distance between them (F = Gm1m2/d2). To generate the biggest force possible, therefore, one needs very big masses, very close together.
Of course, there are various other considerations. The masses ought to be made of homogenous materials, for instance, so that their centres of mass can be accurately located. It is also prudent to keep the apparatus small and seal it in a container, to avoid convection currents generated by temperature changes. But the biggest consideration is so-called “little g”: the last headache an experimentalist needs is to measure not only the gravitational force between their test masses, but also the Earth’s own gravitational pull.
In 1798 the British scientist Henry Cavendish famously evaded the little-g problem using a torsion balance he had inherited from the geologist John Michell (see “The saga begins”). A torsion balance consists of a vertical wire attached at its bottom to a horizontal beam, suspended on the ends of which are two known “test” masses. On either side of these a pair of larger, “source” masses is suspended separately. Once rotated a little from their starting position, these source masses cause the test masses to rotate due to gravitational attraction. Crucially, this rotation is perpendicular to – and thus unaffected by – the Earth’s own gravitational pull, because the masses all hang vertically.
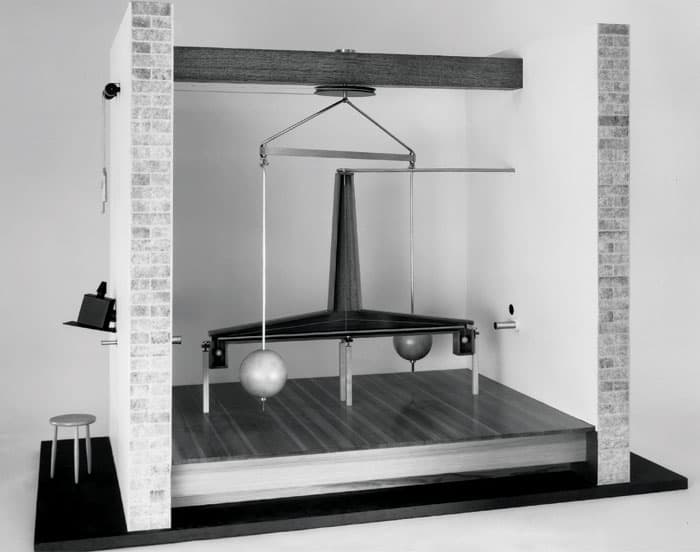
The saga begins Henry Cavendish, in 1798, was the first to measure the force of gravity between masses in the laboratory. This scale model shows his torsion balance, which measures the angular torque due to two gravitationally attracting masses. (Courtesy: Science Museum/Science and Society Picture Library)
The rotation of the test masses twists the central wire, which in response exerts a restoring torque; at some angle, this torque matches the masses’ gravity. By measuring this angle and knowing the torque generated for a given angle, Cavendish could estimate the gravitational force. Due to older unit conventions, Cavendish did not turn this into a value for big G, but his result is easily expressed in that form.
After Cavendish’s experiment, not much changed in 200 years – at least in terms of basic apparatus. There were modifications, such as the use of vacuum cans to exclude air resistance, and the use of materials with low susceptibilities to avoid magnetic effects. But by the early 1980s, physicists believed they had honed the torsion-balance technique so well as to settle on big G’s true value: an experiment performed by Gabriel Luther and William Towler at the US National Bureau of Standards (now known as the National Institute of Standards and Technology, or NIST) in Washington, DC, gave big G as 6.673 × 10⁻¹¹ m3s–2kg–1 to within 75 parts per million (ppm) – a value that was subsequently adopted by the Committee on Data for Science and Technology (CODATA), which provides the internationally accepted values of the fundamental constants.
A second opinion
For about a decade, all was well. Then in the mid-1990s Winfried Michaelis and others at the Physikalisch-Technische Bundesanstalt (PTB) in Braunschweig, Germany, published what they believed to be a more reliable determination of big G. In place of a torsion wire they used a low-friction liquid bearing, the torque of which could be imposed electrically. The researchers calculated a value for big G of 6.715 × 10⁻¹¹ m3s–2kg–1 – a whopping 50 standard deviations greater than the CODATA value.
Either CODATA or the PTB group was wrong, but which? The problem with absolute measurements is that there is no default answer to fall back on. This is unlike null experiments, in which experimentalists look for a deviation from zero to see whether or not some effect is present – an example being the LIGO team in Washington state and Louisiana, US, which is patiently waiting for the appearance of laser interference that would signal the first direct detection of a ripple in space–time, or gravitational wave. “Most of the very precise experiments are null experiments – or differential measurements, where you’re measuring the difference between two things,” says Stephen Merkowitz at NASA’s Goddard Space Flight Center in Maryland, US. “But absolute measurements are very hard, because of all the calibrations involved.”
Merkowitz was one of many physicists who, in the wake of the PTB discrepancy, decided to measure big G for themselves. Working then at the University of Washington in Seattle, US, he and his colleague Jens Gundlach came up with an alternative design for a torsion balance in which a torsion pendulum and its associated test masses are rotated continuously on two separate turntables. The acceleration of the inner turntable holding the torsion pendulum could be adjusted to keep the torsion wire itself from twisting. Then, by monitoring the feedback to the inner turntable, the researchers could read off the gravitational force from the circling test masses and thus determine a value for big G.
Part of the appeal of this apparatus was that there could be no errors deriving from wire properties – particularly “anelasticity”, in which a wire’s stiffness changes with the frequency of twisting. As a result, Gundlach and Merkowitz could record an uncertainty of just 14 ppm. And yet, prior to their publication in 2000, they still had doubts. “We worried a lot,” says Merkowitz. “Were we forgetting something? And it’s true, we could have.”
Actually, there was good reason to worry. While their value for big G was lower than the PTB group’s, it was still far beyond the error bars of the official CODATA value. And further experiments did not clear up the situation. The next year, a group at the International Bureau of Weights and Measures (BIPM) in Sèvres, France, led by Terry Quinn and including Speake – who had retained a keen interest in precision tests of gravitation since his PhD work – measured big G using two different methods. They performed a torsion-balance experiment using both Cavendish’s technique of measuring the maximum angular deflection, and a new “servo” method in which the masses’ gravitational attraction is balanced by a measured electrostatic torque, such that the torsion balance does not move. Despite the combined result having a small uncertainty of 41 ppm, its value was 200 ppm above Gundlach and Merkowitz’s.
At least half a dozen other experimental groups had a go. In 2006 Stephan Schlamminger and colleagues at the University of Zurich in Switzerland found a similar value to the Washington group. But in 2010 Harold Parks and James Faller at JILA, an institute shared between NIST and the University of Colorado in Boulder, found big G to be 280 ppm below the Washington group’s – though oddly in line with the original CODATA value. The irony was that, by this time, the outlying PTB value that instigated the rush of these new measurements had been written off as a result of some stray capacitance.
Gaining support
Ask the group members what the true value of big G is, and they all have confidence in their own measurements. But then they all speak highly of the other determinations, too. “It’s always difficult if you ask an experimentalist,” says Schlamminger. “They’ll say, ‘I know the true value of big G because I measured it!'”
Some would argue that the most reliable measurements are those that have been corroborated. Schlamminger and colleagues’ value, which agrees with the Washington group’s, has the distinction that it was based on a very different method, involving a beam balance. Used, for instance, by pharmacists, a beam balance consists of a sealed box containing a mass pan, which can measure weights to very high precision.
Schlamminger and colleagues modified their beam balance so that each of the two test masses could be hung from it: the first two metres below, and the second four metres below. This separation allowed the researchers to place two huge, 500 litre tanks of mercury either between the test masses, or above and below them. By measuring the weight differences between the test masses with the mercury tanks in each position, the researchers could extract a value of big G to within 16 ppm that was consistent with the Washington group’s.
The corroboration was looked upon favourably by CODATA, which in 2010 issued a new official value for big G that was close to the Zurich and Washington groups’ values, although with large error bars. To some in the gravity community, it seemed as though a new consensus was finally taking shape.
It wouldn’t last long. Quinn, who had retired as director of the BIPM in 2003, had already persuaded his old lab to support another big G experiment, to see whether his group’s abnormally high result using two different methods had been a fluke. When they accepted, he didn’t hang around. “I devoted almost all my time to it,” he says. “You just ask my wife; she was not very pleased.”
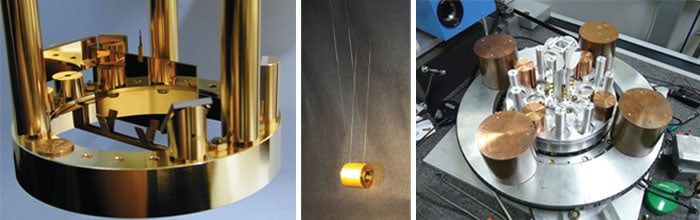
Measuring up Torsion balances are still used to measure “big G” – and shown here are the University of Washington group’s pendulum hanging on a torsion wire (left) and an overall view of the BIPM team’s partly dismantled apparatus (right). Meanwhile, the JILA team’s experiment (centre) measured the displacement of small hanging pendulum masses as a result of the gravitational field from large, adjacent source masses. (Courtesy: Stephen Merkowitz/University of Washington; James Faller/JILA; Terry Quinn/BIPM)
Between 2003 and 2007, Quinn, Speake and colleagues rebuilt almost all their apparatus. They executed an unprecedented number of checks and calibrations, which involved calculating the gravitational influence of every component, down to the last screw. Again, they calculated big G using both the Cavendish and servo method, to exclude a majority of systematic errors. But their result, published last September, was a shock: it was almost exactly as high as before (Phys. Rev. Lett. 111 101102).
The situation now among big G experiments is a spread of values that scarcely overlap. Which raises the question: what will CODATA do when it meets again this August to assess the values of the fundamental constants? “The answer is, I don’t know,” says Quinn. “I have to say, I am a member of the CODATA panel that evaluates this, but I shall have to leave the room when they talk about it.”
Human error
Could some sort of new physics be to blame, in which, for example, the value of big G changes depending on location in space–time? Few researchers think so: the spread of values is too inconsistent to suggest a new force is at work. But some have pointed to a phenomenon that could explain the discrepancy: intellectual phase-locking – or, in simple terms, seeing what you want to see. “People might say, ‘Terry, you were an experimentalist in both of these [BIPM experiments],'” says Quinn. “‘Did you somehow arrange it that you got the same answer?’ Well, maybe I did – but we tried to take steps to avoid that.”
Those steps were, essentially, to keep each of the different input parameters under wraps until the last minute, so that it would be impossible for any of the BIPM experimentalists to pre-empt the final value. And Quinn’s group was not the only one concerned about such a possibility. “A lot of groups lose sleep in the run up to publishing a value,” says Merkowitz. “Even if it agrees with another group’s, you think: are we just stopping our analysis now, because it agrees? Or do we need to keep digging, looking for something else? Because you’re never sure what the real value is.”
Faller believes intellectual phase-locking is impossible to rule out. “Physicists don’t like to get the wrong answer,” he says. “You look over your shoulder, and you think, ‘Oh my God! The last five people who measured it got a number that was higher than my group! What did I do wrong?’ That’s not the way to do science – but it is the way real people do science.”
Even if intellectual phase-locking has biased some values, it has not prevented the overall discrepancy, and it is for this reason that most of those involved assume that the systematic errors have not all been taken into account. Speake quotes the former US defence secretary Donald Rumsfeld, who famously said there are “known unknowns” and “unknown unknowns”. Unfortunately, each of the groups is confident its error bars are allowing for these unknowns. “I feel like we’ve got it right,” Speake says. “But I can’t point a gun at the other people and say, ‘You’ve got it wrong.’ Because I don’t know enough about their experiments.”
For that, journals could be partly to blame. Physical Review Letters, the journal in which most big G results have been published, usually limits papers to four pages; by comparison, Cavendish’s original torsion-balance paper is 57 pages long. Many of those in the gravity community believe they have not had the opportunity to properly pick apart one another’s techniques.
Fortunately, that opportunity may have finally come. This month, the Royal Society will convene a meeting at Chicheley Hall in Newport Pagnell, UK, of most of those involved in the recent measurements of big G. The hope is that the meeting will allow the metrologists to decide on the most likely sources of systematic error and, ideally, think up an experiment that would avoid them. Many of those contacted by Physics World revealed they already have ideas for new experiments – although they were not necessarily keen on performing them themselves. “I say you should never do the same experiment twice,” says Schlamminger. “I mean, what would you do if you contradicted yourself?”
Yet like most metrologists who have tried to determine big G, Schlamminger refuses to give up the challenge. “It’s difficult to measure it – that’s why I want to measure it,” he says. “You know, why do people climb Mount Everest? Because it’s difficult.”
Scientists at the Lawrence Livermore National Laboratory (LLNL) in California have achieved a “fuel gain” of greater than one at the National Ignition Facility (NIF). Using NIF’s ultra-powerful laser to crush tiny pellets of deuterium–tritium fuel, they have produced more energy from fusion reactions than was deposited in the fuel. Although still far from the long-sought-after goal of “ignition”, the latest results are nevertheless an important step on the road to realizing fusion energy, say researchers.
NIF was completed in 2009 at a cost of $3.5bn and uses 192 laser beams to deliver 1.8 MJ of energy to a tiny target over a period of just a few billionths of a second. The target consists of a hollow gold cylinder a centimetre long, known as a hohlraum. At its centre sits a peppercorn-sized sphere of frozen deuterium and tritium encased inside a plastic shell. Laser pulses heat the inside of the hohlraum thereby generating X-rays that rapidly remove or “ablate” material from the outside of the shell, so causing the fuel to implode. This implosion creates a shock wave that heats up the fuel to temperatures of about 50 million degrees Celsius, causing the nuclei to overcome their mutual repulsion and fuse, producing alpha particles (helium nuclei) and neutrons.
Between 2009 and 2012, researchers at NIF worked on a project designed explicitly to achieve ignition, the point at which heat provided by alpha particles increases the rate of fusion reactions such that they release more energy than is supplied by the laser. However, that work proved to be disappointing, leading to energy outputs about 1000 times smaller than the input. After scrutiny by Congress, the National Nuclear Security Administration, which oversees NIF, announced a new, more deliberative strategy designed to work out what went wrong. The strategy also emphasized the importance of alternative approaches to “inertial-confinement fusion”, such as “fast ignition” and “Z-pinch”.
On new footing
In the latest work, Omar Hurricane and colleagues at the LLNL have upped NIF’s output by changing the shape of the facility’s laser pulses. Previously, the pulses were of the “low-foot” variety, which means that the X-ray energy delivered to the target remained relatively low for most of the pulse duration before rapidly increasing. The idea was to compress the fuel to the highest possible densities to maximize fusion reactions. Unfortunately, however, this approach caused the plastic shell surrounding the fuel to break up, so reducing the pressure inside the fuel and limiting the output energy.
The laser pulses in more recent “high-foot” experiments were instead shaped to supply more energy earlier on in the compression process. This allows more heat to be delivered to the fuel before it has had a chance to compress significantly. This limits the total compression that can be achieved because more work needs to be done on the fuel to achieve a certain density, just as a tyre becomes harder to squeeze when it is pumped up using hot air. However, the virtue of this approach is that it yields a much more stable implosion. Indeed, by limiting their ambition, the researchers have managed to get more energy out of the fuel.
In a paper published in Nature, Hurricane and colleagues report results from experiments carried out last September and November – the former producing 14 kJ of fusion energy from a single laser shot and the latter 17 kJ. The researchers point out that since the energy delivered to the fuel is about 10 kJ, both shots generated a fuel gain. They also calculated that as much as half of the energy output from these shots originated in alpha-particle heating. This is significant because such heating is a prerequisite for ignition.
Agreement with computer models
Team member Paul Springer adds that a more recent shot, carried out after the team had submitted its paper, generated about 26 kJ of energy, most of which the researchers believe came from alpha-particle heating. Another plus point from the latest work, says Springer, is the fact that the results are similar to predictions from computer simulations. A close match between experiment and modelling, he notes, is particularly important if NIF is to fulfil its number-one objective: helping to maintain the US’s stockpile of nuclear weapons without testing.
Robert McCrory, director of the Laboratory for Laser Energetics at the University of Rochester in upstate New York, sounds a cautious note, however. Like other researchers working on fusion, he says it is not yet clear whether NIF will be able to achieve ignition, arguing that “the latest results are probably about as far as this high-foot approach can be pushed”. While he “applauds the current result”, he adds that “we must wait and see if we can achieve the understanding required to not only get ignition, but robust reliable gain from a fusion target”.
Indeed, the NIF researchers recognize that uncertainties lie ahead. Group member Denise Hinkel cites an analogy between the quest for ignition and climbing cloud-covered Mount Kilimanjaro in Tanzania. “As you go up, you know that you are getting closer to the summit,” she says, “but you don’t know how close. That is also true with ignition.”
Steep climb to ignition
Although the researchers have demonstrated fuel gain, it needs to be further increased by about a factor of 100 to achieve ignition. Springer points out that most of the energy from the laser in fact goes in heating up the hohlraum and the plastic shell. He and his colleagues are now studying hohlraums that generate more spherically symmetrical, and therefore more efficient implosions, as well as improved shell materials. “The less plastic you use, the faster the fuel will implode,” he explains. “But you have to have some plastic because otherwise you will ablate the fuel. There is a balance to be struck and we haven’t struck it yet.”
Steve Cowley, director of the Culham Centre for Fusion Energy in the UK, points out that the rival “magnetic-confinement” approach to fusion that will be studied in the ITER project under construction in France has already approached energy breakeven. Indeed, in 1997, Culham’s JET reactor had already generated 16 MW of power from an input of 24 MW. But he believes that both approaches to fusion energy must be pursued. Arguing that the research by Hurricane and colleagues “begins to get at the core problems that NIF has”, he says that “we have waited 60 years to get close to controlled fusion. We are now close in both magnetic- and inertial-confinement research. We must keep at it.”
Materials research is enjoying a new golden age. The hit parade of supermaterials that has been discovered in the relatively recent past is extensive. It includes the likes of high-temperature superconductors, quantum dots, bucky-balls, nanotubes, aerogels, silver nanowires and graphene. Meanwhile, new approaches to the commercialization of materials – such as the recent Materials Genome Initiative in the US – are improving the processes by which new materials are transferred from the science lab to practical applications in the real world.
In conjuction with these new discoveries, materials scientists have also made dramatic improvements to the tools they have available for studying and manufacturing materials. Here, the list of advances is seemingly endless. Researchers can now simulate, image and analyse materials with far more accuracy than ever before. Developments in production methods – such as the advent of 3D printing – are also enabling researchers to scale up their new materials with greater ease.
To reflect these rapid developments in materials science, IOP Publishing – which also publishes Physics World – has recently launched three new journals.
The first is Materials Research Express (MRX), which publishes papers on new experimental and theoretical research on the design, fabrication, properties and applications of all classes of materials. Its editor-in-chief is Meyya Meyyappan, who is director of the Center for Nanotechnology at NASA Ames Research Center. Introducing MRX in this video, he says that the new journal will “provide an attractive combination of very fast peer-review, scientific rigour and complete article-length flexibility”.
Another journal recently launched by IOP Publishing is 2D Materials(2DM). The publication covers all aspects of graphene and other related 2D materials. Again, the journal is placing a strong emphasis on being interdisciplinary – by covering physics, chemistry, engineering and biology – and considering everything from fundamental science to novel applications. In the video below, 2DM is introduced by two members of its editorial board, Tony Heinz of Columbia University and Luigi Colombo of Texas Instruments Inc.
The final member of this trio of materials journals is Translational Materials Research (TMR). This new type of publication will look at the process involved in taking materials research from the science lab to the commercial marketplace. “Translational Materials Research will make connections across the innovation chain to bridge the so-called valley of death between fundamental research and commercial success,” says the TMR editor-in-chief, George Grüner. There’s no video profile yet for this journal, but for the latest updates check out the TMR+ blog.
Oh, and if you are still wondering precisely what is meant by the “valley of death”, have no fear. Later in the year we will be publishing a special issue of Physics World devoted to this topic.
A new type of fibre laser that operates in the mid-infrared range has been designed by researchers in Australia. The device uses a dual-wavelength pumping approach that makes it 25 times more powerful than existing fibre lasers operating at mid-infrared wavelengths. The new design also makes the laser cheaper to produce than others and the device could have a variety of applications – from atmospheric analysis to non-invasive medical diagnosis.
Many common hydrocarbon molecules absorb light in the mid-infrared range, and therefore a cheap and convenient source of laser light in this part of the spectrum could have a variety of practical applications. The greenhouse gases methane and ethane, for example, could be remotely detected with mid-infrared laser radar systems. Such lasers could also be used in medical diagnoses to detect trace gas concentrations in exhaled breath that are symptomatic of some diseases and metabolic processes. The presence of acetone on the breath, for example, is associated with diabetes. Similarly, formaldehyde can be indicative of breast cancer and varied concentrations of carbonyl sulfide can offer clues to the health of the liver.
Also in a medical vein, it is believed that mid-infrared wavelengths could be beneficial to laser surgery, because they might be less destructive, resulting in less scarring. Furthermore, such lasers could also have a variety of defensive military applications – from active illumination for thermal cameras to jamming the detectors on board heat-seeking missiles, which operate in the 3–5 μm atmospheric window.
Bulky and expensive
The problem, however, is that practical lasers operating at these wavelengths have been very difficult to produce. Crystal lasers tend to be expensive and bulky. On the other hand, fibre lasers have their own problems. Traditionally, fibres are based on silica, which is opaque in the mid-infrared, necessitating the use of more exotic glass fibre. ZBLAN, a type of heavy metal glass based on zirconium fluoride, is commonly used for this purpose.
To make matters worse, mid-infrared transitions in rare-earth ions (such as erbium, used in this study) are located high above the ground state – resulting in a low overall efficiency, thanks to the difference in wavelengths between the emitted laser photon and the input pump photon. The relaxing ions also tend to get stuck in relatively long-lived excited states on their way back down to the ground state – with this forming a “bottleneck” that can lower efficiency at best, or prevent further lasing at worst.
Dual-pumping approach
To overcome these problems, the University of Adelaide researchers actually took advantage of the bottlenecking phenomenon. They used a dual-pumping approach that uses a relatively weak pump source to excite the ions to the low, long-lived excited state. Then a second pump raises them further to the most excited level.
When the ions subsequently relax to the long-lived state – emitting a photon as they do so – they can then be pumped up again, without delay. “This method allowed an order of magnitude improvement in efficiency compared to other fibre lasers operating on this transition,” says lead author Ori Henderson-Sapir, a researcher at the University of Adelaide. The team’s laser produces more than 0.25 W at wavelengths around 3.5 μm, with a significant peak in emissions at 3.6 μm. “To the best of our knowledge, [this is] the highest power, highest efficiency and the longest wavelength of a room-temperature fibre laser without using nonlinear effects,” he explains.
“This work represents a step forward for the creation of long-wavelength fibre lasers,” says Darren Hudson, a physicist at the University of Sydney, who was not involved in this research. “By optimizing the laser cavity, the authors were able to increase the slope efficiency of this laser to 18%, which represents a great improvement over the previous result of 3%, which was achieved using a single 655 nm pump laser.”
High-powered future
Hudson notes that another significant advantage of the two-pump process comes in its reduced cost – with the two smaller pump lasers costing less than one larger pump. He cautions, however, that current power output of the laser would be too low for laser surgery or many defence applications, but that the inherent scalability of fibre systems should allow greater powers to be developed in the future.
Having demonstrated the basic principle of their dual-pumped design, the researchers are now working on developing the capacity to tune their laser’s output wavelength. Their current aim is to create a system that is tunable between 3.3–3.8 μm. This would make it sufficient to enable the simple detection of various hydrocarbons for environmental and medical applications.