The task was simple but painstaking: to identify the shapes of over a million galaxies from images taken from the Sloan Digital Sky Survey. To help with the arduous task, in 2007 the astronomer Chris Lintott – together with astrophysicist Kevin Schawinski, both from the University of Oxford – set up a website called Galaxy Zoo that presented users with images of galaxies to classify. The pair hoped to initially get around 50 local amateur astronomers to help out, calculating that it could take around five years to trawl through the complete data set.
It took just three weeks – not because the amateur astronomers were unexpectedly quick but because thousands of people from all over the world flocked to the site to offer their help as extra pairs of eyes. At its peak, more than 70,000 galaxies were being analysed per hour, and in the first year of the site 50 million galaxies were classified by 150,000 people, who together made Galaxy Zoo the world’s largest database of galaxy shapes.
The instant success of Galaxy Zoo led to a plethora of similar “citizen-science” initiatives and Lintott is the driving force behind the resulting “Zooniverse”. Set up in 2009, this collection of online citizen science now boasts around 20 separate projects with tasks that range from searching for planets outside our solar system by analysing data from NASA’s Kepler spacecraft to helping marine scientists better understand whale communication. “I am surprised by how successful it has all been,” Lintott told Physics World. “And how many other people can say they have discovered a new planet in their spare time?”
The citizen scientist
Modern citizen science dates back to the late 1990s when the University of California, Berkeley released SETI@home – a computer program that analysed radio signals from the Arecibo radio telescope in Puerto Rico to look for signs of intelligent life in the universe. The program ran in the background on idle computers using each machine’s processing power when it was not needed. However, SETI@home only involved users installing the software; they did not analyse any data.
That all changed in August 2006 when NASA set up Stardust@home, which allowed volunteers to examine images taken by the space agency’s Stardust probe for evidence of tiny interstellar dust impacts in a set of aerogel blocks that the probe exposed in space. At its peak, some 20,000 users participated in Stardust@home and it was this project that inspired Lintott to set up a similar endeavour to analyse galaxy types, recognizing that in both tasks humans can easily outpace computer algorithms, which find it difficult to recognize patterns. So, in Galaxy Zoo’s case, when it comes to deciding whether a galaxy is elliptical or spiral – and, if spiral, whether it is rotating in a clockwise or anticlockwise direction – there is nothing better than the human eye.
If you have a pile of data, work with us and get people to help out
Four years on from its first project, Zooniverse is now a roaring success, with more than 860,000 volunteers taking part and more than 50 published papers – all based on the work of Zooniverse’s users, or “zooites”. In many cases, Lintott says that Zooniverse projects stemmed from requests from other scientists about how to get the public to help them analyse their data. Although he admits that such crowdsourcing fits some areas of science better than others, Lintott says that more scientists should think about how their research can be used as part of a citizen science project. “If you have a pile of data, work with us and get people to help out,” adds Lintott, who in February became the main presenter of the BBC TV programme The Sky at Night following the death of the show’s long-running presenter Patrick Moore.
Demystifying science
Someone who has adopted Lintott’s approach is Michael Doser, a particle physicist at CERN, who is working on an experiment called AEgIS that investigates how hydrogen and antihydrogen respond to gravity. The experiment works by plotting the trajectory of particles on a photographic emulsion plate, and it is currently only operating with protons and antiprotons, which are too light to measure the effect of gravity. Doser has just created software to test whether crowdsourcing could benefit the experiment by letting users – rather than computer algorithms – trace the direction of particle tracks. “I have been following Zooniverse with envy and admiration,” says Doser. “The Zooniverse projects not only share the fascination of doing science, but also unlock the deep desire to participate in science of many people who do not have the chance to do so in their daily work.”
Doser adds that such projects have helped to “demystify” science. “Contrary to conventional outreach, citizen science treats the public as an equal partner,” he says. “Involving citizens seems to me a powerful route to increasing scientific literacy.” More than that, citizen science is also making scientists rethink how they work with their data and fostering a new class of budding amateur scientists. “You find that people get really drawn in, start analysing the results and even reading new papers that come up on arXiv,” says Lintott. “You could say they have a career as a citizen scientist.”
One evening a week, Leonard Susskind goes back to basics. In a lecture theatre at Stanford University in California, US, he talks about classical mechanics, quantum theory, relativity and various other topics typical of degree-level physics. But the 100 or so people in the audience do not want a qualification – they are there simply because they enjoy learning.
“I thought I would try it out,” says Susskind, speaking on the phone in his easy New York accent. “And I found it a lot of fun, very stimulating, and very different from teaching a regular university class. People have no interest in degrees, no interest in getting a grade, no interest in getting tested. It’s a very nice way to teach people.”
At 73, Susskind has enjoyed a long career at the forefront of theoretical physics. He is famous for his work on black holes – particularly his “war” with the British theorist Stephen Hawking over the fate of information contained inside them – and for his pioneering work on string theory. Today, as director of the Stanford Institute for Theoretical Physics, he is still very active in research, but that has not deterred him from a burgeoning side project: teaching physics to lay-people.
Of course, outreach is a popular occupation among physicists, as the proliferation of science-as-entertainment events and pop-science books testifies. But Susskind’s project is more formal and has a slightly different purpose. In fact, he says his idea came from meeting people who are frustrated to find that the level of physics explanation in pop-science media often falls short of their expectations. “There’s a subset of people who have enough technical background to know that they’re not understanding,” says Susskind. “They have no venue for learning physics in a real way. Textbooks are dry, textbooks are boring, and to learn completely by themselves is not fun.”
Come one, come all
Seeing room for a new type of physics teaching, Susskind started delivering courses he called the Theoretical Minimum. The “minimum” should not imply that the courses are easy. Rather, the term means that Susskind spends the minimum amount of time on a certain topic (for example, classical mechanics) to proceed to the next (for example, quantum mechanics).
“You know, a lot of people from my generation learned quantum field theory from a little skinny book by a [German] gentleman named [Franz] Mandl,” Susskind explains. “It was the only way to get into the subject at the time, because there were no good textbooks. And I have a very distinct memory of having learned easily and quickly from that. I always wanted to try to reproduce that in other subjects, where you really reduce it to the bare minimum.”
Material in the Theoretical Minimum courses was first published in a well-received book of the same name this year, but undoubtedly most students are learning from videos of the lectures. These are available to watch free online via the course website and on YouTube, where the first lecture on classical mechanics has garnered more than 100,000 views so far.
In the sheer number of people it reaches, Susskind’s project is part of a growing trend for so-called massive open online courses, or MOOCs. Similar to distance-learning courses in decades gone by, MOOCs offer university-level education online to those who might otherwise have no access to it. In recent years, MOOC enrollees have skyrocketed. EdX, a MOOC provider run between Harvard University and the Massachusetts Institute of Technology in the US, has registered more than 1.1 million users since it started up last year. “You have simply a better selection and variety of courses for people to take, and definitely there are more people taking them,” says Dan O’Connell, associate director of communications at EdX.
Many universities are looking to further their reach by offering MOOCs through companies such as EdX. But they have not been without criticism. Opponents of MOOCs point to the very high drop-out rates, and believe that they can encourage students to forgo university itself in favour of a (usually) free and flexible online-learning programme. O’Connell, however, points out that data collected through MOOCs can help improve actual university courses.
Making connections
Susskind is largely oblivious to these arguments – indeed, he did not know what a MOOC was until Physics World contacted him for an interview – although he agrees that there is no substitute for on-campus learning. He has no particular goal for the Theoretical Minimum courses, explaining that he simply finds it fun teaching physics to a diverse set of people, who, he claims, are “more responsive” than those studying for degrees. “Some of these people become my friends,” he adds.
I get huge amounts of e-mail, mostly from outside the US
The most gratifying aspect of the project, though, is the response he has had from those watching his courses online. “Once I put the lectures out there, I started getting huge amounts of e-mail, most from outside the US,” he says. “Pakistan, Iran, China.”
“Every time I open my e-mail there’s another five messages thanking me for putting [the videos] out there, telling me about themselves,” he continues. “Lots of kids telling me they’re 15 or 16 years old and they want to be physicists. They don’t have anybody that can teach them.”
Albert-László Barabási wants to set the record straight. “I consider myself a physicist,” he says, and it is easy to see why. Born in Transylvania to a Hungarian family, he studied physics at the University of Bucharest in Romania and is now a professor of physics at Northeastern University in Boston, US. But at the same time, the versatile Barabási is also a lecturer at Harvard Medical School, and holds appointments in Northeastern’s biology department and its College of Computer and Information Science. “I may have chosen my topics of enquiry a bit more freely from the traditional physics canon,” he admits.
Barabási made his name in 1999 when, with Réka Albert of Pennsylvania State University, he used tools from statistical mechanics to develop a theory describing the origins of “scale-free networks” (Science286 509). These are networks that are held together by a few highly connected nodes, called hubs, like Google on the Web or very popular individuals in social networks. Since then, Barabási has continued to develop and apply these techniques to networks in fields as diverse as biology, computer science, economics and human behaviour. Gene Stanley, a physicist at Boston University who has made major contributions to complexity research, says that showing that many networks in the real world can be described as scale-free – and recognizing that this property is ubiquitous – is Barabási’s biggest accomplishment. But Stanley adds that Barabási has “done something which some people do not do. He’s stuck with it – he’s stayed with the field he helped to develop”.
Beyond tradition
Barabási has, for example, set up a collaboration between Northeastern’s Center for Complex Network Research, which he directs, and Harvard Medical School. One focus of the group’s work is to treat the cell not just as a bag of genes that have a mutation, but as a bag of interacting components. In Barabási’s eyes, this gene network is the kind of complex problem that Ludwig Boltzmann faced in the 1870s and 1880s when he developed thermodynamics from statistical principles, translating microscopic randomness into macroscopic behaviour.
In Barabási’s view, being a physicist means using the techniques of physics to inquire into the world around us – and while that world is made up of stars and subatomic particles, it also includes social and biological systems. In the past, Barabási explains, there have not been enough data for physicists to apply their tools to these complex systems. However, “big data” now offers a deluge of information about the real-time behaviour of many complex systems, and these resources can enrich physics. Indeed, Barabási is critical of the concept of “traditional physics”. “Traditional physics is the physics that isn’t worth studying, isn’t it?” he asks with a glint in his eye. “Because it is already traditional and we know everything about it.”
Branching out into research areas untouched by “traditional physics” does have its pitfalls, however. Although Barabási’s work on human behaviour and mobility is arguably among his most interesting to date, he recently pulled the plug on it after becoming uneasy with the way certain organizations, such as the US National Security Agency, have used his findings. He refuses to be drawn on specifics, but says that, in general, scientists “occasionally have to step back and ask ourselves why we do certain things and whether there are proper safeguards for how the research is being applied”. Barabási believes that in this particular case, the safeguards have failed. “My personal answer was to scale back that part of research and also to think a bit deeper about what our responsibilities as scientists are in this domain,” he says.
The need for change
Despite these risks, Barabási thinks it is essential for the boundaries of physics to change. In the past, he notes, the subject suffered when it failed to accommodate new directions of research. “For a long time, physics departments short-sightedly believed that astrophysics and astronomy were not physics,” he says. “They are struggling to bring astrophysicists back now that they are becoming very exciting and making major discoveries.”
It is essential for the boundaries of physics to change
Barabási’s affinity with these outcast astronomers of the past triggered in him some mixed feelings earlier this year when one of his papers knocked the astronomer Subrahmanyan Chandrasekhar off his perch as the author of the most-cited paper in Reviews of Modern Physics. “I have always been a fan of Chandrasekhar who himself was actually an outsider in physics,” he says. “Had there been any person that I would not want to dethrone, it would have been him.”
Barabási believes that physics still has a tendency to exclude those who are perceived as outsiders. When he and his colleagues in the other departments hire someone, he says, they do not ask that person whether they have a PhD in that subject. “[Instead] we ask them what they can bring to the department and how exciting their research is.” In contrast, he adds, “I can’t remember one single hiring in a physics department that didn’t ask, ‘Is this candidate a physicist?’ ” If physics does not adapt, it risks becoming “an insular enterprise” that will be left behind by other fields, Barabási warns.
Two decades ago, the US physics and astronomy communities looked pretty similar: about 10% of faculty members were female, and almost everyone was white. Since then, the picture has changed – but only in astronomy, and only for women, who now make up around 15% of tenured faculty and, by some estimates, nearly 40% of new hires in US astronomy departments. Physics, meanwhile, is stuck at around 10%, and in both fields the figures for under-represented minorities have barely budged.
This asymmetric pattern of change is both troubling and galvanizing for Meg Urry, the Yale University astrophysicist and incoming president of the American Astronomical Society (AAS). Following her election in February this year, Urry – a longtime advocate for women in science – announced that increasing participation among minorities would be a major goal of her presidency. “In the past two decades we’ve seen a revolution in the participation of women in astronomy,” she wrote. “We have yet to see comparable gains in the participation of under-represented minorities, or the sense among all members that they are fully welcome. This has been a priority for the AAS for some time, and I intend to add my voice to this issue.”
Urry’s voice matters not only because of her role in astronomy’s gender “revolution” but also because of her status as a researcher. Until recently, she was the chair of Yale’s physics department, having become its first ever tenured female faculty member when she was hired in 2001. Before that, she spent 14 years at the Space Telescope Science Institute (STScI) in Maryland, US, where her achievements included a study of active galactic nuclei that has been cited nearly 2000 times.
Urry’s scientific accomplishments have boosted what she calls her “second career” as a proponent of women’s participation in science. This career began in earnest in 1992, when Urry and an STScI colleague, Laura Danly, organized the first Women in Astronomy conference. One outcome of it was the Baltimore Charter, which identified problems such as sexual harassment and discriminatory hiring in astronomy and recommended ways of addressing them. But the conference also did something that Urry believes was even more important: it brought 150 women astronomers together in the same room. “We all were looking around and going, ‘Oh my God, I didn’t realize there were so many!’,” she recalls. “It created networks, it created a sense that we were well beyond critical mass and I think all those things combined to create a community where everyone lifted everyone else.”
Fixing the leaky pipe
Urry acknowledges that boosting the participation of minorities in physics and astronomy is “a slightly different problem”. One reason is that whereas women are under-represented in these fields by “factors of a few”, for some minority groups, she says, “it’s an order of magnitude problem”. African-Americans and Latinos, for example, receive fewer than 3% of the physics PhDs awarded in the US each year despite making up almost 30% of the population. Being part of such a small group can be isolating, says Hakeem Oluseyi, an astrophysicist at the Florida Institute of Technology and an officer of the National Society of Black Physicists. “You feel like your entire race is going to be judged on your behaviour,” he says. To combat that perception, Oluseyi adds, “You need a critical mass. If you accept students one or two at a time, you’ll have people dropping out.”
Efforts to achieve critical mass often focus on the education “pipeline” that takes students from secondary school up to PhD level. Jenni Dyer, who leads the diversity programme at the Institute of Physics, which publishes Physics World, says that in the UK, the percentage of black science students is extremely low even at secondary school. For that reason, she says, her team concentrates on getting students interested early in their education. But in the US, Urry says, the pipeline for African-Americans and Latinos also has a significant “leak” at the end of their undergraduate years, since many aspiring minority scientists attend poorly funded (often formerly all-black) institutions that do not prepare them well for postgraduate study. Oluseyi, who graduated from Mississippi’s historically black Tougaloo College, recalls that he faced a steep learning curve when he went to Stanford University for his PhD. He credits his success in part to his African-American PhD supervisor, the late Art Walker, and to a Stanford programme that accepted students like him and let them catch up by taking advanced undergraduate courses.
By excluding people from physics we have dumbed it down
Supporting programmes like that might be one way for the AAS to help boost minority participation, Urry speculates. But whichever part of the pipeline she decides to tackle, she believes that fixing the leaks is vital. “Personally, I am driven by the issue of justice and fairness,” she says. “But there is also no evidence whatsoever to believe that women or people of colour or gay people or handicapped people are less competent at physics. So, on the assumption that everyone has a similar distribution of ability, by excluding these people from the profession we have dumbed it down.” And that, Urry concludes, is “something that in the modern day, when so many problems are technical and scientific in nature, we just can’t afford to do”.
For the cosmologist Neil Turok, Africa represents “the world’s greatest untapped pool of scientific and technical talent”. He should know: the director of Canada’s Perimeter Institute for Theoretical Physics was born in South Africa, and credits his political-activist parents with giving him a “very strong sense of commitment and obligation” to improving education for people across the continent. Indeed, Turok’s parents convinced him to found the African Institute for Mathematical Sciences (AIMS), which has trained some 460 postgraduates in advanced mathematics since its inception in 2003.
Each year, AIMS brings 50–60 postgraduates from more than two dozen African countries to its campuses in South Africa, Ghana and Senegal to learn how mathematics can be used to solve scientific problems. The year-long MSc programme begins by boosting students’ skills and filling in the sometimes huge gaps in their previous education. “These are bright people but they have not always been through good universities,” Turok explains, adding that AIMS seeks to “shock” students out of what he calls an “undergraduate way of thinking”.
Rather than sitting through conventional lectures, AIMS students learn to think on their feet. This is not easy, Turok says, with some students becoming “very unhappy” and questioning why they are there. “But after about two months, they get it – ‘this is about me thinking’,” he says.
AIMS students are also exposed to a wide range of cutting-edge research via three-week survey courses. The idea is to help students make an informed decision about topics they want to pursue in their PhDs.
Morenikeji Deborah Akinlotan from Nigeria is about to embark on a PhD in biomathematics because of her experience at AIMS: “I discovered that mathematics is not only extremely useful in all spheres of life, but also that I can actually apply mathematics in medical-related projects.”
Of course, African students are not the only ones who need to shed their “undergraduate thinking” and Turok believes that every university in the world ought to run similar year-long programmes. He argues that they let students think about what they want to specialize in rather than just plunging into a PhD. Governments have also become short-sighted, he adds, concentrating only on economically relevant science and engineering. “The focus should be on developing students as independent and innovative thinkers – that is the most valuable thing a university can do.”
Africa is the ideal place to reinvent advanced education
“My experience in founding AIMS has convinced me that Africa is the ideal place to reinvent advanced education. The students are more motivated than anywhere else because they have such adversity in their lives. They are also more diverse, and the energy you get from students in Africa is quite extraordinary.” When Turok arrived at the Perimeter Institute in 2008 he set up the Perimeter Scholars International MSc programme, which, much like AIMS, exposes students to a wide range of theoretical physics.
Turok says that although AIMS is only a decade old, it has already benefited Africa. While about 30% of its alumni have chosen to pursue further study or careers outside of Africa, others are taking leading academic, industrial and government roles across the continent and all have made a strong commitment to contribute to its prosperity. The institute is also expanding, with new facilities planned for Cameroon, Tanzania and Benin.
So far, AIMS has succeeded in attracting both funding and volunteer lecturers. However, Turok believes that AIMS’s ultimate success will be in changing cultural attitudes about Africa. Before AIMS was established, he says, “the international development community had overlooked advanced training in Africa, mostly focusing on primary school”. But Turok thinks it is vital to have people in government who can think for themselves and plan and structure an economy. “Above all, you need role models,” he says. “You have to create a situation where the brightest African students are succeeding in higher education and getting advanced degrees.”
Trust Chibawara, who is from Zimbabwe and attended AIMS in 2007, was one such student. “I was far better equipped for making my future decisions after AIMS,”he says. “AIMS taught me, most importantly, that I can learn, that I can attempt anything I put my mind to and be very successful.”
In 2008 Turok said that he wanted the next Einstein to be African, and the goal of creating 15 campuses across the continent is an important part of the AIMS Next Einstein Initiative. “Theoretical physics has always been the pinnacle of human achievement and seeing Africans do theoretical physics will do much to undermine racism,” he says. “An individual can do incredible things.”
Predicting the future is a mug’s game, which is why most physicists prefer not to shout too loudly about the possible benefits of their research, even if there is a growing demand from funding agencies to do so. Grandiose, utopian predictions that never materialize always look faintly ridiculous in years to come – have you seen anyone recently flying to work on a nuclear-powered jet-pack?
But with this being the 25th anniversary of Physics World, it is only right that we should set ourselves up for a fall by picking the five physics spin-offs we expect to make the biggest difference to humanity over the next few decades. And while there are plenty of spin-offs that will aid science, our five choices are those that will, we feel, do most to improve the everyday lives of ordinary people around the world.
Of course, we expect to get a few of them wrong. And there are bound to be one or two seemingly mundane discoveries that we have missed, yet will catapult to fame and fortune in the next few years. So without further ado, let’s begin with our first choice – a medical treatment that today can only be done at 40 or so facilities worldwide but that, we reckon, will soon be found at every major hospital around the globe.
A better beam
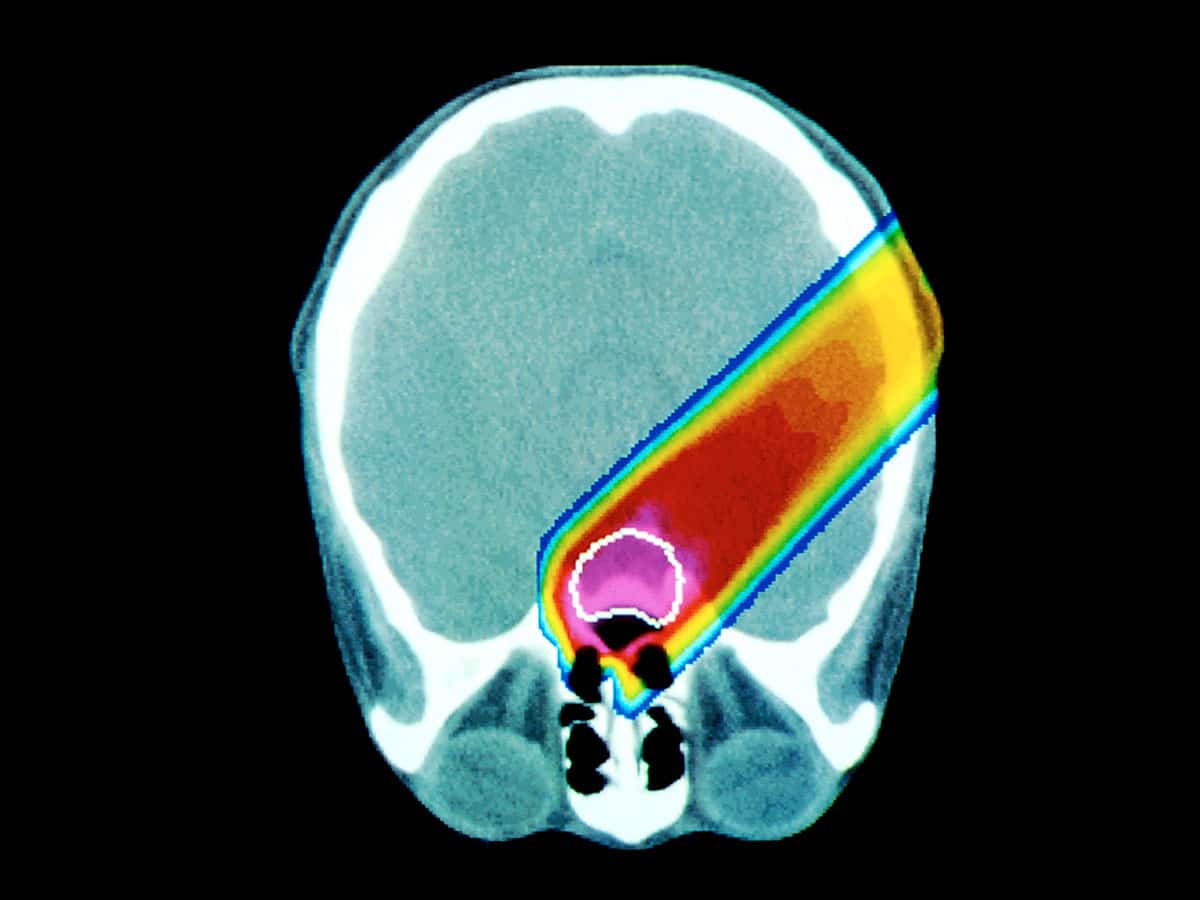
Opportunity knocks A beam of protons irradiating a tumour. (Courtesy: National Cancer Institute/Science Photo Library)
That treatment is hadron therapy, which exploits the fact that beams of protons and other hadrons can almost magically penetrate human tissue before releasing their energy at a well-defined depth. Hadron beams can therefore kill tumour cells while sparing healthy tissue, making them ideal for treating certain cancers – notably the potentially lethal eye cancer ocular melanoma – because the patient suffers less and the success rate is higher. Gamma rays, X-rays or electrons, in contrast, tend to dump their energy over a much greater volume.
Particle therapy has emerged as a by-product of high-energy physics – in fact, the first treatment took place at the Lawrence Berkeley National Laboratory in 1954 – but making it more widely available is a challenge. The snag is that the accelerators currently used to create beams of protons and other heavy ions are large and expensive, and the gantries that steer the beam across a tumour are the size of a small house. But one solution that could put particle therapy within the reach of most hospitals is laser-driven acceleration, which involves firing a very short yet intense laser pulse into a jet of gas, thin foil or thicker target.
Particle therapy has emerged as a by-product of high-energy physics, but making it more widely available is challenging
As the intense pulse travels through the target, it rips nearby electrons away from the positive nuclei, thus creating a huge electric field gradient in its wake. This field has a large accelerating potential that can be thousands of times that of a conventional accelerator. A laser-driven hadron accelerator can therefore, in principle, be relatively compact. Table-top lasers have already been used to accelerate protons to tens of mega-electron-volts, approaching the 70 MeV needed to treat ocular cancer. However, we need to find ways of boosting their energy to 200–300 MeV to kill tumours lying deeper within the body.
Physics for all Compact laser-driven accelerators will improve cancer treatment. (Courtesy: SuperStock)
Commercially available laser systems that can deliver such energies should be available in about 10 years, although it will probably take a further decade or so before they become routinely used to treat patients in hospitals. One problem with laser acceleration is that it delivers particles in pulses, rather than as a continuous beam. Techniques will therefore have to be devised to ensure the pulses are intense and numerous enough that patients get enough of a dose without having to lie perfectly still for long periods. In fact, the pulses could be a virtue as the magnets needed to scan the proton beam across a treatment area would then not have to be as big.
And if lasers do not bring hadron therapy to every hospital, there are other options, such as fixed-field alternating gradient accelerators. They are being developed at Daresbury Laboratory and elsewhere,and could also lead to compact devices suitable for cancer treatment.
Some like it thin
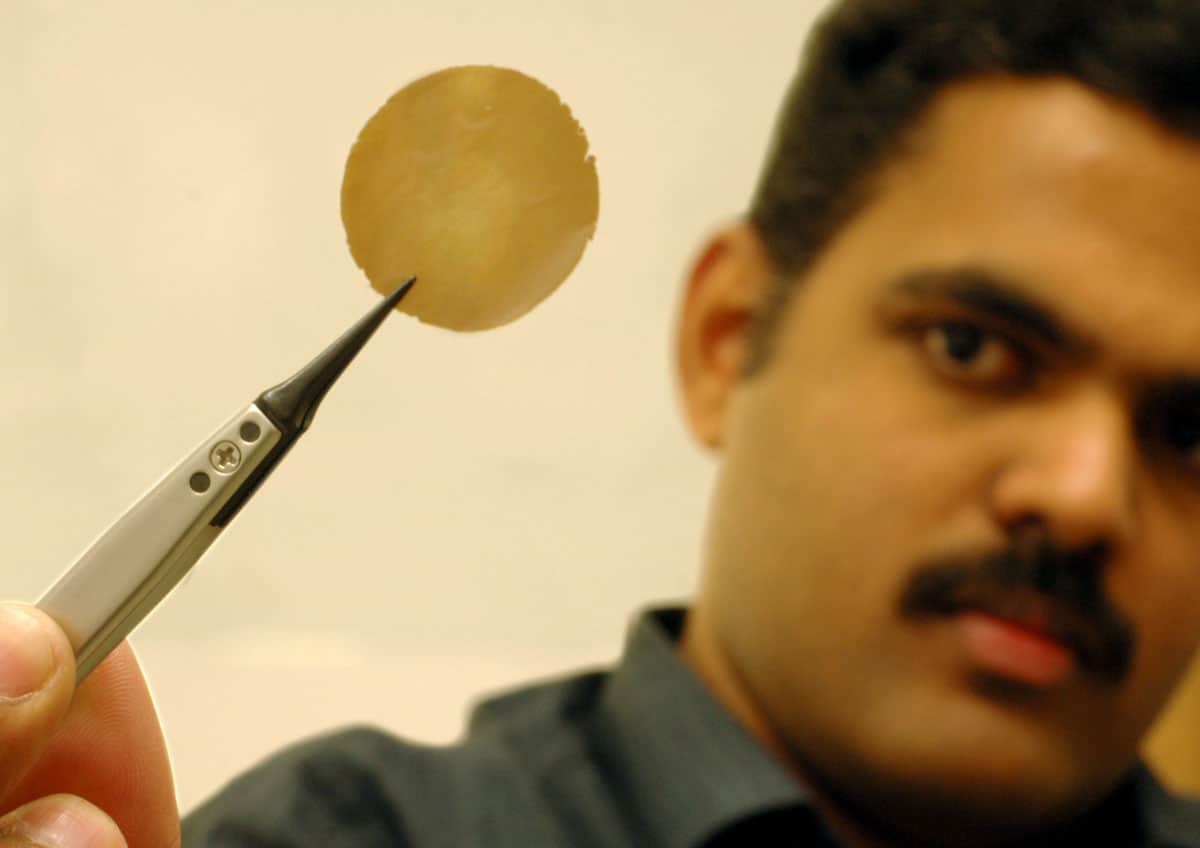
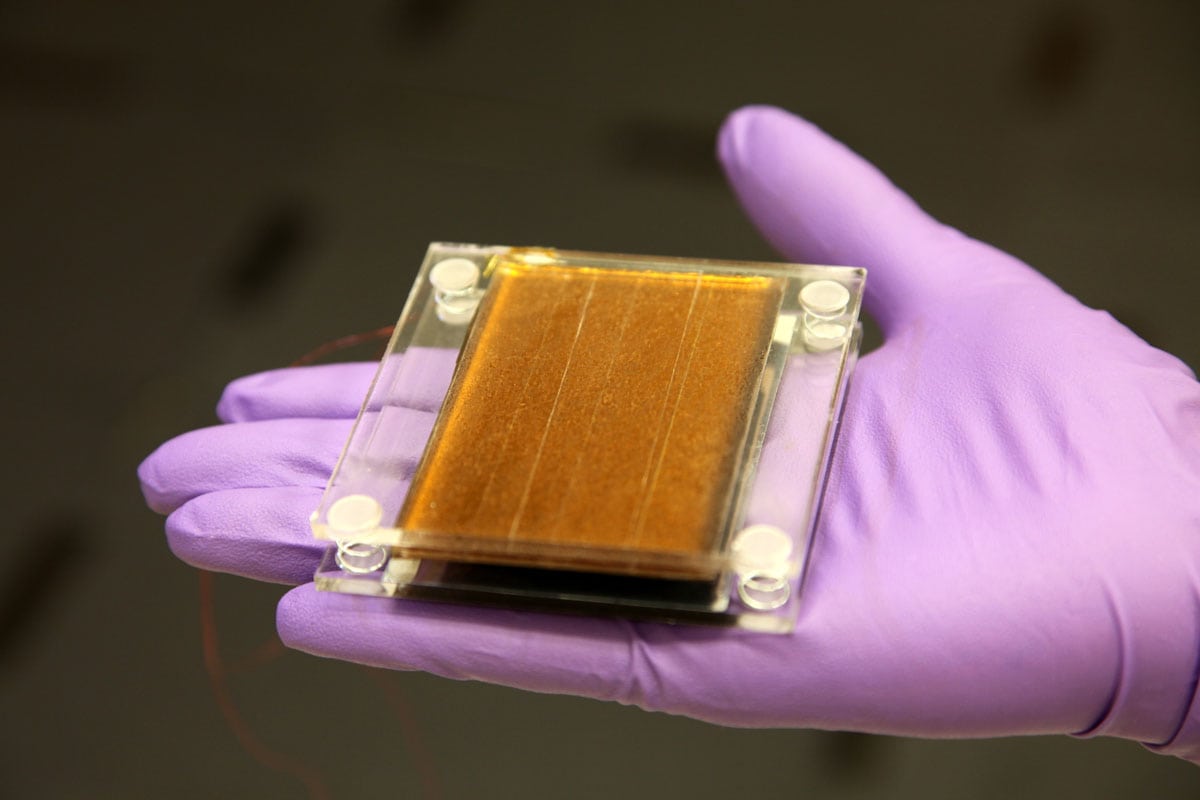
Opportunity knocks A graphene water filter. (Courtesy: University of Manchester)
While laser-driven hadron therapy is likely to be of most benefit to people in rich nations, our next spin-off could have massive implications for those in the developing world. It involves a material that was first isolated just nine years ago by Andre Geim and Konstantin Novoselov at the University of Manchester. That substance is, of course, graphene. Much of the hype surrounding this 2D honeycomb of carbon atoms has focused on its extraordinary electronic properties – who could resist the lure of an ultrathin bendable smartphone? But we think that another of graphene’s physical properties could be more important still. It turns out that despite being just one atom thick graphene appears to be completely impervious to almost every liquid and gas. By drilling holes of the appropriate size in graphene – or creating membranes of graphene flakes stuck together with just the right sized gaps between flakes – the material can be used as a selective filter.
In 2012 Geim and colleagues found that membranes made from millions of flakes of graphene oxide that had been stuck together allow water to easily pass through – yet the membranes are impervious to every other liquid or gas tested. Indeed, water was found to flow through the membrane 10 billion times faster than helium, which itself is rather good at diffusing through solids.
The application of such graphene membranes is obvious: they could be the ultimate water purifiers and could someday create drinking water from the sea. But such graphene-based membranes could have other applications as well, such as separating molecular species in a mixture, shielding people from dangerous toxins or making more efficient electricity-generating fuel cells.
Physics for all Graphene filters will extend access to clean water. (Courtesy: iStockphoto)
But while cheap and effective water purification could be an early spin-off from research into graphene, this “wonder material” could have many other applications in biology and medicine too. One promising idea is to read the base sequences of DNA by drawing these protein chains through tiny nanometre-sized holes drilled into graphene, the electrical properties of which change depending on which base happens to be in the pore at any one time. Such graphene “nanopores” could even be engineered to mimic the plethora of pores inside living cells or to craft artificial systems that recreate the incredible filtering abilities of the cell wall.
Being strong, flexible and – as far as we know – biocompatible, graphene could also be used as the basis of new kinds of prosthetic limbs. Earlier this year, for example, physicists in Germany showed that graphene transistors can generate an electrical signal in response to changes in the concentrations of ions that occur when cultured nerve cells fire. Work like this could help us to build artificial limbs that are wired directly into the human nervous system using graphene electronics as the interface.
Quantum calculations
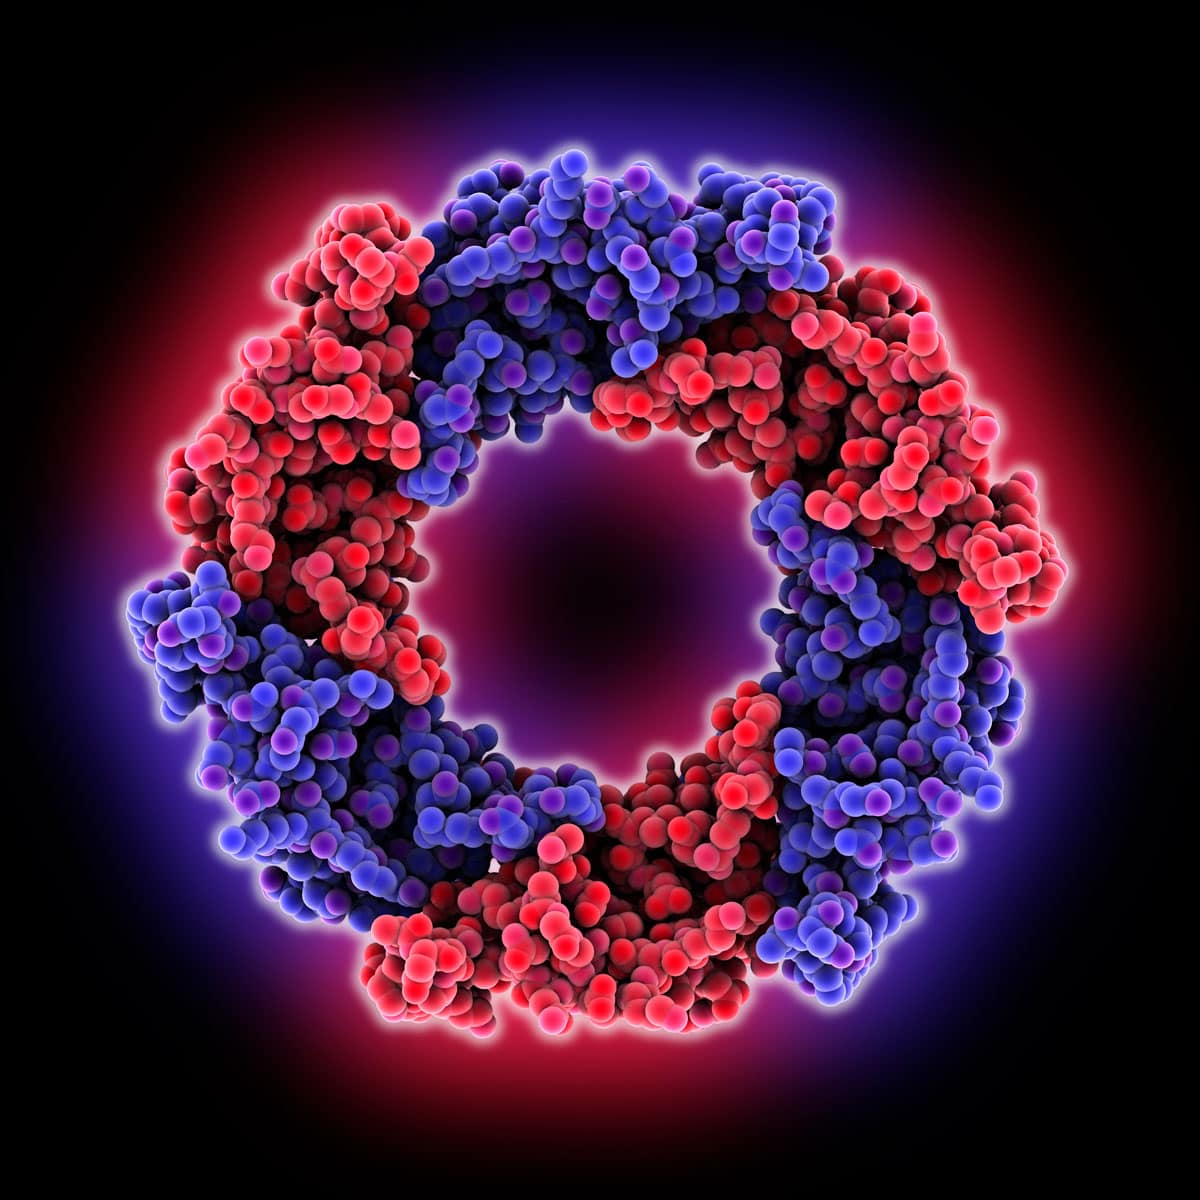
Physics for all Superlenses will allow us to watch the chemistry of life in action. (Courtesy: Laguna Design/Science Photo Library)
Strengthening the links between complicated, messy biology and the neat reductionist world of physics is the basis for our next revolutionary spin-off. For the past decade or so, the new discipline of quantum information has grown by leaps and bounds. Ultra-secure quantum-cryptography systems are already being used by banks and other institutions keen on secrecy. Physicists can transmit quantum information a hundred or so kilometres through the air, and there are serious proposals to make a quantum link between ground and satellites in space.
The possibilities of quantum computers, however, are even more intriguing. Such devices, which would exploit superposition, entanglement and other quantum phenomena to perform super-fast calculations, have the potential for some amazing feats. But there is one particular thing that a quantum computer can do much better than a conventional computer – and that is to solve the Schrödinger equation for systems as large as a molecule, without resorting to the messy approximations that are usually needed to describe even the simplest molecules.
This would involve taking a collection of quantum bits, or “qubits” – say trapped ions – and manipulating both their internal properties and the interactions between them to simulate the atoms, and the forces between them, in a molecule. In the case of ions, this manipulation could be done by adjusting electric and magnetic fields applied to the ions or by shining laser light on them. Researchers would need about 100 qubits to do quantum simulations that can compete with today’s supercomputers. Although today’s best systems have tens of qubits, our control over the quantum world is improving so rapidly that working “quantum simulators” could be with us in a decade or so.
Algorithms for such simulators have, in fact, already been developed for calculating chemical reaction rates and how proteins fold. If put into practice, they could help with the design of new drugs by allowing chemists to calculate more accurately the properties of candidate molecules and slash the time it takes to determine which would work best. Quantum simulators could also be used to understand the process by which DNA protects itself from the gene-damaging glare of sunlight, which could help prevent skin and other cancers.
Simulators could even help us to understand how photosynthesis occurs and thereby let us build artificial systems that mimic the efficient energy harvesting of plants or serve as new sources of sustainable energy. Quantum simulations would also help chemists get a better handle on how enzymes work, which could be a boon to the chemical industry. Indeed, quantum simulation looks set to be one of the most important tools that physicists have created for the rest of science.
Seeing more clearly
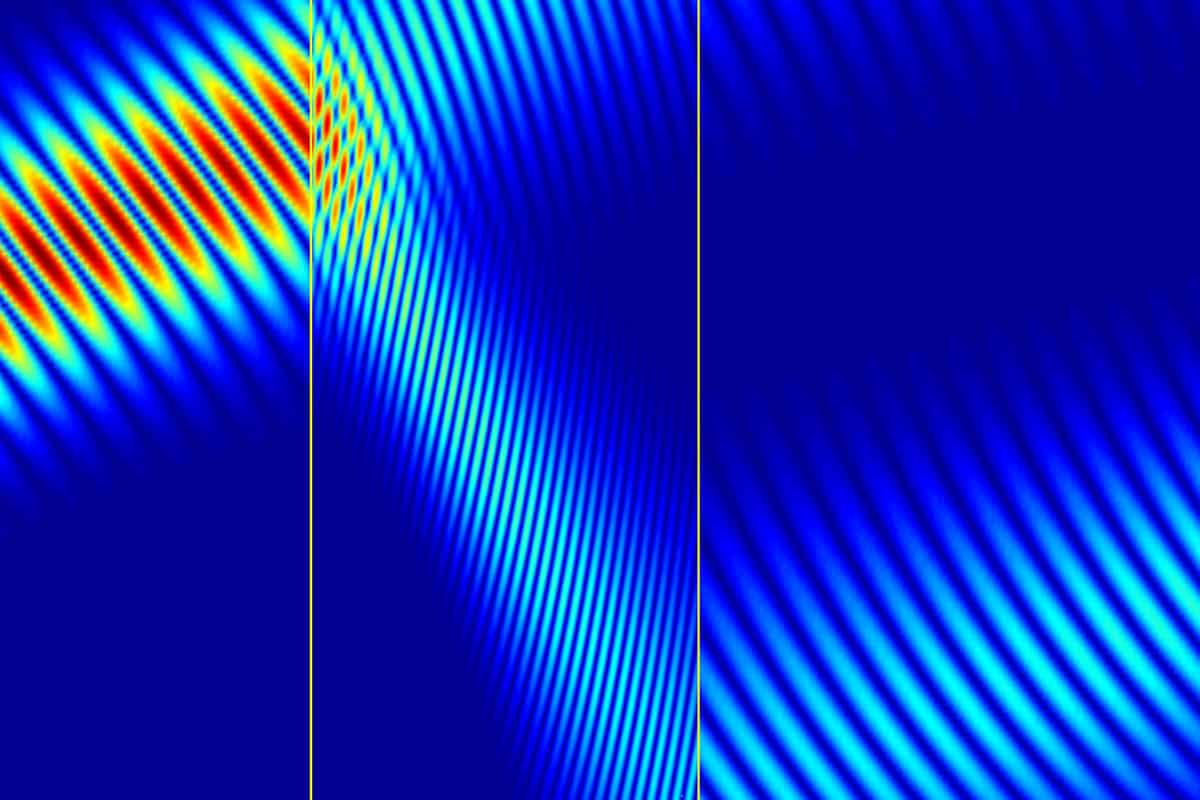
Opportunity knocks A computer simulation of a superlens material. (Courtesy: I Shadrivov/New J. Phys.7 220)
Our next big spin-off could also boost our understanding of biological processes by giving us a new way of seeing with light. Light is, of course, a wonderful thing as it can be guided and focused using simple lenses and fibres, capturing images of objects that are either too small or too far away to be seen with the naked eye. Moreover, many atomic and molecular transitions occur at optical wavelengths, which is why light – from the infrared to the ultraviolet – lies at the heart of a vast range of spectroscopic techniques.
But there is one major drawback to light as a probe of atoms and molecules: light of a certain wavelength cannot be used to discern an object smaller than about half that wavelength. Even for ultraviolet light, this “diffraction limit” is about 50 nm, or roughly the size of a large protein molecule. Electron microscopy can get round this resolution problem because the wavelengths of electrons can be much shorter than light. But it usually requires samples to be prepared in a way that can alter them, which is a problem for fragile biological systems.
Over the past decade or so, however, physicists have devised a way of getting around the diffraction limit and obtaining images of objects that are much smaller than optical wavelengths. The technique does not involve the familiar “far-field” light that is scattered or transmitted by an object and observed some distance away from it. Instead, it exploits the “near-field” or “evanescent” light that contains detailed sub-wavelength information about an object.
Physics for all Quantum simulators will help us harness the Sun’s energy by mimicking photosynthesis. (Courtesy: iStockphoto)
This light, which decays exponentially over a distance shorter than the wavelength of the light itself, cannot be gathered and focused using conventional optics. But in 2000 John Pendry of Imperial College London predicted that artificially engineered metamaterials with a refractive index of less than zero could be used to create a “superlens” that could gather and focus the evanescent light before combining it with the far-field light to create an image of the object. If the lens were “perfect” and gathered all the light, it could be used to create an image with infinite resolution. But even if only some of the light were captured, a superlens could still probe distances significantly below the diffraction limit.
Superlens-powered “nanoscopes” look set to fundamentally alter how we view the very small
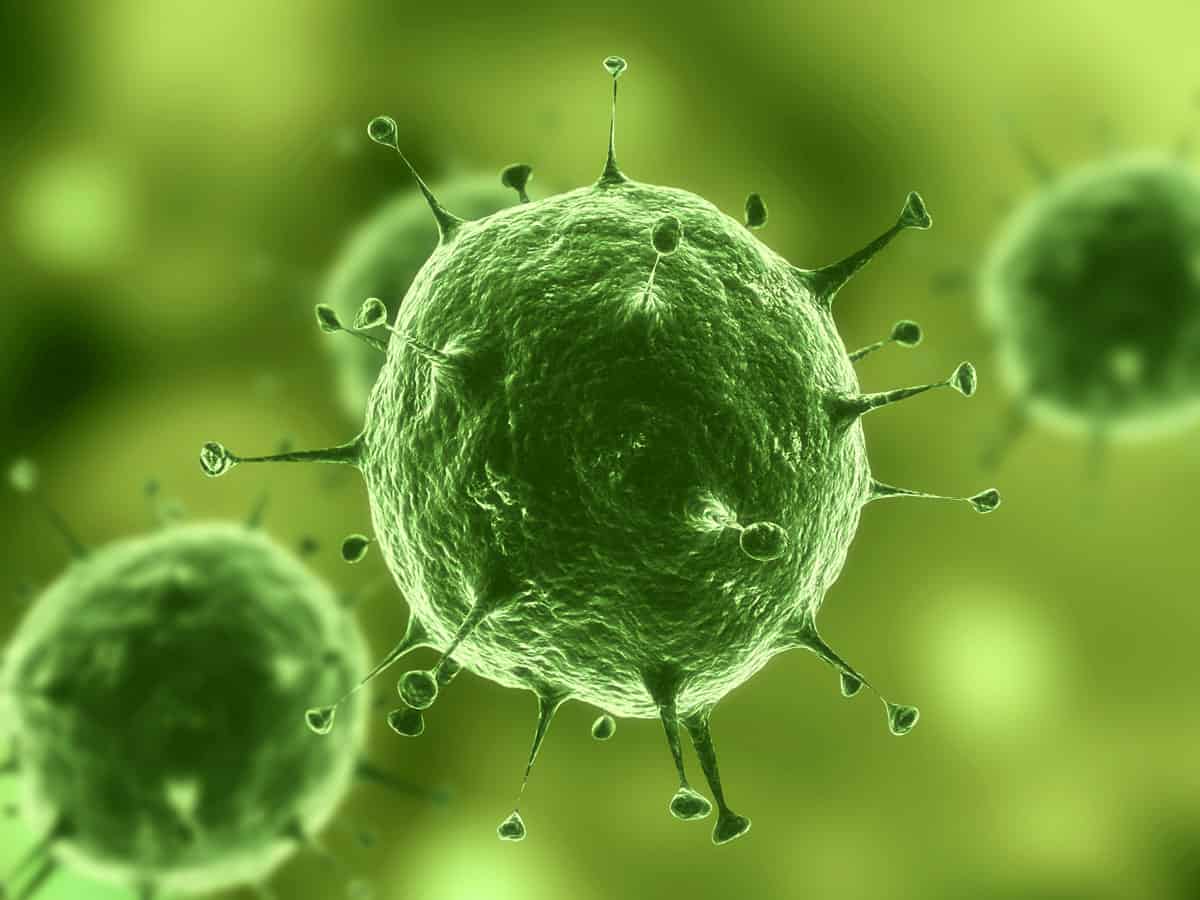
The challenge with making negative-index metamaterials is that the index of refraction has both an electric and a magnetic component, both of which have to be less than zero. And, while the first rudimentary superlens-powered “nanoscopes” have already been made using metamaterials with the appropriate electrical components, making a material with the right magnetic response seems to have stalled over the past few years. Still, we think such nanoscopes look set to fundamentally alter how we view the very small – from protein folding and DNA replication to seeing how viruses invade healthy cells. So perhaps the superlens will find a cure for the common cold at last.
Power on the go
Opportunity knocks A triboelectric generator. (Courtesy: Georgia Institute of Technology)
Our final spin-off concerns energy – and specifically the stuff that powers the growing number of smartphones, tablets and other portable devices that we use while on the move in our daily lives. These are mostly run by lithium-ion batteries, but boosting battery capacity has proven very difficult. If we are moving, however, why not harvest some of that kinetic energy to power all our gadgets? Harvesting is most efficient when it harnesses repetitive motion such as walking, and the best estimate for the maximum rate at which mechanical energy can be converted to electrical energy – without impeding the walker – is 11 W. That, coincidentally, is about the same as today’s ubiquitous USB charger.
Researchers have already made a device – designed to be fitted into a shoe – that can fully charge a mobile phone in about 10 hours. While most of us do not regularly walk for such long periods, aphone user could at the very least keep their phone battery topped up using such a system. The “shoe charger” has been built by a team led by Zhong Lin Wang at the Georgia Institute of Technology, who is an advocate of energy harvesting from triboelectricity – commonly known as static electricity.
Normally the bane of engineers working in fields as diverse as aeronautics, microelectronics and textiles, triboelectricity is generated when two different materials (one electron-loving and the other electron-repelling) are rubbed together and then moved apart. The result is two oppositely-charged surfaces that create a voltage that drives a current. But triboelectric generators do not just have to be fitted into shoes. A jacket, for example, could produce 10–20 W from human motion – while a triboelectric flag flapping in the breeze could harvest 30–50 W.
Physics for all Energy harvesting will keep our electronic gadgets working while we are on the go. (Courtesy: Shutterstock)
But who would want a triboelectric flag and clothes? The most immediate beneficiaries are sure to be infantry soldiers, who are currently burdened by massive battery packs weighing up to 10 kg that they need to power a myriad of electronic devices from night-vision goggles to GPS and communications systems. Triboelectric systems could also be used to power the growing number of medical implants and prosthetics that currently run only on batteries.
While all of these innovations have come from blue-sky research, they will probably come to fruition in very different ways. Laser-driven proton therapy will be developed by large teams of physicists, cancer specialists and medical-equipment makers, whereas the first commercial shoe charger could be created in someone’s garage. And to make a difference in our lives, all of these concepts must survive the “valley of death”: the gap between making a scientific discovery and turning it into a practical product. We are confident that at least some of our top five will make it across.
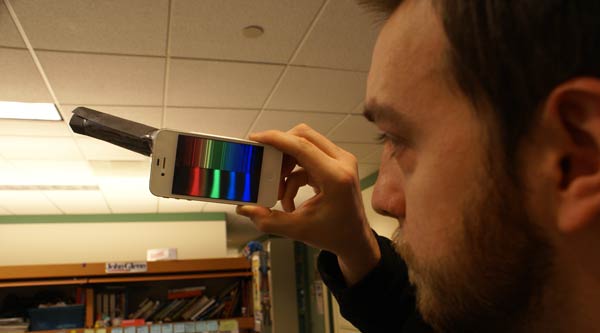
APS Outreach Specialist James Roche shows off SpectraSnapp. (Courtesy: Mike Lucibella/APS)
By Hamish Johnston and Tushna Commissariat
This was Nobel week, and physicists had two prizes to celebrate this year. Of course there was the prize for physics, which this year went to Peter Higgs and François Englert for their theoretical prediction of the Higgs boson in 1964.
Shortly after the physics-prize announcement, Englert was on the phone to Stockholm, but the Nobel officials couldn’t seem to find Higgs. Early rumours were that he had retreated to the Highlands of Scotland to avoid the media glare, but a few hours later he was photographed outside his Edinburgh home by The Scotsman newspaper.
Later, the BBC reported that Higgs was told about his Nobel win by a passer-by on an Edinburgh street, who stopped her car when she spotted the physics laureate on the pavement. “She congratulated me on the news and I said ‘Oh, what news?’,” Higgs is quoted as saying.
Catherine Heymans (Courtesy: University of Edinburgh)
Inquisitive minds from all over the city of Bristol (where Physics World HQ is based) met at the University of Bristol’s Peel Lecture Theatre last night to hear astrophysicist Catherine Heymans give a talk entitled “The Dark Universe”, in which she tackled dark matter, dark energy, the structure of our universe from the largest to the smallest scales, flying pigs and even astronomical tooth fairies!
Heymans’ lecture was the first of a number of talks to celebrate the 25th anniversary of Physics World that we will be running with the Bristol Festival of Ideas, which hosts special events, talks and screenings held throughout the year in the city.
This being the first time that Physics World has been directly involved with the festival, we were pleased that Heymans’ talk was entirely sold out. And having a particular interest in astronomy, I made sure to attend the event, which proved to be a great success.
Physicists have found evidence of a new “magic number” of neutrons in an unstable isotope of calcium. Using the Radioactive Ion Beam Factory at RIKEN in Japan, they have isolated calcium nuclei containing 34 neutrons – the first time 34 has been seen as a magic number. The discovery could improve our understanding of astrophysical processes, such as nucleosynthesis, that involve highly unstable and short-lived nuclei.
Magic nuclei are those with full “shells” of nucleons (protons or neutrons) and they tend to be stable against radioactive decay. A familiar example is the helium-4 nucleus, which has a magic number of both protons (two) and neutrons (two). It is therefore termed “doubly magic” and is extremely stable. Other magic numbers include 8, 20, 28, 50, 82 and 126.
However, there are significant exceptions to this shell model of the nucleus and its magic numbers. In particular, unstable nuclei that have a large imbalance in their numbers of protons and neutrons do not seem to conform. In neutron-rich silicon-42, for example, 28 neutrons (N = 28) is no longer a magic number, whereas N = 16 does appear to be magic in neutron-rich oxygen isotopes.
Predicted in 2001
Studies of neutron-rich calcium nuclei have already shown that N = 32 is a magic number – and theoretical calculations done in 2001 suggest that N = 34 should also be magic. Now, physicists working at RIKEN have found experimental evidence for this magic number at 34.
The experiment was carried out by a team led by David Steppenbeck at the University of Tokyo. The researchers began by firing a beam of scandium and titanium nuclei at a solid target to create large numbers of short-lived nuclei. These nuclei are often in highly excited energy states and, as they decay, emit gamma rays, which the team detected. In much the same way that an atom can be identified by the light it emits, the presence of a particular nucleus – and some information about its internal structure – can be gleaned from its gamma-ray spectrum.
Sub-shell closing
The experiment revealed that the first excited state of calcium-54 is at a relatively high energy and this is indicative of a “sub-shell” closing at 34 neutrons. Nuclear sub-shells are analogous to the familiar atomic sub-shells (s, p, d and so on); if the energy gap between sub-shells is large, then the closure of that shell corresponds to a magic number.
The discovery should provide physicists with important information about interactions between nucleons in highly unstable nuclei. While such nuclei are not encountered in daily life, they can play an important role in the process of nucleosynthesis whereby heavy elements, such as iron and nickel, are forged in violent astrophysical events such as supernovae.
“Enriching our knowledge of the structures of highly unstable nuclei and the nucleon–nucleon forces that drive nuclear-shell evolution and the appearance or disappearance of the nuclear magic numbers in radioactive nuclei plays an important role in understanding astrophysical processes such as nucleosynthesis in stars,” explains Steppenbeck.
An international group of researchers has developed a nanodiamond biosensor that can determine the iron content in blood. The sensor uses defects in the tiny diamonds to detect a particular protein that stores iron in the blood and which is also found in many types of living organisms. The researchers hope to extend their sensor technology to allow it to detect other proteins.
Iron abounds in most living organisms – and proteins containing the metal are found in everything from single-celled micro-organisms to human beings. In humans, iron deficiencies are mainly caused by malnutrition and can lead to anaemia, while an increased level of iron can indicate the presence of an acute inflammatory response. So, accurately measuring blood-iron levels is an essential medical diagnostic tool.
Distinct detection
Detecting specific single proteins in biological samples is no mean feat, however. Current methods either involve using organic markers – dyes and fluorescent proteins – or quantum dots. But the markers tend to bleach after being used for a while and quantum dots can degrade the sample. Standard blood tests involve detecting a protein, known as ferritin, which is responsible for the storage and transport of iron and can contain up to 4500 magnetic iron ions. But thanks to the use of the organic dyes or the quantum dots, the results can be inconclusive, as they indirectly infer the iron amounts.
Now, a team led by physicist Fedor Jelezko at Ulm University in Germany, along with colleagues in Taiwan, has developed a method to detect ferritin using nanometre-sized diamonds that contain lattice imperfections known as nitrogen-vacancy (NV) defects. These defects occur when two neighbouring carbon atoms in the diamond are replaced by a nitrogen atom and an empty lattice site. Such NV sites are capable of detecting weak magnetic fields. This was precisely what the researchers were looking for, as each ferritin-bound iron atom generates a tiny magnetic field that is normally hard to measure.
Special sites
Jelezko told physicsworld.com that the NV sites were crucial for developing the new sensor. This is why the Ulm researchers paired up with Huan-Cheng Chang and colleagues at the Academia Sinica in Taiwan, who irradiated commercially available nanodiamonds with heavy ions to create the NVs.
Stellar spectrum
As a proof-of-principle test the researchers used the nanodiamonds to detect a sample of purified ferritin protein rather than a sample still in the blood. To do this, Jelezko and colleagues had to find a way to adsorb the ferritin onto the diamond’s surface. This was done using electrostatic interactions between the nanodiamonds and ferritin proteins that result in a non-covalent bond being formed between the diamond surface and an amino group in the protein. The researchers then detected the ferritin via the “magnetic noise” that is generated by the iron atoms in the protein constantly flipping their unstable magnetic moments.
“We essentially measure the amplitude of the magnetic noise at the NV sites,” says Jelezko. He also points out that while in most experiments noise of any kind is a hindrance, in this case it is crucial. “In fact, we detect not just the amplitude, but also the frequency and hence the spectrum of the noise,” Jelezko says. He further explains that the researchers can use their results to calculate the number of atoms that are responsible for the noise – the more atoms, the higher the frequency of the flips. Jelezko likens the technique to astronomy, where the spectrum of a star reveals its composition and inner processes. “We don’t touch the iron inside the protein, we measure the noise coming out instead and so we have a non-contact technique,” he says.
Direct sensing
The team observed a significant reduction in both coherence and relaxation time of the spin of an NV caused by the presence of ferritin – in fact, the observed effect was large enough for a single ferritin molecule close to the sensor to be detected. The researchers also used a theoretical model to validate the method, to ensure that the signals they measured were consistent with the presence of ferritin.
The new work shows that NV biosensors are a promising development thanks to their biocompatibility and high magnetic sensitivity at ambient conditions. Jelezko says that the method could soon be used to detect iron in blood samples directly, by simply placing the nanodiamond in a blood sample and then washing away all but the ferritin, or by creating a microfluidic channel in the diamond to send the sample through. He also thinks that clinical trials with actual blood samples could be carried out easily, especially thanks to the fact that only a tiny sample would be required. For now, the team is looking at other proteins and substances in blood that could be detected using the sensor.