Attention, President Obama

Richard Muller’s new book Physics for Future Presidents: The Science Behind the Headlines is both fascinating and frustrating. On the fascinating side is the wide variety of poorly appreciated, presidentially useful facts he includes. For example, did you know that petrol has 15 times the energy of TNT per unit mass, and that just one of the 9/11 aircraft carried the energy equivalent of almost 1 kilotonne of TNT? No wonder that the terrorists’ planes did so much damage to a particularly vulnerable part of New York’s infrastructure. And did you know that because growing corn requires so much energy and fertiliser, ethanol fuel produced from corn in the US reduces greenhouse-gas emissions by only 13% compared with petrol, whereas ethanol produced from sugar cane in Brazil reduces emissions by 90%?

Other facts are more fun but of less immediate presidential usefulness. In a section on space, Muller, a physicist at the University of California at Berkeley in the US, notes that if you plan to travel to a spot one light-year away, it makes a lot of sense to accelerate at 1g (the standard acceleration due to gravity at the Earth’s surface) up to the halfway point and then decelerate at about 1g for the rest of the way. The result is a pleasant near-1g of gravity in your spaceship throughout the whole journey, and a respectably relativistic average speed.

Frustratingly, however, Muller has a tendency to talk down to his readers. In his book The First Three Minutes, the Nobel laureate Steven Weinberg wrote that he pictured his reader as a smart lawyer — not a physicist with Weinberg’s training, but an intellectual peer. Muller, unfortunately, does not follow this model. At one point he criticizes another physicist for being patronizing (“a common tone that some physicists affect”). Yet three pages later, after pointing out that you can warm your bedroom with a 1 kW electric heater for a dollar a night, he notes helpfully that “it does add up. A dollar per night is $365 per year”.

Later, the author explains that the di in carbon dioxide is due to the molecule having two oxygen atoms per carbon atom. Furthermore, he seems to feel that future presidents do not need to be comfortable with the metric system that is used all over the world, so in the book we do physics in degrees Fahrenheit, pounds and feet. Perhaps he needed this approach to make his course for non-scientists at Berkeley (which forms the basis for this book, and shares its name) so popular, but even the UK has largely abandoned imperial units. You may also want to take a moment to check the author’s facts. For example, his estimate of 450 feet for the blast radius from a 1 kiloton nuclear weapon is less than the conventionally accepted value.

Such lapses are a pity, because there is valuable and fairly deep analysis in this book. For example, consider the linear hypothesis for how cancer deaths vary with radiation exposure. This hypothesis starts from what we know about cancer deaths due to high radiation levels and assumes that the risk of death from cancer is linearly proportional to the amount of radiation exposure, with no threshold below which radiation is harmless. On this basis, Muller calculates that the Chernobyl nuclear accident should have resulted in 4000 additional deaths from cancer.

This number of deaths is a terrible tragedy, comparable to 9/11. However, Muller points out that given that a fifth of all people die from cancer, the total additional cancer deaths due to Chernobyl are epidemiologically immeasurable against the background of hundreds of thousands of deaths that would have occurred naturally in the area he considered. The only cases that can be clearly attributed to Chernobyl are the cases of thyroid cancer, due to radioactive iodine.

Another possibility is that the body’s natural ability to repair cells makes low doses of radiation (below a certain threshold value) less lethal than the linear hypothesis indicates, or even completely safe. For now, however, epidemiological studies cannot help us to evaluate the linear hypothesis. There is not even full agreement on linear projections for Chernobyl. I found a 1996 study in the International Journal of Cancer that put the projection for Chernobyl at more than 15,000 cancer deaths in all of Europe through to 2065, against a background of several hundred million. A president who has to make decisions about the disposal of nuclear waste and the risks of nuclear terrorism has to determine policy in an atmosphere of scientific uncertainty. She or he should understand the issues at this depth.

Muller unfortunately does not dig as deeply when he discusses climate change. He starts by dismissing some of the arguments presented by former Vice-President Al Gore in the movie An Inconvenient Truth as cherry-picking or even distortion. He argues that loss of Antarctic ice contradicts the climate-model prediction of increased snowfall in that region. He also points out that hurricane damage in the US, when expressed in dollars adjusted for inflation, has not increased over the last century — unlike the chart in as-spent dollars that Gore shows in his film. On the other hand, Muller expresses support for the Intergovernmental Panel on Climate Change’s judgement that the 1 °F global warming in the last 50 years is very unlikely to stem from known natural causes alone. But then, frustratingly, he largely skips over the crucial questions of how severe the impacts of climate change are likely to be, and when and how vigorously we need to act. This is a critical linking step to policy decisions.

Personally, I think climate change could have a serious impact, and the time scale for action combines the qualities of a sprint and a marathon. It is a long-standing joke that when former President Bill Clinton went out to jog he would start slowly and then ease off — perhaps even stopping for a hamburger. On this issue we need to start quickly, and since we will need a rapidly growing supply of clean energy to reduce emissions while meeting growing demand, we actually need to speed up over time.

On specific solutions to the issues of energy and environment, there are some frustrating lacunae. The sections on wind turbines and solar energy, for example, fail to mention the problems that arise from the fact that the wind blows intermittently, and the Sun does not shine at night. The book also omits the fact that wind power, unlike solar energy, is already almost cost competitive with fossil-fuel energy sources.

When discussing coal, Muller fails to mention that carbon-sequestration schemes may have trouble finding suitable underground storage sites all over the world. Safety and public acceptance also pose questions. We know that carbon sequestration can cause small earthquakes. What will happen when one-third of a billion tonnes of carbon dioxide is buried near a power plant?

Although the book does present many of the complexities of nuclear power and nuclear weapons, it does not dig deeply enough into the risks of nuclear proliferation from the greatly expanded use of nuclear power. What would a world that burns two million kilograms of plutonium a year look like, when the Nagasaki bomb needed only six kilograms?

Meanwhile, as a nuclear-fusion researcher, I can confirm that Muller is right to say that fusion will not be putting electricity on the grid in 20 years, but he might be wrong to say that this is the key information a president needs to know on the subject. Overall, nuclear power presents very complicated questions, which require more depth and care than this book provides.

My own advice to aspiring future presidents (and to president-elect Obama) is that you should treat this book as a starting point for understanding how physics affects many issues of importance to society. But more importantly, you should appoint a presidential science advisor with great stature and perspective, and quickly put together a broad and respected Council of Advisors on Science and Technology. You provide policy goals, these thoughtful scientific leaders provide accurate scientific information, and your staff will help you with the analysis needed to bring these together. The outcome of this interaction, as a House Science Committee staff member once suggested to me, is good decisions.

Once a physicist: Ali Parsa

How did your career start out?

First I did civil engineering as an undergraduate at University College London, but after I graduated in 1987 I stayed on to do a PhD, which was mostly about the physics of fluids.

It was a great time of my life and I really enjoyed my work. My time was divided, however, as I had to finance myself through my studies. I had a full-time job getting the PhD as well as a full-time job building a business to make the money I needed to pay for it.

What was that business?

It was a media-promotions company. It did very well and in 1995 I won a Prince of Wales award for being one of the best young business people in the UK. After I finished my PhD in 1995, I sold the company and joined Credit Suisse First Boston as an investment banker. That was a lot of fun, although I’m not sure I enjoyed it as much as I had enjoyed doing my PhD. I stayed in investment banking for almost 10 years, moving to Merrill Lynch and then Goldman Sachs.

Did you ever consider a career in science or engineering?

Not really. I always wanted to go into research, but once I was doing my PhD I found that life in academia was a bit different from the life I wanted. Also, to do physics and engineering research in my field, you need high capital expenditure on equipment. This makes it difficult to be world-class in the UK.

How did you come to start Circle?

I had my first child quite late in life, when I was in my mid-thirties, and that made me reassess my life. I didn’t see my wife enough and we agreed that one of us would have to make a change. I always wanted to go back to being an entrepreneur and investor, so I quit my investment-banking job and in 2004, after being approached by a friend who wanted to build his own hospital, we created Circle.

What is Circle all about?

We looked at healthcare, and at the issues that are faced by current generations, and we saw that three things were happening that were making the current model for the delivery of healthcare unsustainable: the ageing population; the advent of technology in healthcare; and, finally, the fact that the consumers of healthcare have fundamentally changed their attitudes and expectations. We realized that it was time to re-engineer the delivery of healthcare.

Our solution was that healthcare should be a services organization that is run “bottom-up”. Currently, it is organized top-down, like the manufacturing industry, and doctors and nurses have very little say in how things are done. Instead, the system should be run by the doctors and nurses. We currently have 2000 doctors — mainly consultants — who are all owners of the business, making Circle the largest partnership of doctors in the UK. We help them to create and then tailor their services to their patients’ needs.

Does your physics background help you now?

Physics gives you a great way of looking at the world. No problem is ever too big or too small to be solved, and that view of the world really helps. I think the study of physics is all about problem solving, and that’s also what life is all about.

Seeing the quantum world

My interest in scientific visualization began when I was an undergraduate student at the University of Calgary and saw the film “Powers of 10” for the first time. The film begins and ends with the image of a man asleep at a picnic. In between the first and last scene, we zoom out from the picnic to the vast reaches of space, changing the distance scale by leaps of powers of 10. After reaching the size of the observable universe, at 1024 m, the view zooms back to the picnicker and into his hand, ultimately focusing down to the level of a single carbon nucleus, at the scale of 10–16 m.

Scenes from the film embedded themselves in my mind as vivid memories. I remember thinking about scaling in nature for weeks afterwards. For me, this unforgettable animation made clear the power of visualization in conveying abstract scientific concepts.

Visualization in physics has a long-standing tradition, particularly its application to quantum physics. In the early 20th century, the pioneers of quantum mechanics struggled even to explain their research to their colleagues and to convince them of its validity. Quantum concepts were strange and controversial, spurring hot debates between the likes of Niels Bohr and Albert Einstein. Scientific visualization, in the form of thought or “Gedanken” experiments, turned out to play a critical role in pushing quantum physics forward to maturity, as illustrated by Erwin Schrödinger’s influential semi-tragic story of the cat in a box. Werner Heisenberg’s “microscope” is another famous example.

Heisenberg’s “microscope” was first invoked in a paper from 1927 (Z. Phys. 43 172), to explain his eponymous uncertainty principle. Heisenberg considered the very simple set-up of a gamma-ray microscope that could accurately detect the position of an electron, at the expense of disturbing its momentum. Although unfeasible in practice, the choice of a gamma-ray microscopy was appropriate because only a short-wavelength electromagnetic field can resolve electronic motion within the atom.

Quantum short animations

Five years ago I returned to Calgary to form a new quantum-information group in the department of physics and astronomy to complement the existing quantum-computing group in the department of computer science. Early in the process, my group started attracting the interest of the wider university community and of funding agencies that were keen to learn about quantum information science and technology. My colleagues and I were faced with the long-standing challenge of communicating the essential elements of quantum physics to a more general audience. Inspired by the value of the Gedanken approach to explain difficult concepts, and enthralled by the rapidly developing power of animation, I started to believe that a combination of the two would be the best approach to explain the nature of the most challenging tasks in quantum information.

I began testing this approach with the help of my students. The first animation, done in collaboration with my assistant at the time, Rolf Horn, concerned quantum teleportation. We chose to make an animation of the famous teleportation of the polarization state of a single photon to another photon, as first demonstrated in 1997 by Anton Zeilinger and colleagues at the University of Innsbruck in Austria. The Innsbruck experiments were widely reported by the media, and an animation to explain this famous protocol and its experimental realization seemed like an excellent opportunity to try this new approach to the visualization of quantum-information technologies.

We first developed “amateur” versions of the animation, which we then showed to professional animators as a pitch for possible collaborations. The first of such collaborations came in 2003. After a few years creating animated quantum-information films, my portfolio was now such that it finally enabled me to obtain significant financial support for a state-of-the-art quantum-computing animation.

Quantum computing is a rapidly growing interdisciplinary endeavour dedicated to developing computers that will be able to solve tasks beyond the reach of classical computers, such as factorizing extremely large numbers. The stakes are high and the outcomes very promising, so funding is not as difficult to obtain as it is in other areas of science. With the help of researchers Andrew Greentree, Lloyd Hollenberg and Ashley Stephens from the University of Melbourne in Australia and Austin Fowler of the University of Waterloo in Canada, plus the skills of professional animators Andrew and Darran Edmundson of EDM Studio Inc. and audio expert Tim Kreger, we created the four-minute animation titled “Solid state quantum computer in silicon” in February 2007.

Quantum computer: the movie

In making the animation, we adapted the “Powers of 10” approach of zooming in and out to show a computer at different scales. We wanted to reveal how the computer would look to its user and how the computer’s components would appear if it were taken apart. We used a hybrid computer made of quantum and classical parts by introducing a “quantum chip” built into the “classical chip”. We were careful to show technical complexities such as the sophisticated electronics required for controlling the quantum chip plus the quantum bits (or qubits) and the quantum gates themselves. The multiscale approach uses zooming to show the interrelationships between these concepts.

Creating a visualization for science or technology requires managing the delicate balance between scientific accuracy and aesthetic appeal. Indeed, negotiations between scientists and animators can be more time-consuming and costly than the animation process itself. The whole team has to discuss and agree on visual representations and timing before the professional quality animations are done, otherwise valuable and time-consuming animations have to be discarded.

In quantum-information science, the qubit is the basic logical element and is analogous to the bit, or binary digit, of classical computers. The difference is that a bit can only assume the values of 0 and 1, but a qubit can assume the logical 0 state, the logical 1 state, or any superposition thereof. Physically, the qubit can be regarded as a spin-1/2 particle such as an electron, with an up state and a down state.

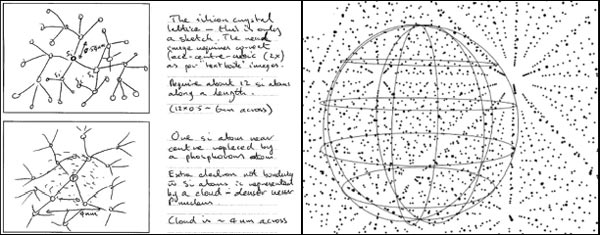
One of the challenges we faced involved depicting the “real” qubit and its environment while also showing its quantum-logical state. We chose to represent the qubit state as a point on a sphere, which is the standard in quantum information. The logical 0 state corresponds to the north pole and the logical 1 state to the south pole, with every other point on the sphere representing a superposition of these “polar states”.

For the type of silicon quantum computer in our animation, the physical realization of the qubit is the spin of the outermost electron of a phosphorous-31 atom that is embedded in a bulk silicon-28 medium. To make the qubit and its quantum state meaningful, we needed to show simultaneously the electron in the medium and the state of the electron spin.

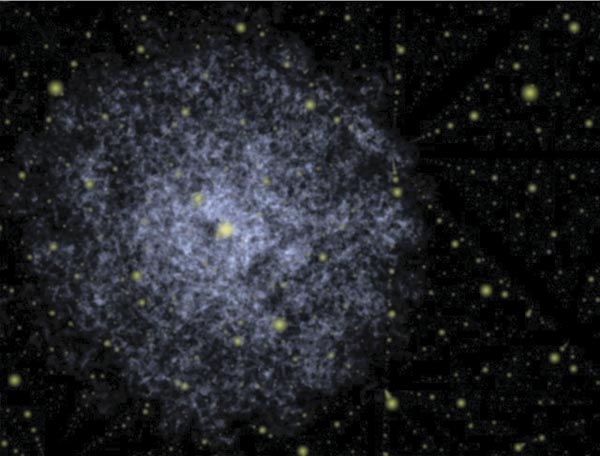
The animation zooms into the bulk medium and shows the silicon lattice structure plus one phosphorous atom embedded in the medium. The phosphorous-31 atom looks like a sun in a lattice-like galaxy of silicon-28. To show the electron of the phosphorous atom, we used the standard portrayal of electron orbitals as clouds. The cloud is quite large and extends over the silicon lattice structure in every direction. The interaction between the electron cloud and the silicon lattice results in interference fringes in the cloud structure.

Depicting cloud interference is essential because of the importance of the overlap between the electron density and the nucleus. Magnetic fields extend throughout the quantum computer so that individual control of the electronic spin state, which serves as the qubit, requires precession of one atom’s electron while the others remain unchanged. This direct control is only possible by creating local electric fields via metal plates on the nearby surface of the silicon chip. The electric field distorts the electron cloud, as we show in our animation, and the distortion modifies the overlap of the electron cloud with the atomic nucleus. The visualization of the electron cloud and its distortion helps the viewer understand how individual electron spins can be controlled. The electron cloud conveys to viewers the distribution of the location of the electron orbiting the phosphorous-31, but the spin state has to be shown as well: quantum-information aspects have to be depicted alongside the physics. As discussed above, the spin state can be represented by a point on a sphere. We do this by placing a planet-like body near the phosphorous “sun” that shows its spin state.

The qubit is prepared and controlled by applying both global magnetic fields and local electric fields. We show the magnetic fields as broad faint lines in the solid-state medium and depict the precession of the electron’s spin state on the planet as a response to the application of these magnetic fields. The electric field is used to modify the “hyperfine splitting” of one atom so that its electronic spin qubit is individually addressable.

Meanwhile, we show the electric field as curved blue lines emanating from small metal structures on the surface. The electric field causes the electron cloud to change shape, and this shape change alters the cloud’s overlap with the phosphorous-31 nucleus, hence the hyperfine splitting. The precession of the electron spin is complicated by the presence of both a magnetic and an electric field, and we convey this complexity by showing the trajectory of the representation of the qubit spin on the “planetary sphere”.

Qubit control is just one step in quantum computing. In the animation we show two qubits and the application of the controlled-not, or exclusive-or, gate to the qubits, the readout of these qubits, and how the controlled-not gate would be performed using 28 qubits over a sequence of 45 steps, in a scene I call the “quantum error-correction dance”. For each step we need to make decisions about how to combine physical and informational entities in an aesthetic and meaningful way.

The power of visualization

Visualization of scientific knowledge is not easy or cheap, but it is rewarding and useful. Animated films are valuable tools for explaining difficult, abstract concepts such as quantum computing in the classroom. Unfortunately, at the time that it was created, our film was not widely released, but segments of it can now be viewed via an article in the December 2008 issue of New Journal of Physics (New J. Phys. 10 125005), and it is being used to great effect by the Australian Centre for Quantum Computer Technology partners, including in my classes at Calgary. The film has also been presented as part of quantum-information summer schools, including the Eighth Canadian Quantum Information Summer School in Montreal in 2008 and the International Summer School in Quantum Information Processing and Control at the National University of Ireland, Maynooth, in 2007. This animated film is an example of how visualization could be used in the future to help to effectively convey complicated scientific concepts and sophisticated emerging technologies.

Shifty constants

In my column in February, I discussed several fundamental constants, such as π and Planck’s constant, h, that, I thought, might not be expressed with maximum beauty and efficiency. I asked readers for other candidates and received dozens of replies. Many of you were particularly concerned about whether it would be better to define π as the ratio of the circumference of a circle to its radius, rather than its diameter.

In February I cited an article from 2001 called “π is wrong!” by University of Utah mathematician Bob Palais that was published in Mathematical Intelligencer (23 3), which identified formulas that would be simpler with such a redefined π. In response to my column, Palais wrote that he started thinking about π and possible simplifications when he noticed, to his bafflement, that his students would reach for their calculators to work out cos(π/2) or sin(π/2), when he had gone to the trouble to devise questions for which they did not have to do so.

But Palais noted that his sense of urgency was not widely shared. He mentioned an entry from August 2007 by the computer scientist Bill Gasarch on the blog Computational Complexity entitled “Is pi defined in the best way?”. It looks at two examples from mathematics. One concerns the expansion of the zeta function ζ(n) = Σrn, which is a little, but not much, simpler if 2π rather than π is used. The other involves calculating the formulas for the volume and surface area of an n-dimensional sphere, for which it is only a matter of taste whether formulas with 2π are better.

A base affair

Indeed, most respondents seemed less aroused than intrigued that π, and other constants of mathematics and science, could be amended at all. Some proposed different mathematical structures that might be profitably changed, such as bases. Richard Hoptroff, a physicist who works for the software firm HexWax in London, wrote “Don’t you think the use of base 10 has passed its sell-by date? It’s a bit arbitrary now that we don’t need to count on our fingers any more. How about following the computing world’s example and switching to the far simpler 2?” Using base 2, he noted, would eliminate suspicious irrational behaviour such as thinking that 1101 is unlucky, or that 1010011010 is the number of the beast.

And Aasim Azooz of Mosul University in Iraq said he had wondered if the sacred time variable, t, which can only be defined in terms of two successive events, could be replaced with a variable such as entropy — and how such a substitution might change physics. But he confessed he had been too distracted by other events in his country to focus on the issue.

Those who preferred one version of a constant usually admitted it to be based on convenience. As Robert Olley from the University of Reading noted, “Even the difference between the two versions of Planck’s constant h and h depends on whether one is thinking physically in terms of frequency ν or mathematically in terms of angular momentum ω. Physics is not applied mathematics!”

Meanwhile, Igor Zolnerkevic, a former physics graduate student and now a science writer in Brazil, observed that a maximally efficient theory only requires two dimensional constants. He cited a paper by George Matsas from the Universidade Estadual Paulista in Brazil and colleagues, entitled “The number of dimensional fundamental constants” (arXiv:0711.4276), which has implications for what a brutally efficient approach to constants would look like, and suggests that certain constants are more fundamental than others.

But Matthew Thompson of the Naval Research Laboratory in Washington, DC pointed out that we rarely prefer such brutal efficiency, citing cases involving “constant pairs” where science needs only one constant but uses two. He mentioned the Nernst equation in electrochemistry R/F = k/E, where R is the gas constant, k is the Boltzmann constant, E is electric potential and F is the Faraday constant, i.e. the electric charge carried by a mole of electrons. “Why”, asked Thompson, “do you need F and R? We keep them since those formulas are a bit more efficient in real-world terms than their microscopic brethren.”

My colleague at Stony Brook Fred Goldhaber explained to me why convenience in constants fails to stir physicists. “Making the units more efficient may simplify people’s thinking,” he suggests. “It may simplify teaching. But it doesn’t make physics progress. It does not help us achieve a new level of understanding of the world. What physics are we doing today that we could not do with old non-SI units? And with computers to do the calculations, it no longer even matters how stupid the units are. What does matter is that people working on the same project agree on their choice of units, as shown by the Mars Climate Orbiter mission failure!”

The critical point

The subject of changing constants triggered several letters about units, and the issue generated much more passion than mathematical constants. I received half a dozen letters from metrologists, for instance, about the movement to tether the SI base unit, the kilogram, not to an artefact but to constants of nature, such as Planck’s constant or Avogadro’s number. In the words of a 2006 article by Ian Mills from Reading and colleagues (Metrologia 43 227), “In the 21st century, why should a piece of platinum–iridium alloy forged in the 19th century that sits in a vault in Sèvres restrict our knowledge of the values of h and me [the mass of the electron]?”

The passion seemed stimulated by two factors: the prospect of bringing additional precision to the kilogram over the long term; and the sense that an SI unit’s role is more completely fulfilled if it is tied to a true invariant of nature. But other respondents wondered whether such a shift really amounts to an achievement of new knowledge or understanding, or only to reshuffling our conventions. That is a discussion for another time.

Space to explore

When someone at a party asks you what you do for a living, working in space science is always a plus — you are virtually guaranteed to get a few raised eyebrows and some interested questions. While the day-to-day reality of my job does not quite match up to the rocket scientist clichés, it is certainly never boring.

I joined the Space Science and Technology Department of the Rutherford Appleton Laboratory (RAL) in Oxfordshire, UK, in 2002. While many people working in space science have always wanted to be involved in the subject, my career path was less planned. I enjoyed physics at school because I liked knowing how the world fits together, so it was not a difficult decision to study the subject at Manchester University.

After graduation, however, I was not keen on settling down to a regular job right away, and a career in research seemed a little too specialized. Instead, I decided to do a Master’s degree in applied optics at Imperial College London, which led to a job at a small firm designing commercial optical systems (such as specialist cameras for the electronics industry). After nine years there, I was looking for a change, and a job advert in Physics World for an optical physicist at RAL led me to work on space instruments.

Our department at RAL designs, develops and manufactures scientific instruments for both space-science missions and ground-based astronomy projects. A typical mission might have several scientific instruments on one satellite, each dedicated to making a particular measurement. Such projects are impossible to carry out in isolation, and we work with university groups, companies and national space agencies to make each project a reality. Our role in a project can range from defining the scientific requirements and designing the instrument right through to assembling and testing the flight hardware.

Of gravity and glue

When I first joined RAL, I worked on the Laser Interferometer Space Antenna (LISA) Pathfinder project. Its aim is to detect gravitational waves produced by massive objects like black holes, and I was part of the team that designed and constructed a prototype interferometer for the satellite, which is due to be launched at the end of 2009 (see Physics World September 2007 pp10–11, print version only).

One of the aims of LISA Pathfinder is to measure displacements of a pair of gold–platinum cubes that are free-falling in space. A passing gravitational wave will change the separation of the cubes but, because gravity is a relatively weak force, the effect is tiny and we need to be able to sense positions to an accuracy of picometres (10–12 m) to detect a gravitational-wave signal.

The project became especially entertaining when we started building the interferometer. The lenses and mirrors were stuck onto a glass baseplate using a technique that ensured the bond line would not flex under changes in temperature — essential for reducing displacement noise due to thermal expansion that might otherwise swamp the gravitational-wave signal. Although the experiment will be operated in a room-temperature environment stable to millikelvin, tiny movements of the optics can still be enough to ruin the measurement.

Unfortunately, the glue we had to use took only about 30 seconds to cure. Within that short time, each part had to be precisely aligned, with little possibility of repair if something became stuck in the wrong place. This required meticulous preparation and planning, and ultimately a steady hand and nerve. However, after several weeks of tense work in the lab, by June 2004 we had built an instrument with a unique measurement capability. I have always enjoyed having a job with a tangible end product, and it is particularly satisfying when you know that you have built the first example of something.

Room for creativity

One of the advantages of working on scientific instruments is that you get involved in a variety of projects spread over many areas of physics. In my current job I can move between topics like solar physics and environmental observation of the Earth as well as gravitational-wave detection. This often means being the person in the room who knows least about a subject, particularly when the project scientists have been working on a proposal for many years. Asking questions all the time can feel intimidating, but if you enjoy thinking on your feet, then it can also be a stimulating way to learn.

Having the chance to be creative is another attractive aspect of working in space science. My job is fundamentally about problem solving, and when you are trying to do new science, you often need to find solutions without a textbook to guide you. You always want the next experiment to do more than the last one, and this pushes the boundaries of your ingenuity as well as the limitations of current technology and materials.

One downside of working in space science is that projects can take a long time to come to fruition. Occasionally a project is cancelled and you may find that your hard work has been in vain. When this happens, you need a robust, long-term outlook and the ability to shrug off disappointments and start looking for the next challenge. Fortunately, there is always a new project around the corner and each comes with a unique set of problems to get your teeth into.

On a day-to-day basis, my job involves a mixture of project management, instrument design, and assembling and testing hardware. I find it refreshing to have a variety of roles, and sitting round a table with a team of people to figure out how to solve a problem can be a welcome break from hours spent in front of a computer screen. Physicists who are used to logical problems with deterministic outcomes, however, may find managing budgets, schedules and teams of people a bit of a culture shock.

People (and sometimes budgets) are much less predictable than experiments, and to get the most out of the opportunity to build an instrument, you need to balance a mission’s science requirements against competing factors like finite budgets and timescales. This can be one of the most difficult aspects of the job, but it is also one of the most rewarding; when you get it right, you have the personal satisfaction of shaping the design of an instrument and an experiment.

For those interested in working in a similar field, my advice would be to keep your eyes open for opportunities and go in the direction that most interests you. There are opportunities to work in national laboratories like RAL, universities, commercial space companies and agencies such as the European Space Agency and NASA. A degree in physics and a willingness to have a go at things will get you a long way. I have found that there is no well-defined career path for a physicist; this can be a bit daunting at times, but it also means that you can find yourself doing things like building instruments for space missions and keeping people entertained at parties.

Renewable energy source inspired by fish

An engineer in the US has built a machine that can harness energy from the slow-moving currents found in oceans and rivers around the world. By exploiting the vortices that fish use to propel themselves forward, the device could, he says, provide a new kind of reliable, affordable and environmentally friendly energy source.

Turbines and water mills can generate electricity from flowing water, but can only do so in currents with speeds of around 8–10 km/h if they are to operate efficiently. Unfortunately, most of the currents found in nature move at less than 3 km/h.

The new device is called VIVACE, which stands for vortex induced vibrations for aquatic clean energy, and its inventor claims it can operate in such slow-moving flows.

VIVACE has been developed by University of Michigan engineer Michael Bernitsas, and in its prototype form exists as an aluminium cylinder (91 cm long with a diameter of 12.5 cm) suspended by a pair of springs inside a tank. The tank, located in the university’s marine renewable energy laboratory, contains water that flows across the cylinder at around 2 km/h. The device does not convert the energy of the flow directly into electricity but instead exploits the vortices that form on opposite sides of any rounded object placed in a flow (J. Offshore Mech. Arct. Eng. 130 041101).

Vortex-driven fish

As such, it works like a moving fish. Fish cannot propel themselves forward using muscle power alone; instead they curve their bodies so that they form a vortex on one side of their body, straighten out, and then curve the other way to form a vortex on their other side, in order to glide between vortices. VIVACE remains in a fixed position in the water but is pushed and pulled by the vortices on either side, and these vibrations are then converted into electrical energy (the current cylinder is smooth, but future versions will have scale-like structures on the surface to enhance vortices).

It dawned on me four years ago that I can enhance these vibrations to harness energy Michael Bernitsas, University of Michigan

Bernitsas explains that engineers usually do all they can to suppress such vibrations, which can occur in either water or air, as they can cause enormous damage. They were, for example, responsible for destroying the Tacoma Narrows bridge in the US in 1940. “But,” he says, “it dawned on me four years ago that I can enhance these vibrations to harness energy. My colleagues and I searched the scientific literature and patents and found out to our surprise that no one had done this before.”

The total amount of energy generated by the Earth’s slow-moving currents is vast, but the density of this energy is low. This means that the VIVACE technology, like any other ocean-based device, will only ever be part of the solution to the world’s energy needs. However, Bernitsas believes it has a number of advantages over alternative ocean-based sources, pointing out that, unlike wave devices, for example, it is unobtrusive, and should also pose no harm to marine life.

Tests in the Detroit River

The group is currently installing a 3 kW device in the Detroit River to provide energy that will light a new pier being built there. Bernitsas says that the technology could then be scaled up by constructing arrays of cylinders, either suspended from ladders or built upwards from the river or sea floor, in order to build power stations large enough to power tens of thousands of houses. The electricity from such a plant would be cheaper than many alternative renewable sources, he adds — some 5.5 cents per kilowatt hour, compared with 7 for wind and at least 16 for solar.

“The device is highly scalable”, said Bernitsas. “It could be used to build small devices of 5 kW, medium of 50 kW, larger of 500 kW and put them together to build large stations of 10 MW”, he said. “The next step up is 100 MW and finally huge offshore underwater stations of the size of 1 GW, the size of a nuclear power plant”.

Stephen Salter of Edinburgh University, who has carried out research on tidal and wave energy, believes that low-velocity flows are an important potential source of renewable energy. He points out that there are several kinds of structure that could be used to harness this energy, including, for example, hydrofoils. But he believes that cylinders could turn out to be cheaper and more efficient than the alternatives, if they can be made to move with sufficiently high velocities.

Bernitsas has founded a company called Vortex Hydro Energy to commercialize the technology.

Breakthrough in the physics of ice-shelf break-up

Ice shelves are the floating expanses that form when the ice sheets of Greenland and Antarctica flow into the surrounding ocean. These ice shelves ultimately break up and form icebergs in a process called “calving”.

To date there hasn’t been a law based on physical principles that explains ice-shelf calving, which has made it tricky to model ice-sheet behaviour. Predicting the future of the ice sheets under global warming is of considerable interest to scientists and therefore a physical model of calving would be very welcome.

Now Richard Alley of Pennsylvania State University and colleagues at five other academic institutes in the US have come up with a simple law that explains much calving behaviour (Science 322 1344).

Earthquake prediction comes to mind, or guessing whether a tea cup pushed off the table will break or bounce Richard Alley, Pennsylvania State University

“Fracture-mechanics problems are invariably difficult,” explained Alley. “Earthquake prediction comes to mind, or guessing whether a teacup pushed off the table will break or bounce upon hitting the floor. With the teacup, a drop from 1 mm high won’t break it, and a drop from 100 m almost surely will — one term, the height of the drop, explains a whole lot of the behaviour. Our hope was to find such a dominant term in calving of bergs from ice shelves.”

Surprisingly simple hypothesis

And indeed, that’s what the researchers managed to do. “Our first hypothesis was that spreading is required to open a crack that isolates a new iceberg, so the spreading tendency in the direction of ice and berg motion should play the role of the height of your teacup,” explained Alley. “Almost surprisingly, this simple hypothesis explains most of the variance in a data set we assembled to test [it].”

The team’s basic equation for ice calving is the rate of spreading times the width of the shelf times thickness multiplied by a constant. For narrow shelves between two ridges, the sides hold back the ice, slowing the overall movement and making it harder to break the ice. And thicker ice shelves tend to spread more quickly.

“The spreading rate can be calculated from ice thickness and a few other things that are already solved for in numerical models, so we have provided a practicable calving law,” said Alley. “At present, models rarely if ever calculate physically where the ice ends, instead stopping the model before the ice ends or using some other relation that is not fully physical.”

Pinning points

According to Alley, in its simplest implementation this calving law requires a “pinning point” such as an island to stabilize an ice shelf. “And we typically see such pinning points,” he said. “Without such stabilization, the law almost always produces unstable shelves, that either elongate greatly or calve back rapidly. We believe this is an interesting line of inquiry to be followed.”

The team used both new and previously published data, putting together a data set for a representative range of ice shelves.

Now the team plans to follow the discussion that emerges following publication of their work and to “make sure that new data sets coming in remain consistent with our results”. The researchers are also implementing the law in models to further understand the implications. “We believe this matters for understanding the history and projecting the future of ice shelves,” said Alley.

NJP shines a light on cloaking

njp.jpg
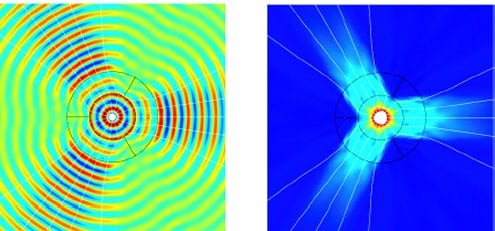
Simulation of a treble beam splitter by Xiaofei Xu et al

By Hamish Johnston

Our very own New Journal of Physics has just published a special issue on cloaking and transformation optics — a subject dear to our hearts here on physicsworld.com.

The first article in issue — by cloaking wizards Ulf Leonhardt and David Smith — begins with a quote from the late Arthur C Clarke that sums the field up nicely. “Any sufficiently advanced technology is indistinguishable from magic”.

So, what kind of magic has been unveiled in the (virtual) pages of this special issue?

(more…)

Modelling civilization as ‘heat engine’ could improve climate predictions

The extremely complex process of projecting future emissions of carbon dioxide could be simplified dramatically by modelling civilization as a heat engine. That is the conclusion of an atmospheric physicist in the US, who has shown that changes in global population and standard of living are correlated to variations in energy efficiency. This discovery halves the number of variables needed to make emissions forecasts and therefore should considerably improve climate predictions, he claims.

Computer models used to predict how the Earth’s climate will change over the next century take as their input projections of future man-made emissions of carbon dioxide. These projections rely on the evolution of four variables: population; standard of living; energy productivity (or efficiency); and the “carbonization” of energy sources.

When multiplied together, these tell us how much carbon dioxide will be produced at a given point in the future for a certain global population. However, the ranges of values for each of the four variables combined together leads to an extremely broad spectrum of carbon-dioxide emission scenarios, which is a major source of uncertainty in climate models.

Changes in population and standard of living might best be considered as only a response to energy efficiency Timothy Garrett, University of Utah

Timothy Garrett of the University of Utah in the US believes that much of this uncertainty can be eliminated by considering humanity as if it were a heat engine (arXiv:0811.1855). Garrett’s model heat engine consists of an entity and its environment, with the two separated by a step in potential energy that enables energy to be transferred between the two. Some fraction of this transferred energy is converted into work, with the rest released beyond the environment in the form of waste heat, as required by the second law of thermodynamics.

However, the work is not done on some external task, such as moving a piston, but instead goes back to boosting the potential across the boundary separating the entity from the environment. In this way, says Garrett, the boundary “bootstraps” itself so that it can get progressively bigger and bigger, resulting in higher and higher levels of energy consumption by the entity.

Like a growing child

Garrett points out that this model serves as a basic description of what happens to a growing child, which consumes more and more energy as it increases in size, in turn allowing it to grow, resulting in still greater energy consumption, and so on. But he also believes that the model can describe the functioning of humanity as a whole, with the boundary — the sum of people, their buildings, machines etc — continually increasing in size as energy is continually removed from primary resources such as oil, coal and uranium, in turn allowing ever higher levels of energy consumption.

The goal for Garrett was to work out if there is some way of linking this thermodynamic description to economics. He believes there is. He argues that “if what physically distinguishes civilization from its environment is a thermodynamic potential, then civilization implicitly assigns monetary value to what this potential enables — the rate of energy consumption”.

Garrett proposes that the global rate of energy consumption is therefore proportional to the world’s total (inflation-adjusted) economic production generated to date. And this, he shows, leads to an interdependence between population, standard of living (in other words, economic production per person), and energy efficiency which means that only energy efficiency need be considered when predicting future trends of global energy consumption. Combined with predictions of how green or otherwise the world’s energy sources will be in the future then allows carbon-dioxide emissions to be forecast.

Bootstrapping civilization

“So, perhaps surprisingly,” he writes in his paper, “changes in population and standard of living might best be considered as only a response to energy efficiency. As part of a heat engine, creating people and their lifestyles requires energy consumption. Doing so efficiently merely serves to bootstrap civilization into a more consumptive (and productive) state by increasing the dimensions of the boundary separating civilization and its environment.” He also notes that gains in energy efficiency therefore accelerate rather than slow energy consumption, contrary to conventional wisdom.

To support his argument, Garrett plotted the relationship between global energy consumption and accumulated economic production using energy statistics from between 1970 and 2005, and found that the two were indeed proportional. He admits that this is not a very long sample period but points out that energy consumption has doubled and global GDP has tripled in this time. He says his work has received positive reviews from physicists, but less enthusiastic responses from economists.

Peter Cox, a climate scientist at the University of Exeter in the UK, says he finds the work “intriguing”, but adds he is “a little concerned that arguments from linear thermodynamics are being applied to a system — the human-environment system — which is clearly far from equilibrium.”

European synchrotron secures €177m upgrade

Europe’s first multi-national synchrotron has been given the green light for a €177m upgrade that will see the facility improve the experimental resolution of a third of its existing 40 experimental beamlines.

The European Synchrotron Radiation Facility (ESRF), located in Grenoble, France, provides intense beams of X-rays that are used by over 5000 visiting scientists each year to probe the structure and properties of materials for experiments in condensed-matter physics, biology and materials science.

The planned upgrade, to be fully completed by 2015, includes improvements to beamline optics that will focus the diameter of the X-ray beam to just 10 nm. This will allow researchers to study nanometre-scale objects such as quantum dots as well as resolve the structure of objects smaller than one micrometre.

The upgrade will try to meet the increasing demands of biologists who use synchrotron radiation to solve the structure of new drugs. New instruments at the ESRF will be able to measure thousands of biological samples per day.

Copyright © 2025 by IOP Publishing Ltd and individual contributors