Silicon achieves optical success

Although the prototype device’s performance is still far below that of commercial products based on materials such as lithium niobate (an alloy made of lithium, niobium and oxygen) and III-V semiconductors, the news is important. It suggests that silicon, the basis of cheap yet powerful computer chips, could also make high-speed optical switches. In future, the hope is that both optical and electronic functions could be combined on cost-effective silicon super-chips made at high-volume microelectronics factories.

“Breakthrough developments such as this fast silicon modulator suggest that a low-cost silicon optical superchip could soon be a reality,” said Graham Reed, a semiconductor scientist from the University of Surrey, UK, in an accompanying review of the breakthrough in Nature. “It [silicon] is already the world’s favourite electronic material and could yet come to dominate the photonics industry as well.”

The silicon-waveguide modulator is based on a so-called Mach-Zehnder interferometer design where a silicon waveguide is split into two arms that recombine a short distance later. Applying a voltage to one of the arms causes a small change in the refractive index of the silicon and, through optical interference, controls the amount of light leaving the device.

Intel’s prototype operates at the all-important telecommunications wavelength of 1.5 microns and requires a drive voltage of about 8 volts to work. Although it is currently inferior to commercial lithium niobate modulators, the Intel team is confident that it can significantly improve device performance by tweaking the design.

Fuel cells turn to alcohol

Fuel cells burn hydrogen to produce electrical energy, with water as the only by-product. However, most of the hydrogen used in fuel cells is produced from natural gas, which means that the energy is not clean. “Hydrogen makes no sense unless it comes from renewable fuels because fossil fuels inevitably produce carbon dioxide,” says Schmidt. “Ethanol is an available and efficient store of renewable energy.”

Ethanol made from corn has already been used to power some car engines, but the process is only 20% efficient. Moreover, all traces of water must be removed before the ethanol can be used as a fuel, which adds to processing costs. Now, the Minnesota-Patras team says that if ethanol was used to make hydrogen for fuel cells, the process would be 60% efficient and the ethanol would not need to be pure.

Schmidt and colleagues passed an ethanol-water-air mixture over a porous metal catalyst containing rhodium. The reaction on the rhodium surface heated the catalyst to 800°C and produced a mixture of hydrogen, recyclable carbon dioxide and some minor by-products in a few milliseconds. The conversion rate of ethanol to hydrogen was over 95%. Furthermore, the process minimized the build up of carbon – normally observed when ethanol burns – that would have deactivated the fuel cell. This allowed the reactor to operate for as long as 30 hours.

The team believe that it should be possible to produce five molecules of hydrogen for every molecule of ethanol – rather than four as at present – once the process has been optimised. Electricity from a perfect fuel cell would cost only $0.04 per kilowatt-hour says the team, and the first applications could include small remote and portable devices.

Radical molecule breaks the rules

Hund’s rule states that electrons occupy orbitals one at a time before they begin to pair up, and that all the electrons in singly occupied orbitals point in the same direction. Although Hund’s rule can be violated in transition-metal complexes, such behaviour had never been observed in a non-transition metal compound until now.

Paul Wenthold of Purdue University, Anna Krylov of the University of Southern California (USC) and co-workers made the molecule – called 5-dehydro-m-xylylene or ‘DMX’ – by reacting a xylene compound with fluorine. When they used mass spectrometry to analyse the structure they found that one of the three unpaired electrons in the molecule pointed in an opposite direction to the other two.

Molecules that contain unpaired electrons are more reactive than other molecules and are known as radicals. “This is the first time we’ve seen this happen in an organic tri-radical,” said Wenthold. “It opens up a few new possibilities for materials designers.”

These possibilities include using the compound to make molecular magnets, says Krylov. “People are already trying to build magnets from materials other than metals, such as polymers,” she said. “Since magnetism is related to the behaviour of unpaired electrons, this compound could be used as a building block for such polymers, leading to non-metallic magnets.”

The team now plans to study the molecule in more detail. “The unique property this substance exhibits will be of interest in its own right – even before we come up with any actual applications for it,” said Wenthold.

A reading and writing revolution

Wherever and whenever people need to work with information you will find paper. For most of us paper provides the best way to understand something, but the reasons why are not obvious. Research shows that there is a sophisticated interplay between people and paper. The simple act of reading a paper document, for example, is invariably a two-handed operation, which is not normally the case for e-books or PCs. It seems that the interaction between our hands and the page actually aids cognition in ways that are not fully understood.

We also use pens and other writing implements when working with paper, not just to annotate and mark documents but also to point and gesture, or even to tap on desks to the frustration of others. Furthermore, this is not something that is acquired during education – it is a natural human trait. These reading and writing practices may not be understood, but over a period of 2000 years they have evolved into a highly efficient communication medium.

Despite its ubiquity and strengths, however, the paper-and-pen approach is limited by today’s media standards. Paper is very good for communicating static images, but electronic media can incorporate motion and sound, and can thus communicate certain information more clearly. Digital media and the pen-and-paper paradigm have strong complementary functions, but melding them together could lead to even more efficient ways to communicate and comprehend. This reading and writing revolution is being pioneered by several companies worldwide and was the subject of a workshop held at King’s College, London, in December last year. The distinction between what is paper and what is a computer is about to become blurred.

Imagine filling out an address and ticking a box in newspaper advert, only to receive the product a few days later without having to cut out or post a form. Or envisage paramedics being able record a patient’s condition in the ambulance so that it is registered with the hospital computer system by the time they arrive. The more romantic among you could soon be able to send a personalized Valentine message, such as doodle of a heart, to your partner’s mobile phone.

Paper displays

The most obvious step towards such technology is to make a computer-generated display on a paper-like material. Ideally we would like to use real paper for this, since it aids cognition and is also portable and versatile. This, however, is some way off. Today the best paper results are seven-segment displays built from chemicals printed on paper substrates, which can display simple numerical information. Several researchers have developed fully functional, pixel-based displays on glass, and today’s prototypes are being made on plastic substrates that are thinner, cheaper and more flexible.

Paper-thin display technologies require a “chromomorphic” component to affect changes in colour. This is normally achieved using an electric field or a small current, which is applied across the thickness of the display material. The driving electronics to address each pixel are generally built in to the back of the display and a second, counter electrode lies between the display material and the user. The ambition of many is to print the driving electronics on the display sheet, possibly using conductive organic materials, because this would enable thinner and more cost-effective displays to be produced. Researchers at Linköping University in Sweden and Plastic Logic in Cambridge are both working on such technologies.

Several different chromomorphic systems are being developed. Gyricon in Michigan in the US, for example, favours a sheet containing millions of bi-coloured microscopic spheres. Each sphere has an electrical dipole moment so that it can rotate between the two colours when an electrostatic field is applied. E-Ink in Massachusetts uses microspheres that contain dark and light particles with opposite charges, which undergo electrophoretic movement in a field. The Swedish company Acreo and NTera in Ireland, on the other hand, use different types of electrochromic chemicals that change colour when they are charged. Most recent on the scene are electro-wetting surfaces patented by Philips, which enable coloured oils to cover or expose white surfaces under the influence of an electric field. These devices all produce a two-colour display – often using blue and white – but with more complex driving electronics they are, in principle, capable of a full-colour output.

Few of these products have reached large-scale commercialization, but several test installations exist. Personal data assistants (PDAs) are seen as a natural application for chromomorphic technologies, but the real market explosion will take place when the technology allows the production of TV screens that can be rolled up. As well as greater portability, such screens could be used to decorate walls or other flat surfaces. Moreover, the TVs of the future will offer more personalized content than today’s models, which means it is important that people can engage with the technology as they currently engage with paper.

Paper-like input

The desire for paper-like display devices is well recognized, but the concept of paper-like input devices is rather more obscure. The first paper-like input devices were graphic tablets that supported writing, which required a lot of electronics behind the “paper” to detect the position of a pen electromagnetically. Several decades ago companies such as Xerox began to experiment with video-capture systems, whereby a camera installed in the ceiling above a worker’s desk was used to track the position of the pen and paper. Today video-free graphic tablets exist that use ultrasonic triangulation to capture the motion of special pens on A4 pads, such as Ink Link, or on flip-charts such as Mimio.

These techniques are all clever and widely used, but the majority of them require some external device such as a video camera or an ultrasonic detector. Furthermore, the co-ordinate system that is used to detect position is set by the detector rather than the paper, which detracts from the portability and flexibility of paper. A direct pen-and-paper paradigm is therefore the ultimate goal in tracking the position of a pen on a writing surface.

There are currently two radical examples of such position-dependent detection paper. The first is from a small Swedish company called Anoto, and forms the basis of Nokia’s Digital Pen, Logitech’s Io and Sony Ericsson’s Chatpen. These devices allow users to convert handwriting into digital images that can be sent via e-mail or even posted automatically on web-diaries. The second example – which comes from a European Union consortium known as Paper++ – takes a different approach in which users interact with pre-printed documents.

The Anoto technology relies on an almost invisible pattern of pre-printed dots on the paper and a great deal of intelligence built into the pen. Instead of scanning and recognizing single lines of text, the Anoto pen uses a built-in CCD camera to view the infrared-absorbing dots, each of which is slightly misplaced from a square array. The relative positions of dots in a six-by-six array maps to a unique x-y position in a vast possible address space. Images are recorded and analysed in real time to give up to 100 x-y positions per second, which is fast enough and of sufficient resolution to capture a good representation of all handwriting. The equivalent of several A4 pages can be recorded and stored in the pen before being transmitted to a PC. <textbreak=Paper++> The aim of the Paper++ project, which is led by researchers at King’s College, London, is quite different. The idea is to annotate normal printed paper so that it can directly interface with all types of digital media through a cheap and simple pen-like device. Printed documents would be overprinted with an almost invisible pattern of conductive ink that uniquely encodes the x-y location on the document. This code can then be interpreted by a pen with concentric electrodes that is swiped over the paper in a tick-like motion. The pen converts the code into a frequency-modulated signal that is input to the microphone socket on a PC, or to any other digital device. The sound is then translated to an x-y location. This location, in turn, is mapped to a resource that may be a sound byte, a video clip, a URL, a telephone number or any other resource that the user wishes to launch.

Numerous companies worldwide have discovered that paper is a resource that will not be replaced by today’s computing resources. The paperless office, it seems, is indeed a myth. Industry is therefore investing heavily in closing the gap between the human functionality of pen and paper, and the technical competence of computing. The outcome is surely set to change our lives in the very near future.

Detecting the colours of darkness

The average level of the sea is determined by tidal waves (which should not to be confused with the wind-driven waves that are superposed on them). Every 12 hours the water level oscillates between high tide and low tide, but the pattern of tidal waves is surprisingly complex. For instance, the high tide in the North Sea occurs at 3 p.m. at all points along the line of equal phase indicated by 0o, and at 4 p.m. at points along the 30o line, while the low tide occurs at 3 p.m. along the 180o line and so on.

But what about the points where the different lines intersect? Clearly the phase is undefined, or singular, at these points,which means that there are no high or low tides there.

Phase singularities like these are also common in optics, and there has been great interest in the properties of such optical vortices in recent years. Now Jonathan Leach and Miles Padgett of Glasgow University have studied the chromatic structure of an optical vortex for the first time, and confirmed predictions about their properties (New J. Phys. 5 154).

In the February issue of Physics World Taco Visser from the Department of Physics and Astronomy at the Free University in Amsterdam in the Netherlands describes these results in more detail.

Let’s talk about information

The year 1900 is a singularly significant year in science, celebrating as it does the birth of both quantum mechanics and molecular biology. The key papers of Max Planck will, of course, be familiar to most physicists. In biology, however, it took three researchers working independently in Amsterdam, Berlin and Vienna to rediscover Mendel’s laws of heredity, which he had originally published in 1866 in the transactions of the Scientific Society of the City of Bruenn (now Bron) in the present-day Czech Republic.

A century later on 6 June 2000, at a ceremony at the White House, the complete record of the human genome was revealed to all humanity and announced to every corner of our planet. Comprising only four chemical letters, the human genome undoubtedly carries an enormous amount of information that would have been unimaginable in former times and will sustain decades of future work. What lies behind this remarkable achievement for humanity, which took place just a century after the birth of molecular biology?

This new book by Hans Christian von Baeyer – a physicist at the College of William and Mary in Virginia, US – provides a superb account of various aspects of the influence of information on humanity and science in particular. Written by an author who displays a thorough understanding of his subject, the book offers the bold thesis that information is the essence of science. It is a remarkable notion that will be widely accepted by scientists and by the general public. Although the book is aimed at a broad readership – there are no equations – it will still be valuable for physicists, as it examines the role that information plays in many areas of science.

The book begins with a thorough survey of the nature of information – ranging from an initial description of the concept to the late Claude Shannon’s “operational” way of measuring information. It involves translating any message into binary units and counting the number of resulting ones and zeroes. Shannon’s tremendous insight that digital information can be extracted from analogue signals helped to pave the way for the information-technology revolution of the past decade.

The rest of the book is divided into two parts: classical information and quantum information. The former offers a detailed insight into the nature of “information” as we know it today, including entropy, randomness and noise. It also looks at how information is stored and transmitted. In the section on quantum information, the book offers some basic insights into the key points of the subject, which is now a hot topic. A huge amount of knowledge has been obtained in a few short years on various aspects of the field, particularly about the nature of the related physical processes.

These research efforts, supported by the governments of many industrialized nations, have yielded many findings about quantum physics and information theory, all in classical forms. However, the book warns readers to be wary of some of the grandiose claims that have been made concerning potential applications of quantum information. These words of caution provide a welcome balance to some of these claims. Quantum information, it should also be noted, is still in an analogue form; whether it too can be made digital remains to be seen.

Despite having been invented almost 2000 years ago, paper remains our primary information-storage medium – apart from the human brain. However, the transformation to electronic communication brings both risks and rewards. One of the dangers of being able to store, retrieve and transmit information electronically is that the quantity of available information increases enormously. I believe that this book could have become a best-seller if it had tackled the psychology of information and the influence of instant access to information on society. These issues will soon become pressing for our civilization, although I admit that they are beyond what one might expect a fellow physicist, such as von Baeyer, to address.

As for his view that information will reunite science, it is a nice idea but whether it will happen is uncertain. If anything, the growth in information has caused science to splinter into ever smaller branches. A good example is the German mathematician Georg Simon Ohm, who received his doctorate from the University of Erlangen in 1811 and went on to formulate the law of electrical transmission. What most people do not know is that he also developed a theory of physiological acoustics, although it was later proven faulty. In his day, scientists like Ohm were not labelled by their “discipline”.

Nowadays, however, it takes much longer for young scientists to grasp the basic information in their field. Indeed, it is rare to find anyone who can make significant contributions to more than one sub-field of science. I therefore doubt if more detailed scientific information will unite all of science. Nonetheless, we can unite the fundamentals, such as causality, basic scientific methods, and the most basic pictures of life and the universe. Such a unified view – known to even just a part of humanity – would be a tremendous achievement.

Light fantastic


Rainbows are just one of the applications or manifestations of optics discussed in this month’s magazine. Previous special issues of Physics World on lasers and optics have covered mainstream research, and applications such as biomedical optics, quantum cascade lasers and light-emitting polymers (June 1999). More recently we highlighted fundamental research that was “rewriting the laws of optics” (September 2001). All of these topics – trapping light in atomic gases, sub-wavelength imaging, attosecond experiments and negative-index materials – are still the focus of intense research. However, the articles in this issue look at optics from a number of different, less obvious angles.

The rainbow might be the best known example of optics in the natural world, but we should not forget the fact that much of life on Earth has evolved in response to the small range of wavelengths of light that manage to travel all the way from the Sun to the surface of the planet. And nature has learned some very clever tricks during the 500 million years that this has been happening, as Pete Vukusic describes in “Natural photonics”. Physicists have unwittingly “rediscovered” some of these tricks – which have applications ranging from antireflective surfaces to anticounterfeiting technology – but there is still much to learn.

Physicists applying the laws of optics to visual effects in the movies face different challenges – either recreating on screen realistic scenes that are too difficult or too expensive to film using conventional means, or “rendering” scenes that never have and never will exist. In “The special effect of physics” Jürgen Singer of mental images explains how his company has produced visual effects for films such as Matrix Reloaded. And this is not an isolated example of physics going to Hollywood, as the story of Iain Neil and his 26 Oscars confirms.

When Isaac Newton published Opticks 300 years ago it caused a rift between science and the arts, with John Keats famously accusing Newton of “unweaving the rainbow”. However, the fascination of physicists with the natural world shows no sign of ending.

Maxwell’s equations and earthquakes

These phenomena are generally non-seismic, so seismologists use geodetic observations such as measurements of tilt and land deformation to predict when an earthquake might be about to take place. Satellite data from the Global Positioning System (GPS) will improve the accuracy of geodetic measurements, but reliable short-term earthquake prediction is currently very difficult.

An alternative approach is to use electromagnetic rather than seismic information. Since the 1980s Panayiotis Varotsos and co-workers at the University of Athens have been predicting earthquakes in Greece based on measurements of electric currents in the earth.Their method – which is called VAN after the initials of the Athens team – is based on the potential difference between electrodes that are buried at several sites. By continuously monitoring these voltages, the researchers have detected anomalous transient signals just before earthquakes that they call seismic electric signals (SES).

However, the seismic electric signals exhibit some puzzling behaviour. First, they travel much further – between 10 km and 100 km – than expected. Second, they are only detected at a limited number of observation sites, which suggests that they only travel through narrow, highly conducting paths.Now the Athens team has found that the long transmission distances can be explained if the source of the seismic electric signals and the observation site are both close enough to these conducting paths (P A Varotsos 2003 Phys. Rev. Lett. 91 148501). Since earthquake faults are known to be highly conductive, this seems a reasonable assumption.

In the February issue of Physics World Seiya Uyeda and Haruo Tanaka in the Earthquake Prediction Research Center at Tokai University in Japan describe this work in more detail.

The special effect of physics

From the dawn of history people have tried to convey to others an impression of the mental images they see in their mind’s eye. We have come a long way since the Renaissance times of Albrecht Dürer and his attempts to use Euclid’s mathematical methods as a basis for painting. Today, movie directors want to make us believe that worlds that never were and never will be are as real as our living room. One is well advised to remember, however, that “movie physics” is an approximation of reality, and that it may differ substantially from the real world if artistic vision or viewing conventions demand it.

Before we can understand the physics behind visual effects, we have to ask ourselves a fundamental question: what is colour? There is no such thing as colour in nature, or as Newton said, “rays, properly expressed, are not coloured”. The intensity of the electromagnetic radiation emitted by a source varies as a function of both frequency and direction. A material object will react to the radiation emitted by another object by altering both its frequency distribution and its direction. Finally some of the radiation may reach our eyes.

In a simplified model we can say that our eye contains three kinds of sensors (called cones) that react differently to radiation of different frequencies. Our brain translates these stimuli into colour impressions. These three sensors are the main reason why it is sufficient for us to represent most electromagnetic spectra of interest – spectra in the visible domain – as a linear superposition of three base spectra. In televisions, for example, red, green and blue are typically used for these purposes.

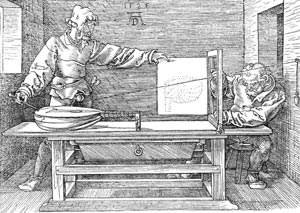
Creating a 2D image of a 3D scene on a computer – a process known as rendering – is still quite demanding in terms of processing power and memory resources. Hence practically all of the software in this field uses geometric optics, which means that the wave nature of light is ignored. Indeed, this method is essentially the same as the projective approach developed by Dürer in 1525 (figure 1). Light spectra are represented as a linear superposition of three components, which we shall sloppily call “colour”.

All in the mind

To render an image, the scene must first be generated inside the computer. In other words, the geometric objects comprising the scene must be constructed. Several highly sophisticated commercial programs are available for this purpose, such as 3D Studio Max from Autodesk, Maya from Alias, and XSI from Softimage. These programs describe the geometry of a scene in mathematical terms with the help of polynomials, rational functions or just simple triangles in a manner that is transparent to the user. They are also used to control the time evolution of a scene by predetermining the position of a geometric object within each computer-generated frame of film.

Movies are displayed at a rate of 24 frames per second, which means there are about 130,000 frames in a typical 90 minute film. Even if we only spend 10 minutes rendering one frame, then about three years of computer time is needed to make one movie. Until recently this meant that most computer-generated scenes only involved the visible surfaces of objects. Today, however, increased computing power allows us to achieve far better animations by modelling the underlying structure of objects too.

This is especially effective for creature animations, such as in the movie Incredible Hulk, in which bones can be positioned relative to one another by placing constraints on their possible movements. Muscles are then attached to the bones like building an anatomical model, albeit usually much simplified. As a result, the muscles will bulge in the right place when an arm is bent, and consequently the skin will stretch and the surface will automatically have the right shape. But there is another important step to be made before a convincing animation is generated.

A modelled creature is not aware of its surroundings, so even a simple task such as placing a foot on a floor requires special software to detect when the foot touches the floor, not to mention the fact that the foot needs to deform under the pressure. This branch of computer modelling is called collision detection, and it contains more sophisticated classical mechanics than we are able to cover here. Instead, we will concentrate on the interaction of light with matter, because this is what makes computer-generated images appear more realistic.

The power of light

The principal quantity of interest when rendering a 3D scene into a 2D image is the radiance. This is the power of the light that is emitted per projected surface area into a given solid angle, and it is measured in watts per square metre per steradian. Crucially, radiance is conserved, which means that the radiance leaving a surface in a certain direction and travelling through a vacuum will arrive at another surface lying in this direction without loss. If there is no radiance arriving at our eyes we will not see anything, so we need to include objects such as the Sun or a light bulb to generate it. Abstractly, these objects are called light sources.

To render colour images we actually look at each of the three frequency channels independently. We register the spectral radiance of each channel that arrives at our virtual camera and then convert their combined effect into the appropriate colour for each pixel in the camera. However, simply registering the radiance that arrives directly from a light source would not result in very interesting pictures because this radiance provides no information about the rest of the objects in the scene. The next challenge is therefore to simulate the response of objects that are not sources of light to the radiance arriving at them.

Conservation of energy requires that the total radiance leaving a material may not be more than the total radiance arriving. Part of this radiance may be absorbed and converted to heat, while the rest is either reflected or transmitted. In computer graphics, reflection and transmission are described by so-called bi-directional distribution functions.

The idea behind the bi-directional reflection distribution function (BRDF) is quite straightforward: it tells us what fraction of the radiance arriving at a point on the surface from a given direction will leave in another direction after being reflected. A general BRDF is therefore described by seven parameters: three for the position in space and two for each of the incoming and outgoing directions. Dealing with such multidimensional functions requires extensive computer resources. Luckily, however, the BRDF of many materials may be approximated by a combination of several simple BRDFs. Two of the simplest of these are specular and diffuse reflection.

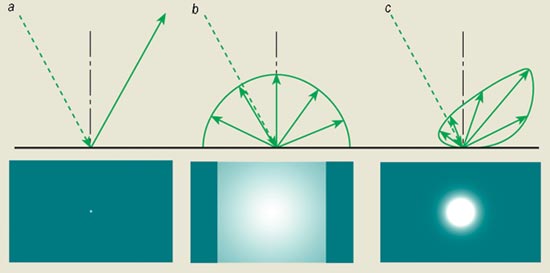
In specular reflection the surface of a material behaves like an ideal mirror, and the outgoing radiance is the mirror image of the incoming radiance (figure 2). In diffuse reflection, on the other hand, the direction of the outgoing radiance is independent of the incoming direction, which means that the light is equally reflected in all directions. Glossy reflections are somewhere in between these two extremes. In bi-directional transmission distribution functions (BTDF) it is also necessary to include refraction, which is described by Snell’s law.

The rendering equation

In 1986 James Kajiya, then at the California Institute of Technology, formulated the fundamental problem in computer graphics in terms of a transport equation called the rendering equation: the radiance, L, arriving at any point is the radiance directly arriving from all visible light sources, S, plus the total radiance arriving from all visible surfaces via reflection or transmission. Hence we end up with an equation, L = S + (BRDF + BTDF)L, that describes the transport of radiance from the light sources through the scene to the camera plane. The big problem is that the unknown function L appears on both sides of the equation.

This kind of equation may be tackled using a simple but hugely successful approach known to physicists as the Born series. Just replace L on the right-hand side of the equation by S + (BRDF + BTDF)L, and repeat this substitution process as often as is needed. In the case of plain numbers, rather than functions, the Born series becomes especially simple. If we take the equation x = 1 + qx, for example, and substitute x in the right-hand side by 1 + qx, we are left with the expression x = 1 + q(1 + qx). By repeating this procedure we can obtain x = 1 + q + q2 + q3 + …. However, we may also solve the original equation directly to give x = 1/(1 – q), and thus we are able to derive the well known formula for the geometric series: 1/(1 – q) = 1 + q + q2 + q3 + ….

Unfortunately, L is a function rather than a number, and this means that we cannot, in general, solve the transport equation directly. Instead we need to approximate the solution by stopping the series expansion after a finite number of substitutions, and set L to zero in the last substitution. The resulting finite series describes the path that the radiance takes through the scene by interacting with the materials associated with the geometric objects placed in it. A trivial approximation would be L = S: in this case the image only includes the radiance of the light sources that arrives directly at the camera. The next approximation that we can introduce, L = S + (BRDF + BTDF)S, contains more information about the scene because it also includes radiance that has interacted once with other objects in the scene.

From the viewpoint of the camera, we notice that we only register objects that are directly visible from the camera and that are illuminated by a light source. In other words, this is the projective method used by Dürer. The next iteration would be L = S + (BRDF + BTDF)S + (BRDF + BTDF)2S, which takes into account at most two interactions of the light with other objects, such as a reflection in a mirror. To then illuminate the reflected object we would need a further iteration, and so on. By including more terms in the Born series we may take into account as many light-object interactions as we need to produce a realistic-looking image.

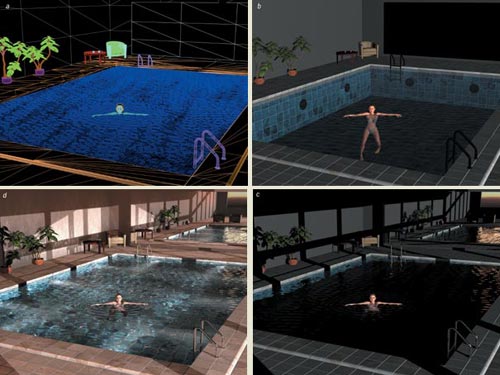
Not only is the simplest Born-series method equivalent to Dürer’s projection technique, it is also the method used by today’s graphics hardware boards. Many of Pixar’s movies, such as Toy Story, were generated using this method (which is also known as scanline rendering) using its own rendering program Renderman. The intrinsic limitation of plain scanline rendering, however, is that there are no reflections or refractions. The result can be seen in figure 3b, for example, where the mirror on the right wall and the chrome surface of the pool ladders appear black. To obtain the effects of reflection with a scanline renderer we have to use some tricks. The pool scene, for example, can be rendered first from the viewpoint of a camera placed at the mirror position, with the mirror replaced by a window. The resulting image may then be used to replace the black mirror surface. However, this approach would be much more difficult for non-planar surfaces, such as the pool ladders.

A similar method is used to calculate shadows. For each light source the scene is rendered with a camera placed at the position of the light. However, instead of recording the colour, it is only necessary to remember the distance of any geometric object from the camera. This “shadow map” image may later be used to determine whether an object casts a shadow on another object during the rendering process. The scanline-rendering image also appears quite dark, which is usually remedied by placing some constant “background light” everywhere in the scene. In addition, lights that defy the law of energy conservation can be used: these lights do not follow the usual inverse square law and make everything in the scene appear brighter.

To enhance an image, computer-generated images or real photographs can be incorporated: all the swimming pool tiles in figure 3d, for example, were produced using this method. This approach is exactly opposite to the “blue screen” approach in which actors are filmed in front of a background that has a specific colour after which all the pixels that have this colour are replaced by pixels from computer-generated scenes. This is the standard method used to blend actors and portions of real scenery into a computer-generated background, as was done for the Colosseum Maximus scenes in the film Gladiator.

Ray tracing

There is a big difference, however, between rendering an image and the visual effects that you ultimately see in the cinema. I work for a company called mental images in Berlin, which was established in 1986 to create photorealistic computer-generated graphics. Currently our scientific staff consists of about 25 people, who are either computer scientists, physicists or mathematicians. Our rendering software “mental ray” differs from Renderman’s scanline approach because it uses a technique known as ray tracing.

Renderman and mental ray have one thing in common: they provide the infrastructure for describing how materials interact with light. But each production house, such as Dreamworks, Pixar or Sony, has special needs that depend on its current projects. Renderman provides a specialized “shading language” for this purpose, while mental ray allows custom functions written in the C programming language to be used. In other words, visual-effects companies develop shaders that are geared towards their specific needs, while rendering software like mental ray provides the “physics glue” that steers light rays through the scene and enables the shaders to interact.

Ray tracing was introduced to computer graphics by Arthur Appel in 1968, then working for IBM at their laboratory in Yorktown Heights, although the principle was allegedly first used some centuries earlier by Descartes in his attempts to explain how rainbows are generated. Ray tracing goes beyond scanline rendering by using more terms of the Born series. However, if we were to follow the radiance emitted by a light source through a scene until it reaches the camera plane, we would waste a lot of effort because only a very small portion of the light will end up at the camera; most of it will end up somewhere else in the scene. It is much better to start at the end: to shoot rays from the focal point of the camera through the pixels comprising the camera plane and out into the scene. This is possible thanks to what is known as the Helmholtz reciprocity principle, which states that the physics remains unchanged if the direction of light in a BRDF or BTDF is reversed.

We then follow these rays through the scene, which means that we have to be able to calculate where the rays intersect various objects. In general this is not possible exactly because there are only a few shapes for which we can calculate their intersection with a ray sufficiently quickly. In mental ray we restrict ourselves to triangles, so all geometric objects are approximated as collections of triangles (figure 3a). These triangles can have different material properties, and these properties determine what happens to the ray when it intersects a particular triangle.

For example the ray may be reflected or refracted, after which it continues its journey through the scene. Computationally, this means that a higher-order term in the Born series will contribute and that each refraction or reflection will increase the order of the contributing term by one. If, on the other hand, the material of the intersected triangle is diffuse, then we have no idea which of the many possible directions the ongoing ray will choose. Hence we stop and just compute the radiance arriving from all light sources. This means that only the current term of the Born series will contribute.

To calculate this contribution we send a special ray called a shadow ray from each light source to the intersection point. If this shadow ray hits another object before it reaches the original triangle, then we know that a shadow will be cast onto this triangle. Otherwise we can transfer the incident radiance back towards the camera, thus giving information about the colour of the pixel in the camera plane.

An image produced with this ray-tracing approach can be seen in figure 3c. The reflections in the mirror and on the pool ladders are now clearly visible, and we can even see a reflection of the bright sky in the mirror reflection of the left-wall window. There are also reflections of the table and the plants on the water surface. However, the water surface for the most part still looks quite unnatural. The reason for this lies in the way we treat shadow rays. Light falling on the water surface is either reflected or refracted towards the pool floor. However, water has a higher refractive index than air, which means that the straight shadow ray will hit the pool or room wall before the light ray when it is shot from the source to the pool floor. The floor of the pool is therefore considered to lie in the shadow, and the water surface appears dark. Ideally we would like to refract the shadow ray too, but mathematically this is a much more difficult problem to solve.

Tracing rays from the light source to the camera is computationally expensive. But it is possible to get round this by tracing rays from the light source through the scene and keeping a record of where these rays hit an object. This is like a bubble chamber in particle physics: it is very difficult to see the actual particles, but it is comparatively easy to see the tracks of the bubbles that they cause as they pass through the chamber. In mental ray we call these rays “photons” because they behave like real photons in many ways, but they should not be mistaken for the real thing. The record of the interactions between these photons and objects in the scene is called the “photon map”.

When our swimming pool is rendered with global illumination, light from everywhere on the sky hemisphere will try to reach it, although most of the light will be stopped by the surrounding building (figure 3d). The photons that enter through the windows reach the pool floor and light it up, which makes the water appear more natural. The principal difference between these photons – which have their trace history stored in the photon map – and the shadow rays is that the former may be refracted, while the latter must follow a straight line.

The colour of the walls, including the shadows on them, shift slightly due to the influence of the colour of the floor tiles. This effect is called “colour bleeding” because the colour of one diffuse surface is affected by another diffuse surface. Another spectacular effect is the appearance of “caustics” in the water and on the rear wall, which are the result of photons that have been specularly reflected or refracted from the undulating water surface.

The perfect image

In the last few years computer graphics has taken great strides towards the perfect image. It is becoming increasingly difficult to distinguish photographs from computer-generated images. Mental ray has been used extensively in recent Hollywood films, such as the Matrix movies and Terminator 3. In Matrix Reloaded there are several scenes where even the actors have been digitally recreated, and it is very difficult to distinguish these from the originals. The simulation of clothing and hair is now so sophisticated that there is little room for improvement, and the quality of simulated skin has also increased tremendously.

However, there are still some things current software does not do, or at least does not do well. For example the frequency-dependent refractions that are needed to generate rainbows are still extremely computer intensive, and any effects that depend on the wave nature of light are also beyond current capabilities. Modern computer-graphics software cannot, for instance, reproduce the interference pattern observed in the classic double-slit experiment.

It should also be pointed out that the quest for physically accurate image generation is driven more by design engineering and architecture applications than by the entertainment industry. For the latter it is much more important that images look good, even at the cost of physical accuracy. However, the designers of aircraft cockpits, for example, need to know if there might be problems with the readability of instruments under various lighting conditions. These areas of special visual effects pose entirely new challenges. The plans for an aircraft involve huge databases that need to be accessed by many engineers in many different places all over the world. There is therefore a need to provide those local engineers or customers with high-quality images generated from the most current, centralized databases.

Manufacturers also consider the data underlying the images confidential, although they have no problem letting people access the final images. Hence they are very reluctant to make such data available on CD-ROM (even if the logistical problems of ensuring that everyone is working with the latest CD-ROM could be overcome). Operating from a centralized database then becomes a question of improved access and version control. This is in stark contrast to the movie and entertainment industry, where the image itself is the product that needs to be protected. At mental images we have now started to provide such an infrastructure – called RealityServer – which is beginning to make centralized rendering and multipoint interaction with high-quality images a possibility.

A sound future

As we have seen, today’s commercial rendering software uses geometric optics and only three colour channels, but computers are now fast enough to start looking at the entire visible spectrum. This would allow us to simulate materials that have wavelength-dependent coefficients of reflection or refraction, such as glass prisms. There is also room for improvement in the simulation of people. In the Matrix movies, for example, the skin on the faces of the virtual actors was obtained from processed photographs of the real actors. Researchers are currently trying to avoid this kind of expensive circumnavigation by using better, yet still reasonably simple, mathematical models for the reaction of skin to light.

From a physics point of view we would also like to leave geometric optics behind and use the wave nature of light rays instead. As well as allowing us to simulate the visual effects of interference, this opens up the possibility of simulating sound waves in complex geometries. Architects, for example, might eventually be able to use such software to optimize noise pollution in their buildings.


Blasts from the past

How can the significance or usefulness of a scientific paper be measured? One way to do this is to count the number of times that a given paper has been included in the reference lists of other papers. This citation approach can be applied to individual papers or scientists, and also to journals, areas of science and whole countries. However, the number of citations cannot easily be equated with the overall significance or usefulness of a paper. This is true for recent papers, the long-term significance of which may not yet be clear, and also for many older papers that are not cited because their results are now so well known that they appear in textbooks. It would be easy to theorize and speculate about these matters, but there is a much more satisfactory way to proceed: as is always the case in physics, the best way to make progress is to collect and analyse data.

In this article we look at papers from the time of Newton right up to the present day. We will concentrate on the pre-1900 and pre-1930s eras, but we will also explore some more recent trends. Most citation data come originally from the Science Citation Index (SCI) published by Thomson ISI in Philadelphia. The results in this article were obtained using SCISEARCH, the version of the SCI offered by STN International. Although SCISEARCH only covers papers published since 1974, the references in these papers obviously stretch back much further than that date.

Since 1974 only about 0.5% of the references in papers in all fields of science have been to articles published before 1900, whereas about 4% have been to papers that were published before 1950. When the “age distribution” of the references in all the papers that have been published in a particular year is plotted, it tends to peak three years previously. For example, papers published in 1999 dominate the reference lists of articles published in 2002. We can also use this plot to calculate the “half-life” of papers, a concept introduced by the crystallographer John Desmond (JD) Bernal in the late 1950s. For a given year the citing half-life is defined as the number of years that one has to go back in time to account for 50% of the total references given in that year.

We are not convinced that the increase in the citing half-life that we have found – from 9.3 years in 1975 to 10.5 years in 2002 – is significant, although a similar increase has been found in a recent, more extensive analysis by Kevin Boyack and Alex Bäcker (see further reading). The fact that papers can still have an impact several decades after they were originally published is noteworthy because it contradicts the growing belief among some information scientists and others that the lifetime of scientific publications is rapidly decreasing.

The data also show that there is considerable variation between subjects. The references in physics papers tend to be older than the average for all fields of science. For example, the share of papers with pre-1900 references is about 1%, and this increases to 6% for the pre-1930 era and 17% for the pre-1950 era. Engineers tend to cite fewer old papers (only 3% for pre-1930), whereas geoscientists tend to cite more (12%).

The impact one century after publication

Of all the pre-1800 publications that have been cited since 1974, there are about 35,000 that can be processed relatively easily using SCISEARCH. Not surprisingly, many of these early works are not journal articles but book-like publications. The most-cited scientist of this era is the Swedish botanist Carl Linnaeus (1707-1778), who has received about 4000 citations since 1974. He is followed by the Swiss mathematician Leonhard Euler, Isaac Newton and two more 18th-century entomologists – Johann Christian Fabricius and John Hunter. Other names in the top 20 include Edmond Halley, Robert Boyle, Joseph-Louis Lagrange, Robert Hooke, Rene Descartes, Charles Augustin de Coulomb and Pierre-Simon Laplace.

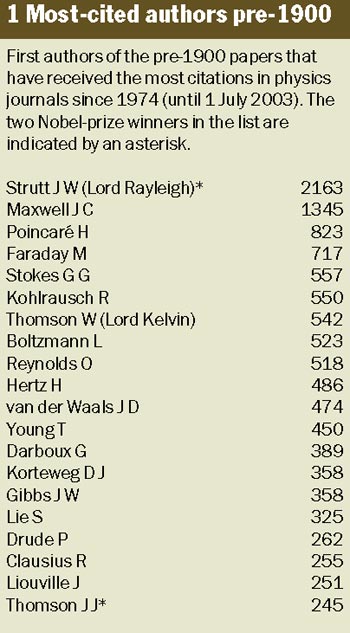
There are some 400,000 papers in the SCI database that contain references to papers published before 1900, and a total of about 1.2 million pre-1930 references. The citation software that is currently available is not able to analyse such large numbers, but analysis is possible if we restrict ourselves to references made in physics journals. Not surprisingly, both lists read like a “who’s who” of physicists of the day and contain many Nobel-prize winners (see tables). John William Strutt (Lord Rayleigh) is the most-cited author in the pre-1900 list, while Einstein tops the table for pre-1930.

Einstein’s three most-cited pre-1930 papers (with a total of about 2600 citations) are based on his PhD thesis and show how measurements of Brownian motion can be used to determine the size of molecules. In comparison, his famous 1905 paper on special relativity has been cited “only” 450 times since 1974, making it his fifth most-cited pre-1930 paper. However, Einstein’s most-cited article of all time is his 1935 paper with Boris Podolsky and Nathan Rosen, which has over 2000 citations. This paper – which suggests that quantum mechanics cannot offer a complete description of “physical reality” – introduced what is now known as the EPR paradox.

In second place behind Einstein in the pre-1930 list is Peter Debye, who published two influential papers on the theory of electrolytes in 1923. The other names in the top 10 are Max Born, Irving Langmuir (the only industrial physicist in either list), Lord Rayleigh, Marian Ritter von Smoluchowski, Peter Paul Ewald, James Clerk Maxwell, Hermann Weyl and Paul Dirac. Born published highly cited papers on the hydration of ions (1920) and the quantum theory of molecules (1927). Langmuir, who spent most of his career at General Electric, is best known for his 1918 paper on the adsorption of gases by solid surfaces. Von Smoluchowski’s most-cited article put forward a new theory for the coagulation of colloids in 1917.

When we look at individual papers we find that the most-cited pre-1900 article was published by the Dutch applied mathematicians Diederik Johannes Korteweg and Gustav de Vries in Philosophical Magazine in 1895. This paper, which introduced the concept of solitons, received about 600 citations in all journals (not just physics journals). In the most-cited paper for the pre-1930 era, Ewald showed how to calculate the sums of functions of the type 1/rn: such calculations are central to understanding the electric and magnetic properties of solids. This paper, which was published in Annalen der Physik in 1921, has received about 1600 citations since 1974.

Sleeping beauties and other papers

It is informative to look at the citation patterns of different highly cited papers. Some peak quickly and then continue to generate a nearly constant impact over decades after passing their maximum, while others are ignored for decades before garnering lots of citations. However, the probability that a paper that is initially uncited will prove to be such a “sleeping beauty” is very low. Indeed, quite a high proportion of papers receive few, if any, citations.

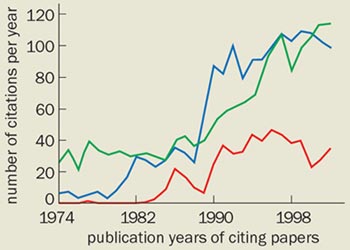
Some highly cited papers seem to have been “rediscovered” in the past two decades (see figure). For instance a Rudolf Kohlrausch paper from 1847 – which introduced the idea of stretched exponentials to explain relaxation effects – had only a minor impact until it was cited in what proved to be an influential article published by Richard Palmer of Duke University and co-workers in Physical Review Letters in 1984. Palmer et al. has now been cited by over 900 other papers, with 120 of these also citing Kohlrausch’s work. Old papers can also be rediscovered when they are cited in articles in review journals. Both the Kohlrausch paper and a 1917 paper by von Smoluchowski benefited from being cited in Reviews of Modern Physics. Ewald’s 1921 paper, on the other hand, has been widely cited since at least 1974.

Citations of influential papers in theoretical physics and chemistry often do not reach their maximum until decades after publication, and it is not unknown for some of these articles to be virtually ignored for many years or even decades. This is not unexpected: it is not easy to incorporate revolutionary ideas into established scientific concepts. Moreover, some theories and predictions cannot be fully tested when they are originally proposed due to lack of suitable equipment or data. One could say that these papers are “premature”.

The history of science also contains many examples of the scientific community being resistant to new discoveries. Hermann von Helmholtz, for instance, commiserated with Faraday about “the fact that the greatest benefactors of mankind usually do not obtain a full reward during their lifetime, and that the more time new ideas need for gaining general assent the more really original they are”. And Max Planck once famously said, “a new scientific truth does not triumph by convincing its opponents and making them see the light, but rather because its opponents die and a new generation grows up that is familiar with it”.

Finally, we should note some of the limitations of our analysis. For instance, Gustav de Vries does not appear in table 1 because he was the second author on the paper with Korteweg. However, the majority of papers before 1930 only had a single author. Also, the actual numbers in the tables are underestimates because they only include citations from physics journals. The overall citation counts are somewhat higher because papers are often cited outside their own discipline. This is particularly true for early papers, because science was more interdisciplinary then than it is now.

Final thoughts

So why are scientists so obsessed with recent publications, often at the expense of older work? One possible explanation is that the number of papers published every year in the natural sciences has increased by a factor of between two and four since 1974, which means that there are more new papers to read – and even less time than before to reread older papers. The Web has also increased both the pace of the publishing process and the volume of material published. It is obviously important to stay up to date with the latest research, but not at the expense of all the papers that have gone before.

Copyright © 2026 by IOP Publishing Ltd and individual contributors