Anastasio received his first degree in physics from Johns Hopkins University, and went on to obtain his PhD in theoretical nuclear physics at the State University of New York at Stony Brook. He joined Lawrence Livermore National Laboratory in 1980 and worked in one of two divisions that design nuclear weapons. He was promoted to leader of the division and later became associate director for defence and nuclear technologies, in charge of the lab’s nuclear weapons programme.
Anastasio was appointed by the Board of Regents at the University of California, which manages the government lab. “I am honoured to accept this appointment,” says Anastasio. “As Livermore is among the nation’s top scientific institutions, we must continue to make an innovative contribution to advance national security and all areas of science and technology.”
Canada was the first nation to make a bid to host the experiment, offering a site at Clarington near Toronto last year. The French government has now offered a site at Cadarache, where the French atomic energy commission (CEA) already has a laboratory. Japan has offered a site at Rokkasho-mura in the Aomori Prefecture, while Spain has proposed a site at Vandellos near Barcelona.
The host will be expected to pay at least half of the cost of ITER and a decision on the site is expected before the end of the year. The negotiators will meet again in Toronto in September, in Aomori in October and in Barcelona in December.
When a neutron beam passes through a slit its transverse motion is quantized, just like a particle in a box. Indeed, for the experimental set-up used by Rauch and co-workers, there are 360 bound states in the potential created by the slit. Levy-Leblond and Greenberger predicted that this quantization in the transverse direction would lead to a phase shift in the longitudinal direction that could be detected with a neutron interferometer. This is what the Vienna-Grenoble team has done.
Rauch and co-workers actually used a silicon multi-slit system consisting of 186 slits – each 22.1 microns wide – to increase the intensity in their experiment. A thermal beam of neutrons from the ILL reactor was converted into a beam with a well-defined neutron energy and this beam was then split into two components. One component passed through the slit system, while the other did not. The two beams were then recombined and the neutron signal was measured as a function of the path difference between the two beams. The measured value of the shift was 2.8 degrees, which was in good agreement with the theoretical prediction of 2.5 degrees.
The phase shift arises mostly from neutrons whose classical trajectories do not touch the walls of the slits, and is therefore another example of the non-local nature of quantum mechanics. Earlier this year another team at the ILL observed quantum motion in a neutron beam in the gravitational potential of the Earth – the first time that quantum motion had been observed in a gravitational potential.
Visual images can have a powerful impact on the viewer, and this is certainly the case when the images are atomic-scale pictures of the surface of a high-temperature copper-oxide superconductor. The unusual properties of these materials have vexed condensed-matter theorists for the last 15 years. Now a new flurry of theoretical papers has been stimulated by the latest images of a cuprate superconductor, which reveal that an applied magnetic field can induce “stripes” of charge. The experimental results provide intriguing and important clues to the nature of these ever-surprising materials – although the theorists have still to agree on their meaning.
Many different families of copper-oxide compounds exhibit superconductivity. All of them are layered materials containing planes of copper and oxygen atoms. The copper forms a square lattice with an oxygen atom bridging each pair of copper atoms. By varying the electronic charge density within these layers, one can convert from a superconducting phase, in which electrical current can flow without resistance, to an electrical insulator. This is typically achieved by modifying the chemical composition of the compound, and the resulting insulating state is accompanied by antiferromagnetic ordering in which the magnetic moments of neighbouring copper atoms point in opposite directions.
It is this apparent competition between two states with such opposing properties that has generated much of the lasting interest and debate regarding the nature of superconductivity in the cuprates.
In recent years, there has been a great deal of discussion about other possible types of order – beyond superconductivity and antiferromagnetism – that might intervene between these phases and compete with superconductivity. Some of the proposals include exotic electronic states that have not yet been observed in any system. And these new experimental results have added considerable fuel to the debate.
The images that are proving so provocative were obtained by Seamus Davis of the University of California at Berkeley and co-workers using a scanning tunnelling microscope (J E Hoffman et al. 2002 Science295 466). In a scanning tunnelling microscope (STM), a sharp metallic tip is brought within a nanometre or two of the surface of the sample. Images are formed by scanning the tip across the surface and measuring the electrical current that tunnels quantum mechanically between it and the surface as a function of applied bias voltage. The nature of the image depends on how the measurement is obtained. One can choose to measure the positions of atoms or – as Davis and co-workers did – to map the electronic density of states at the surface.
The team investigated bismuth strontium calcium copper oxide (Bi2Sr2CaCu2O8 + δ or BSCCO for short) – the same material used in nearly all STM studies of the cuprates. The beauty of BSCCO for surface studies is that it can be cleaved very easily, making it practical to prepare a fresh, uncontaminated surface with little effort. This cleavage occurs between the weakly bonded bismuth oxide layers. A copper-oxide layer can then be imaged through the non-metallic bismuth-oxide layer at the surface.
Davis and co-workers performed the measurements with a magnetic field applied to the sample. One of the hallmarks of the superconducting state is the Meissner effect, in which supercurrents are spontaneously generated such that they cancel out the applied field inside the superconductor. However, cuprates fall into the class of so-called type-II superconductors in which quantized units of magnetic flux thread through the sample above a threshold field. A supercurrent flows about each quantum of flux, cancelling the field within the bulk of the sample in a manner reminiscent of the Meissner effect. The amplitude of the superconducting wavefunction falls to zero at the centre of this vortex, and it gradually recovers to full strength outside a circular region called the vortex core, which has a radius equal to the coherence length of the superconducting state.
In BSCCO, the diameter of the vortex core is roughly five times the lattice spacing between copper atoms. The magnetic field is strongest at the vortex core and it only becomes fully screened some 400 lattice spacings away. The strength of the magnetic field used by Davis and co-workers produces a vortex spacing that is smaller than the screening distance, so that the magnetic field is nearly uniform outside the vortex core.
Within the vortex core, where the superconductivity is suppressed, the electronic state is usually assumed to correspond to the “normal” or non-superconducting state. However, early STM studies of the vortex core by Øystein Fischer’s group at the University of Geneva in Switzerland demonstrated anomalous behaviour. And much recent work has been stimulated, in part, by the theoretical prediction of Shou-Cheng Zhang of Stanford University and co-workers that the core should exhibit antiferromagnetic order.
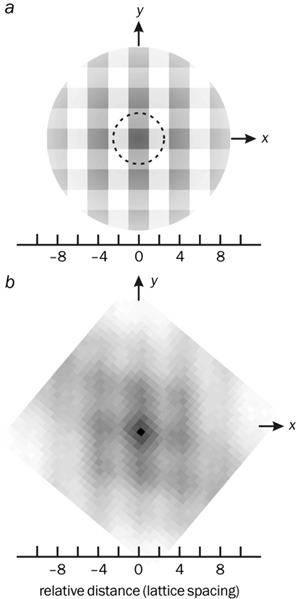
Davis and colleagues found that the local density of states around each vortex is modulated in a checkerboard pattern (see figure). Moreover, the modulation has a period of four lattice spacings along the direction parallel to the copper-oxygen bonds. Several periods of the modulation are apparent and they extend well outside the vortex-core region, indicating that the modulation overlaps and coexists with the superconducting state.
The implications of this image are striking. One expects new features induced by the magnetic flux to be associated with suppression of the superconducting state. However, a spatially modulated local density of electronic states – like the one observed by the Berkeley group – does not occur in the normal state of conventional metallic superconductors. The modulation indicates a competing type of order that can also coexist with superconductivity. Much of the theoretical outpouring that has been stimulated by this work is aimed at explaining the nature of the competing order.
One empirical hint about the nature of the order comes from recent neutron-scattering experiments with a different cuprate compound: lanthanum strontium copper oxide (LSCO). An international team led by Bella Lake of the Oak Ridge National Laboratory recently made a particularly relevant discovery (2002 Nature415 299). When Lake and co-workers applied a magnetic field to a sample of LSCO, they managed to induce local antiferromagnetic order that was modulated with a period of eight lattice spacings – exactly twice the period of the charge-related modulation in BSCCO.
Although the neutron measurements average over the entire sample, the magnetic scattering increases with the field strength as one would expect for local order associated with the vortices. Regions of antiferromagnetic and charge order – commonly referred to as stripes – with the periods of eight and four lattice spacings, respectively, have also been observed in closely related modifications of LSCO. Stripe order can coexist with superconductivity, but it tends to be associated with a drop in the superconducting transition temperature.
Not all theoretical models require the simultaneous presence of magnetic and charge-density modulations, but it would obviously be interesting to see STM and neutron-scattering measurements done on the same materials. So why don’t the two experimental groups just swap samples and repeat their measurements? This is easier said than done. LSCO crystals are not easily cleaved, which is a requirement for STM studies. On the other hand, it is challenging to obtain sufficiently large crystals of BSCCO for successful neutron-scattering measurements. Of course, overcoming these challenges is all part of the fun of doing science.
The images of field-induced modulations of charge and spin states obtained in the STM and neutron-scattering experiments are stimulating. Theorists are eagerly evaluating models and making new predictions, while experimentalists are busy trying to repeat the studies on different materials and to extend them in new directions. One can expect interesting developments in the near future, and the new results are likely to change the image of cuprate superconductors.
Most physicists will be hoping that there is an innocent or logical explanation for the remarkable similarities between the graphs containing the results of quite different experiments on the electronic properties of organic materials in papers published by Jan Hendrik Schön of Bell Laboratories and co-workers over the past two years. If suspicions of data fabrication are confirmed, however, it will be a devastating blow to one of the world’s leading research labs and the careers of those involved. The reputations of leading journals, the burgeoning field of single-molecule nanoelectronics and the physics community as a whole will also suffer. Bell Labs has done all it realistically can at this time by setting up a heavyweight panel to investigate the similarities (see Molecular electronics claims called into question and p5, print version).
Since early 2000 Schön and co-workers have dazzled the physics community with a breathtaking series of results on the electronic and optical properties of a variety of organic materials and molecules. The list seems endless: organic photovoltaic diodes and field effect transistors made of pentacene, a superconducting field effect switch based on carbon-60, observation of the fractional quantum Hall effect in pentacene and tetracene, a solid-state injection laser made of tetracene, and superconductivity in a variety of these molecules. In late 2000 they reported superconductivity in hole-doped carbon-60 at a temperature of 117 K (see Buckyball scores high-temperature goal and Physics World January 2001 p9, print version).
This remarkable programme of research culminated late last year when the researchers reported that they had made a single-molecule transistor. This was one of five or so key papers published by groups around the world that led Science to declare that nanocircuits were the “breakthrough of the year”.
Few groups have been able to reproduce their work but that was taken as evidence of the quality of the samples prepared by Christian Kloc, Schön’s experimental ingenuity and the experience of Bertram Batlogg, one of the world’s most eminent condensed-matter physicists (who recently moved from Bell Labs to the ETH Zurich). But it has now come to light that several graphs showing data from different experiments appear to be identical – right down to the noise in the signal. Just before the storm broke, Schön submitted a correction to Science – he had accidentally sent the wrong graph to the journal for the paper on the single-molecule transistor. However, there are close similarities between figures in five other papers. Further accidents or experimental artefacts have been mooted as explanations for the other similarities, but Schön and Bell Labs are not saying anything until the panel chaired by Malcolm Beasley of Stanford University reports its findings.
The volume of Schön’s work in recent years has been staggering – he has published more than 60 papers since January 2000. It is possible that the occasional figure went astray, but this would seem to have happened too often for this to be the explanation. Unless some other remarkable, but plausible, co-incidence or explanation is forthcoming, the consequences for the physics community will be tragic.
Science fiction: the ultimate factoid
The Science & Engineering Indicators published by the National Science Foundation (NSF) in the US is an impressive document that contains a wealth of information on a vast range of topics (www.nsf.gov/sbe/srs/seind02/start.htm). However, it is a short section on “the interest in science fiction” that catches the lazy eye. According to a recent NSF survey almost equal percentages of men (31%) and women (28%) read science-fiction books or magazines, but the Sci Fi television channel is watched by more men (55%) than women (45%). Readers who are not fans of science fiction will be relieved to learn that “there does not seem to be a relationship between level of education and watching Star Trek“.
David Hockney’s revelations concerning the methods of the Old Masters were first publicized over two years ago in an article in the New Yorker. However, it is only with the publication of this new book Secret Knowledge that the full impact of his discovery becomes clear. Hockney suggests – and attempts to prove – that many Western artists from the early 15th century onwards used mirrors and lenses to help them create paintings and drawings. His analyses and illustrations reveal that Renaissance painters used these optical devices to create projected images that they would then draw over. In doing so, the artists saved time and made achieving a photographic likeness possible.
Hockney points out so many clues and presents so much solid evidence that the reader will wonder why the Old Masters’ tricks were not discovered before. His evidence ranges from the almost irrefutable – such as measurable image properties – to suggestive and speculative observations. The latter include the appearance of an unusually large number of left-handed drinkers, caused, he claims, by the fact that mirrors reverse real images. Hockney also points to the frequent occurrence of white-topped tablecloths, which solve a problem of imaging distortion in optics, and to the fact that many paintings of the time have perfectly rendered parts that do not fit properly together – again caused by the limitations of optical devices.
Hockney’s argument, which is likely to lead to further revelations by other art historians, explains why paintings by van Eyck, Ingres and Vermeer look so different from those by earlier artists such as Giotto, Rubens and Rembrandt. He believes that van Eyck (1390-1441) was one of the earliest artists to achieve such “perfection” and that the new way of depicting the world quickly became widespread. Painting, says Hockney, transformed from painterly to photographic almost overnight – a revolution in art.
Having stared in awe for endless hours in museums and at art books at the incredible detail in such paintings, I used to look upon some of these works as unapproachable goals produced by supermen. Like discovering the reality behind a conjurer’s trick, it at first shocked and dismayed me to learn the “secrets” of the Old Masters. It never once occurred to me that such detail could have been achieved by tracing over images produced by lenses and mirrors.
However, my initial reaction eventually gave way to a new sense of freedom. Although I will still marvel over their works, I now perceive these great masters as highly talented artists, rather than unapproachable gods. They were businessmen, making a living creating images in a time when the man with the best image won the contract. Why should they not have used every method possible? Is an image-projecting device so different from a new type of brush or a paint that achieves some special effect? As professionals, their survival depended on using the latest technology and not disclosing new discoveries to the competition.
Hockney also points to the potential danger that such men faced during the Inquisition, when one could be burned at the stake for making magic with image-projecting devices. After all, such nigh-perfect images would have shocked those who had never seen them before. But while image-projecting devices cannot reduce great art to a painting-by-numbers exercise – drawing, even with optical instruments, is not a trivial task – such tools meant that a merely good artist could possibly surpass a great artist who was simply painting by eye.
The question is why we should have remained ignorant of something so obvious for so long. Fortunately for art history, Hockney managed to suspend his awe and reverence long enough to ask how the Old Masters achieved such “perfection”. Apparently, until now no one had ever seriously questioned why many artists stopped producing detailed drawings and studies before painting on the canvas, a practice that was common before the photographic look appeared. Hockney, however, had the curiosity, courage and wherewithal to ask why.
The book is written in a rather loose style, with three somewhat unintegrated parts. It begins with a visual section containing many paintings to illustrate the argument. There follows a textural section with excerpts, articles and notes that Hockney used in his research. The book ends with a series of letters and notes exchanged between the author and various experts as his investigation unfolded. The style requires the reader to redo some of the same work Hockney did in forming his conclusions.
But since the information in the three sections is not integrated, there is much repetition. Indeed, I found myself reading the same sentence in several different places in the book. And although the letters allow the reader to experience the thrill of the investigation, one must wade through all of the chitchat to glean the relevant details. Another quibble is that the book’s 400 figures – excellent though they are – are not identified in the standard format normally applied in art works. Many figures and pages are not even numbered.
Hockney’s writing style, organization and extensive use of circumstantial evidence are likely to attract much criticism. Indeed, his hypothesis was hotly debated at a recent conference sponsored by the New York Institute for the Humanities (www.artandoptics.com). Nevertheless, Secret Knowledge is a marvellous achievement. It is an absolute must-read for anyone who is interested in the history, politics, theory and technology of art. It is difficult to imagine how the book can fail to change the way art is viewed.
The sequencing of the human genome, along with other advances in the fields of molecular biology, genomics and proteomics, is leading to the discovery of large numbers of genes and proteins. Many of these are implicated in human disease and are therefore possible targets for drug development. We are all eagerly awaiting the new era of molecular medicine, when drugs are precisely tailored to our specific genetic or molecular profile, and when diseases such as cancer and Alzheimer’s can be treated easily without side effects.
While biologists are generating a wealth of information about many diseases, the translation of this knowledge from the test tube to the clinic has been slow and challenging. This is exemplified by the tragic and mystifying death of teenager Jesse Gelsinger, a participant in a gene-therapy trial at the University of Pennsylvania, and the limited success of many similar clinical trials around the world.
To be more efficient at converting new knowledge into effective treatments, we need to be able to answer a number of important questions. Which of the many genes and proteins that may be implicated in a particular disease should we target with new drugs? And once the target is chosen, there are enormous numbers of substances that could interact with or alter those targets. How do we sift through these many possibilities and determine which ones will work as drugs? How do we know if and when the results obtained in cell cultures, tissue preparations and animal models can be extrapolated to humans?
Successful clinical trials require large numbers of patients, so the number of new drugs that can be tested in humans is very limited. The process is also very expensive. We therefore need to make sure that only those drugs with a very high chance of success reach clinical trials. We also know that different patients respond differently to the same drug. So how do we select those patients who have the appropriate genetic or molecular profile to benefit from our new drug? And finally, how do we monitor the drug treatment to ensure at an early stage that the drug is going where it is supposed to go, and doing what it is supposed to do?
The answers to these challenging questions will require new scientific breakthroughs involving many different technologies. One set of technologies that looks poised to play a role is non-invasive imaging techniques that enable molecular targets and genetic processes to be visualized and measured in living subjects.
This is the emerging field of molecular imaging. Physicists, engineers and chemists are playing a crucial role by developing a whole new generation of imaging systems and contrast agents. They include magnetic resonance imaging with paramagnetic atoms, optical-imaging approaches using fluorescence or bioluminescent molecules, and techniques based on radioactive tracers, such as positron emission tomography (PET). These non-invasive techniques allow us to look inside the body, and they provide a window on biology in action.
Principles of PET imaging
In PET, tiny amounts of a biologically interesting molecule are labelled with a radionuclide that decays by emitting a positron. Most of the short-lived radionuclides that are suitable for imaging are isotopes of biologically ubiquitous elements and can be produced in compact biomedical cyclotrons (see table). This means that biomolecules can be labelled by direct isotopic substitution – for example a carbon-12 atom can be replaced with a radioactive carbon-11 atom, which has exactly the same biochemical properties and a half-life of 20 minutes.
One common radiotracer is 18F-fluorodeoxyglucose (FDG), an analogue of glucose that is labelled with the positron-emitting isotope fluorine-18 and is injected into a vein. Radiotracers like FDG are designed so that they spread throughout the body but only accumulate in tissues when they encounter a specific enzyme, protein or gene. The radiotracer builds up by binding to proteins on the cell surface, known as receptors, or by becoming trapped in the cells, as metabolic or enzymatic processes alter its chemical structure.
The distribution of the radiotracer therefore provides information on the distribution and concentration of specific molecular targets in the body, such as receptors, enzymes and transporters. In addition, how quickly the radiotracer accumulates in or clears from tissues often relates to the rates of biological processes in the body (for example rates of transport, synthesis, metabolism and excretion).
However, the radiotracer can also be a drug that is labelled with a positron-emitting radionuclide, in which case its distribution as a function of time mimics that of the drug. Exactly what is measured in a particular study depends on the radiotracer used. The goal is to design radiotracers that are specific to particular molecular targets or genetic processes, and there are many examples of PET radiotracers that meet this challenge.
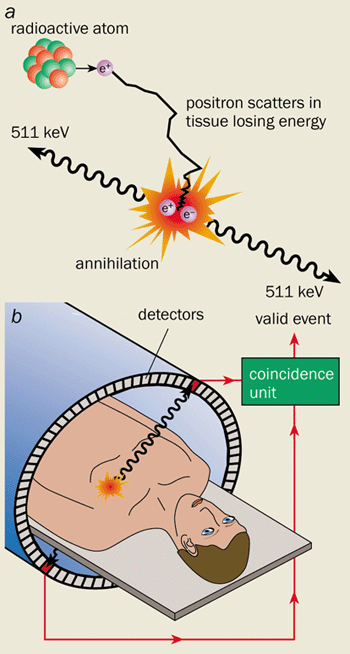
1 The basics of PET scanning (a) When a positron emitter such as fluorine-18 decays, the positron quickly loses its energy by interacting with electrons in the surrounding tissue. When the positron is almost at rest it annihilates with an electron. The mass of the electron and positron is converted into energy that is emitted in the form of two back-to-back 511 keV photons. (b) In a PET scanner these annihilation photons are detected by arrays of detectors surrounding the patient. A valid “event” occurs when two detectors record photons within a few nanoseconds of each other. To compute the 3-D distribution of the radionuclide requires a large number of measurements from many different angles (hence the ring design of many scanners).
The radiotracer’s distribution in the body is determined by measuring the radioactive decay products with a PET scanner. When a nucleus decays by positron emission, a proton in the nucleus converts into a neutron, and a positron and a neutrino are ejected. The neutrino leaves the scene without a trace, while the positron rapidly annihilates with a nearby electron.
Annihilation results in the mass of the two particles being converted into energy. Since the electron and positron are essentially at rest at the time of annihilation, this energy is released in a very specific manner, namely as the simultaneous emission of two photons almost 180° apart, each with 511 keV of energy (figure 1a). These energetic photons have a high probability of escaping through tissue and can therefore be detected externally.
A PET scanner consists of a large number of detector elements (or a series of large-area position-sensitive detectors) that surround the subject. If two detectors fire within a few nanoseconds of each other, the PET scanner records an “event”. Owing to the collinear nature of the two emitted photons, we immediately know that the site of annihilation lies somewhere in the volume between the two detectors (figure 1b). By collecting large numbers of events (typically 107-108) from many different angles around the subject, we can reconstruct 3-D images. The intensity at any point in the image reflects the concentration of radiotracer in the tissue.
There are two major goals in the design of a PET scanner. The first is to detect as many of the emitted photon pairs as possible to achieve a high signal-to-noise ratio. This ratio is proportional to the square root of the number of events that contribute to the image, so the quality of the PET scan improves as the number of detected events increases. The quality therefore depends on the amount of radioactivity in the tissue, the imaging time and the sensitivity of the scanner.
The second important goal is to localize photon interactions in the detectors as accurately as possible. This determines the spatial resolution, or sharpness, of the images. Two important factors limit the precision with which the location of the decaying nucleus can be determined and therefore the spatial resolution in PET. The first is the distance the positron travels before it annihilates, known as the positron range. For low-energy positron emitters, such as carbon-11 and fluorine-18, the mean range can be as low as a few tenths of a millimetre. For some higher-energy emitters it can be several millimetres.
The second factor is that the electron and positron are not completely at rest when they annihilate. Rather than being emitted back-to-back, the two annihilation photons will be emitted at a slight angle, and this results in a small positioning error, which depends on the separation of the detectors. For a human PET scanner with a detector separation of 80 cm the error is about 2 mm. For these reasons it is probably fair to say that PET in human imaging is unlikely to achieve a spatial resolution much better than 2 mm.
Isotopes for imaging
A partial list of radionuclides that decay by positron emission and have been used in biomedical imaging studies.
Radionuclide
Half-life
Maximum positron energy (MeV)
Carbon-11
20.1 minutes
0.96
Nitrogen-13
9.96 minutes
1.19
Oxygen-15
123 seconds
1.72
Fluorine-18
110 minutes
0.64
Copper-64
12.6 hours
0.58
Gallium-68
68.3 minutes
1.9
Bromine-76
16.1 hours
3.7
Rubidium-82
78 seconds
3.35
Iodine-124
4.18 days
1.5
PET in the hospital
The first studies to use positron-emitting radionuclides for medical applications were performed back in 1951 by William Sweet at Massachusetts General Hospital and Frank Wrenn at Duke University. In 1974 Michael Phelps, Ed Hoffman and Michael Ter-Pogossian at Washington University in St Louis developed PETT III, the first tomographic device for imaging positron-emitting radionuclides in humans and the forerunner of today’s clinical PET scanners.
PET spread quickly to major medical-research institutions where it was used to study human physiology and metabolism, in healthy subjects and those with a wide range of diseases. A number of clinical applications emerged, primarily based on the radiotracer 18F-fluorodeoxyglucose (FDG). The accumulation of FDG in the body leads to PET images in which the signal intensity is roughly proportional to glucose metabolism.
It turns out that many diseases affect glucose metabolism. In most cancers, for example, there is an enhanced uptake of FDG and this has led to PET being widely used to assess cancer patients, in particular, to check whether the disease has spread to distant sites. Many neurological diseases, including childhood epilepsy and Alzheimer’s, cause specific changes in the distribution of FDG in the brain that can be identified using PET scans.
PET also has important applications in heart disease, where FDG can provide information on the viability of cells in areas of the heart with low blood flow and help determine which patients are likely to benefit from bypass surgery. Indeed, PET has grown rapidly over the past decade, and there are now more than 600 PET scanners worldwide.
The vast majority of clinical PET scanners use scintillation detectors to record the pairs of annihilation photons. The scintillator is segmented into an array of crystals and is read out by a matrix of photomultiplier tubes. Photons interacting in the scintillator produce light that is converted into electrons and amplified by the photomultipliers. The ideal scintillator for PET would be dense, bright and fast, as well as cheap to manufacture and easy to handle.
Historically, bismuth germanate has been the scintillator of choice for PET. Because it is dense, it has a high interaction cross-section and the 511 keV photons can be detected more efficiently. The size of the elements in the scintillator determines the accuracy with which an event can be detected and therefore the spatial resolution of the PET scanner. In a typical device the elements are 3-6 mm across.
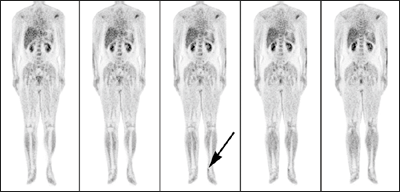
2 PET in the clinic A whole-body PET scan showing a stack of consecutive 2-D images moving from the front of the patient to the back. These images are from a patient with melanoma. The cancer is revealed by a build-up of the radiotracer FDG in the ankle (arrow). The resolution of the image is approximately 10 mm. (Picture credit: GE Medical Systems)
Another approach uses large slabs of thallium-doped sodium iodide coupled to a matrix of photomultiplier tubes. The position of the event is calculated from the relative magnitude of the signals in a cluster of photomultipliers surrounding the interaction. Thallium-doped sodium iodide, or NaI(Tl), is used because it is one of the brightest scintillators available and produces large, statistically reliable signals on each of the photomultiplier tubes. The spatial resolution of such detectors is typically about 4-6 mm.
Clinical PET scanners have evolved into sophisticated instruments, with as many as 20,000 scintillation elements multiplexed onto arrays of hundreds of photomultipliers surrounding the patient. They can process and sort hundreds of thousands of events per second. The sensitivity of most PET scanners (i.e. the percentage of photon pairs detected) is between 0.5% and 5%. It is limited primarily by the solid-angle coverage of the detectors that surround the patient, which in turn is limited by cost considerations.
What about the other factors that affect the quality of the final PET images? Patients in clinical imaging studies are usually injected with a 350 megabecquerel dose of radiotracer – equivalent to 350 million nuclear decays per second. This leads to a radiation dose that is similar to that received by patients undergoing other diagnostic imaging procedures, such as X-ray computed tomography. Imaging times vary from a few minutes to 1 hour depending on the imaging protocol. The spatial resolution of the final reconstructed images is limited by the number of collected events, rather than the detector resolution itself. Indeed, in the case of low signal-to-noise measurements, we smooth the images to achieve sufficient diagnostic quality. The typical spatial resolution of clinical PET images is 8-15 mm (figure 2).
PET in the biomedical-research laboratory
Much of the detector research for PET imaging over the past five years has focused on developing scanners for imaging animals. Biologists are creating sophisticated models of human disease in laboratory animals, particularly in the mouse, which shares roughly 95% of its genes with humans. An increasing number of important mouse models are being used to develop new therapeutic approaches for a range of deadly diseases including cancer and Alzheimer’s.
Imaging allows individual animals to be tracked non-invasively over time, which can speed up experiments and reduce the number of animals used in research. Moreover, the same imaging experiments can later be performed in humans, providing an all-important bridge between animal models and the clinic. This should lead to a better understanding of the appropriateness of the animal model in predicting the success of new therapeutic approaches. PET has obvious attractions for these studies because of the wide range of biological targets and processes that can be imaged using the appropriate radiotracer.
3 Improved tools for high resolution Advances in materials and technology have been driving the development of high-resolution animal PET scanners. (a) One of the new generation of compact multichannel photomultiplier tubes. (Picture credit: Hamamatsu) (b) An avalanche photodiode array, a possible solid-state replacement for photomultipliers. (Picture credit: RMD)
The challenge has been to find ways to dramatically improve the image resolution achieved in the clinical setting (8-15 mm), to the level needed to clearly resolve the organs in a mouse (1-2 mm). To achieve such detail requires high-resolution detectors and high-sensitivity systems. If PET is really to become a tool in the biologists’ laboratory, it is also important to develop systems that are quantitative, relatively low cost, compact and easy to use. Our group at the University of California at Davis, along with many other research groups around the world, has taken up this challenge. Aided by a number of important developments in detector technology, several successful PET systems for small animals have now been developed (figure 3).
Early work was carried out at the Hammersmith Hospital in the UK and at Sherbrooke University in Canada in the early 1990s, but breaking the 2 mm resolution barrier required new technology and a different approach. One catalyst was the availability of several new bright and fast scintillators, in particular lutetium oxyorthosilicate (LSO). With an effective atomic number of 66 and a light output that is two-thirds that of sodium iodide, LSO is one of the brightest and most dense scintillators known. These qualities enable small crystals of LSO to detect annihilation photons efficiently for images with a high spatial resolution.
The second technological advance was the dramatic improvement in multichannel and position-sensitive photomultipliers. In 1996 we put these two developments together and assembled detectors from LSO elements measuring 2 mm across mounted on a multichannel photomultiplier. Our prototype scanner – dubbed microPET – consisted of 1920 LSO elements arranged in eight rings around the animal. It produced PET images of living animals that broke the 2 mm resolution barrier for the first time (figure 4). At about the same time, Simone Weber from Jülich University in Germany and Alberto Del Guerra from Ferrara University in Italy developed animal PET systems with 2 mm resolution based on another new scintillator, yttrium perovskite. More recently Michael Green and colleagues at the US National Institutes of Health in Maryland have built a 2 mm resolution scanner based on layers of LSO and a closely related scintillator, gadolinium oxyorthosilicate, leading to higher-efficiency detectors. Meanwhile, the original microPET scanner has been commercialized by Concorde Microsystems in Tennessee, and more than 25 institutions have now taken delivery of these animal PET systems.
These new scanners have opened up many opportunities for research into animal models, but the spatial resolution is still too low to visualize important substructures in the mouse brain, the earliest manifestations of tumours or the spread of cancer to other organs. Three different groups are currently pursuing combinations of sub-millimetre LSO detector elements coupled to new-generation multichannel and position-sensitive photomultiplier tubes. Jack Correia and co-workers at Massachusetts General Hospital have built a PET scanner based on 1-D detector arrays that produce images with a resolution of 1 mm. Unfortunately, the device can currently only image single slices of an object, rather than the entire volume. Meanwhile, Robert Miyaoka at the University of Washington in Seattle has successfully built 2-D detector arrays that have a resolution of 1 mm. And our group has just completed the next-generation microPET scanner, which has 17 640 LSO detector elements measuring 0.95 x 0.95 mm, coupled to 90 multichannel photomultipliers.
The resolution of these new systems will soon hit some of the limitations due to the physics of positron annihilation. Moreover, the new detectors are likely to need sophisticated image-reconstruction algorithms that accurately model all the factors that degrade spatial resolution.
Alternative technologies
There are not many fields of science where vacuum tubes are still the technology of choice. Yet photomultiplier tubes have enjoyed extraordinary longevity in PET because of their high gain, low noise and fast response. For many years researchers have been attempting to develop solid-state photon detectors that have reasonable gain and high sensitivity in the blue part of the spectrum (which is where most scintillators emit their light), and that are fast enough for applications in PET.
4 Tabletop scanners for animals (a) A photograph of the microPET scanner developed in our laboratory. (b) This microPET image of a mouse shows a radiotracer accumulating in proportion to the “expression” of a particular marker gene. In this case the gene is being expressed in the liver (red and green). Note also some radioactivity at the site of injection at the base of the tail. (c) This image shows a radiotracer binding to cancer cells in a small tumour (arrow). The radiotracer has also accumulated significantly in the liver, and to a lesser extent throughout the whole mouse (purple and blue). The resolution of these images is approximately 1.5 mm. (Picture credit: Sanjiv Gambhir/UCLA)
Finally, after years of development, arrays of silicon “avalanche photodiode detectors” (APDs) have become commercially available and are finding their way into animal PET scanners. Photons emitted from the scintillator generate an electron-hole pair in the APD. The applied electric field (as high as 106 V m-1) accelerates the electron sufficiently to create further electron-hole pairs, leading to an avalanche effect. Internal gains between 50 and 1000 have been achieved depending on the structure of the device. A prototype animal PET scanner based on LSO scintillators and APDs has been constructed by Sybille Ziegler and Bernd Pichler at the Technical University of Munich. Meanwhile, a group known as the Crystal Clear Collaboration at CERN in Geneva is developing APD-based devices and will be working with three European universities to build small-animal PET scanners.
Almost all the animal PET scanners built so far have used scintillation detectors because of their high efficiency at detecting 511 keV photons. However, a very different approach has been developed by Alan Jeavons at Oxford Positron Systems in the UK using multiwire proportional chambers, which were first developed for use in particle physics. This system consists of four large detectors, each containing a stack of wire chambers interleaved with a sandwich of thin lead plates that are drilled with a fine matrix of holes. The lead plates convert a small fraction of the incident annihilation photons into electrons while the wire chambers determine the position of the charge. While these detectors can provide sub-millimetre resolution, they have a much lower efficiency per unit area compared with scintillation detectors. This will ultimately limit the sensitivity of PET scanners based on this technology.
It is exciting to see so many different detector approaches being developed and used for small-animal PET imaging. It is even more exciting to see the array of applications that these high-performance imaging systems have opened up, independent of the specific technology. These applications include imaging specific receptor systems in mouse and rat brains, imaging the effectiveness of new anti-cancer agents in mouse models, and studies into the effect of brain injury, such as sports-related trauma, on brain function.
Recently, Sam Gambhir and co-workers at the University of California in Los Angeles and Ron Blasberg’s group at Sloan-Kettering Hospital in New York successfully merged the techniques of molecular biology and radiotracer development to track specific genes in living animals using PET. In particular they have been able to follow how these genes are “expressed” or translated into proteins within the body over time (figure 4). This important work takes us one step closer to using PET to monitor the effectiveness of new gene therapies for humans, in which missing or “under-expressed” genes are introduced into the body.
Molecular imaging meets anatomic imaging
PET radiotracers accumulate wherever they encounter the biomolecules or the biochemical pathways with which they are designed to interact. In general, the uptake of radiotracers that have been tailored towards highly specific reactions is restricted to very few regions in the body. On a PET image these regions just appear as shapes with little or no anatomical information, making it difficult to interpret the scan. For example, researchers find it hard to tell if the radioactivity seen around the prostate region of a mouse is due to a specific accumulation in cancer cells or just a build-up of radiotracer that has been flushed into the bladder. Is an accumulation of radiotracer in the chest really in the lung tissue or is it in the rib bone? The lack of anatomical information is a problem both in human and in small-animal PET studies.
Software approaches for combining data from different imaging techniques have been around for many years and have become increasingly sophisticated. These work well in the brain because it is highly constrained by the skull, making it relatively straightforward to overlay two image data sets precisely. However, this approach becomes very difficult in the rest of the body because organs move about and change shape depending on how the patient lies in the scanner. Things also change over time – for example the bladder changes shape as it fills with urine and causes surrounding tissues and organs to move.
One of the most important developments in recent years has therefore been the development of “multimodality” imaging systems, in which PET scans and high-resolution anatomic images are acquired at essentially the same time in a single device. The most successful integration has been PET with X-ray computed tomography (CT), an idea developed by David Townsend and colleagues at the University of Pittsburgh in collaboration with CTI PET Systems in Knoxville.
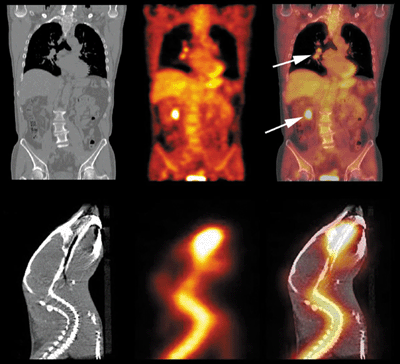
5 Two images are better than one Integrated PET/CT scanners mean that images from positron emission tomography and X-ray computed tomography can be correlated precisely. (a) CT and PET images of a cancer patient’s chest. The CT scan (left) gives anatomical information while the PET scan (middle) reveals the metabolic activity of the radiotracer FDG by the cancer. The primary tumour in the lung and the spread of cancer to the colon are indicated by arrows. (b) Simultaneous images from a prototype animal PET/CT system at University of California at Davis. The radiotracer here is fluoride-18 ions, which accumulate in the bones of this mouse. The correspondence between the PET signal and the CT image of the skeleton is apparent (right). (Picture credits: CTI PET Systems, Andrew Goertzen/UCLA and UC Davis)
Townsend’s group placed a clinical PET detector in tandem with a clinical CT scanner around a patient bed. The new device allowed PET and CT images to be obtained in quick succession and overlaid with almost perfect correlation (figure 5a). Combined PET/CT scanners are now available from a number of manufacturers and are having a huge clinical impact. Any suspicious anatomical abnormality seen on the CT scan can now be correlated with the metabolic activity of that region from the PET scan. A high level of activity indicates a malignant cancer, while a low level implies a more benign process.
Our group at Davis has been exploring PET/CT imaging for small-animal studies. We have combined our microPET detector technology with flat-panel amorphous selenium X-ray detectors, which were originally developed for digital mammography. In this case the system is coplanar, meaning that the same region is scanned simultaneously with PET and CT (figure 5b). The low-energy X-rays suitable for imaging small animals can easily be separated from 511 keV annihilation photons in the detector.
Work is also under way to develop combined PET and magnetic resonance imaging techniques. Magnetic resonance imaging has several advantages over CT scanning – it provides better contrast in soft tissue and is also capable of functional and spectroscopic measurements. However, integrating these two technologies is much more challenging owing to the high magnetic fields used in scanners for magnetic resonance imaging (up to 10 T), and the need for high field uniformity (1 part in 106).
Nonetheless our group at Davis, together with Paul Marsden at Kings College, London, has started investigating PET imaging systems that can be placed inside the bore of conventional scanners for magnetic resonance imaging. Successful prototypes have been developed that use optical fibres to pipe the scintillation light from a ring of LSO elements inside the magnet to photomultiplier tubes and electronics 3 metres away. This distance minimizes any problematic interactions between the magnetic field and the photodetectors and electronics. The first studies of animals in which PET and magnetic resonance images are acquired simultaneously should be under way by the end of the year.
A bright future for PET
Recent advances in PET-detector technology have resulted in high-performance imaging systems that enable PET to be used from mouse to man. This provides a critical bridge between mouse models of disease – where new therapeutic approaches will be developed – and the clinic, where these therapies will ultimately be applied. The future appears to be very bright.
PET could be used to non-invasively and efficiently assess new drugs in animal models, and may play a role in selecting the drugs that should move forward into clinical trials. In humans, PET could help to diagnose molecular or genetic diseases. It could also be used to assess whether a very low and safe quantity of a drug reaches its target in sufficient concentration to exert the desired biological effects. PET imaging might even be used to select patients who will respond to a particular drug, and could monitor the direct biological effects as the patient is treated.
There is a long way to go before we can put these approaches together, but the technology now exists to undertake these types of studies. Perhaps the clearest sign of the potential role of PET in preclinical and clinical medicine is that virtually all the major pharmaceutical companies are collaborating with academic PET centres. Several of these companies are even setting up their own PET-imaging facilities.
Probably the biggest single challenge now is in radiotracer design. There are many biological targets of interest for which we do not yet have good radiotracers, and many others where novel radiotracers await proper characterization. We can also look forward to further improvements in the resolution and sensitivity of PET scanners – for both humans and animals – and perhaps significant reductions in the cost of these systems.
All these improvements will almost certainly be driven by new technologies – such as better scintillators, new photodetectors and dense semiconductor materials – and these will most likely be discovered and developed by the physics community. Indeed, there has never been a better time for physicists to work with chemists and biologists to build the tools and techniques needed to translate our growing understanding of biology into safe and effective new treatments for disease.
Physicists love quotations. How often have you read that “God does not play dice with the universe,” or that “Anyone who is not shocked by quantum theory has not understood it,”? When physicists write or say “as Newton/Einstein/Bohr/Feynman once said…”, it immediately gives them authority by closely identifying them with one of the giants of physics – or so they think. “A facility for quotation covers the absence of original thought,” as Lord Peter Wimsey says in one of Dorothy L Sayers’ stories.
Wimsey’s comment is particularly true when researchers quote what Michael Faraday is supposed to have said to senior politicians of the day. The story goes that Faraday had just explained some of his findings in electricity and magnetism to either the prime minister or the chancellor. However, the politician was unimpressed and asked the 19th-century experimentalist “What good is it?” or “What use is it?” Faraday is supposed to have replied, “What good is a new-born baby?” or “Why sir, there is the probability that you will soon he able to tax it.”
Now Faraday was a brilliant scientist who, it would seem, had a way with words and whose work certainly had an immense and lasting impact on the way we live. The same cannot be said for all of those scientists who glibly quote Faraday because they simply do not know or do not care how their research might be relevant to anyone, let alone relevant to society, industry and anything else.
By the way, the quotations about babies and taxes that are attributed to Faraday are almost certainly apocryphal because they are not mentioned in any accounts by Faraday or his contemporaries. That is the trouble with a lot of quotations – like the words “Play it again Sam,” in Casablanca, no-one ever said them.
Knowing the literature
Of course, some people are not content with quoting physicists, they want to quote writers and politicians as well – just like I did at the end of the first paragraph of this article. Indeed, if you can work some Shakespeare or poetry into an article, you are no longer just a physicist of distinction, you are also extremely knowledgeable about the arts.
A classic example of being widely read is displayed in Methods of Mathematical Physics by Harold and Bertha Jeffreys. Each of the 25 chapters in this classic monograph begins with a carefully chosen epigraph taken from a great work of literature. Henrik Ibsen, for example, supplies the epigraph for the chapter on contour integration – “Go round about, Peer Gynt.”
A more recent example of this is the intriguingly titled Vacuum Bazookas, Electric Rainbow Jelly and 27 Other Saturday Science Projects by Neil Downie (2002 Princeton University Press), which includes epigraphs from J R R Tolkien, William Blake, Ian Fleming, Edgar Allen Poe and many others.
Another fine example of epigraphy can be found in the late Walter Welford’s book Optics: six of the nine chapters start with short quotations from Ulysses by James Joyce. “Glass flashing. That is how that wise man what’s his name with the burning glass. Then the heather goes on fire,” is the typically Joycean passage that appears at the start of the chapter on laser light.
Indeed, Joyce’s opaque prose has had a major impact on physics, with the word “quark” coming from Finnegans Wake. As Murray Gell-Mann – who received the 1969 Nobel prize for the theoretical discovery of quarks and their interactions – explains in The Quark and the Jaguar, he had decided how the word “quark” would sound before he knew how to spell it. Then, on one of his “occasional perusals of Finnegans Wake“, he came across the phrase “Three quarks for Muster Mark.”
Actually, it gets rather complicated because the sound that Gell-Mann had in mind was “kwork”, whereas Joyce clearly meant quark to rhyme with Mark. (See Gell-Mann’s book for more details. Note also the absence of the apostrophe in Finnegans Wake – this is a true sign of someone who knows his Joyce.)
Of course, it is not all one-way traffic from literature to physics. The very best novelists and playwrights have used ideas from modern physics in their work. Martin Amis regularly relies on physics imagery in his fiction – in London Fields shirts are “electromagnetic” and the world is “crazy like an X-ray laser”.
And the American writer John Updike captures the very essence of neutrinos in just a few lines in his poem Cosmic Gall:
Neutrinos, they are very small. They have no charge and have no mass And do not interact at all. The earth is just a silly ball To them, through which they simply pass, Like dustmaids down a drafty hall Or photons though a sheet of glass. They snub the most exquisite gas
In his book, Gell-Mann suggests that “do not” should be changed to “scarcely” in the third line, but again that is another story.
You can quote me on that
But how do quotations – especially those by famous physicists – get into circulation? There are several excellent books of scientific quotations, such as Physically Speaking – which was compiled by Carl Gaither and Alma Cavazos-Gaither (1997 Institute of Physics Publishing) – and The Expanded Quotable Einstein, edited by Alice Calaprice (2000 Princeton University Press). And Web sites such as www.bartleby.com/quotations and www.quotationspage.com are useful when you are looking for a quotation to serve a very precise purpose – like the quotation about quotations I quoted earlier. But that does not explain how clever things said by physicists today will be repeated by the physicists of tomorrow.
I must confess a selfish interest here. I have made several unsuccessful attempts to get the phrase “Richard Feynman is the Jimi Hendrix of physics,” into general use. The first time I did this – in an article about the number of books Feynman had “published” after he died (see Physics World October 1998 p3) – I carefully explained the analogy: “Feynman is fast becoming the Jimi Hendrix of physics. Both were great showmen and revolutionaries who continue to exert enormous influence. And just as Hendrix has ‘released’ dozens of albums since he died, compared with just four when he was alive, Feynman seems to be doing the same.” I promise that this is the last time I will inflict the phrase “Richard Feynman is the Jimi Hendrix of physics,” on anyone – but please feel free to use it yourself.
Luckily I am not alone in being ignored. I have always felt it a great shame that the verb “to Hubble” – meaning to screw up in a major unfocused way (Physics World December 1994 p41, print version only) – did not enter common usage. Similarly Robert Park’s description of repeated reports of new data supporting cold fusion as the physics equivalent of “Elvis sightings” (www.aps.org/WN/WN90/wn060890.html) was just too good to be ignored. But it was.
So what recent quotations have entered general use? Well I have a theory about this. To gain widespread acceptance a quotation must involve God or have been said by Stephen Hawking. Think of the most widely quoted sayings that have originated over the past 15 years: Hawking saying that each equation in his book would halve sales; Hawking talking about “knowing the mind of God” at the end of A Brief History of Time; Leon Lederman calling the Higgs boson the “God particle”; and George Smoot saying that measuring fluctuations in the cosmic background radiation was like “seeing the face of God”.
As always, sex makes good copy, and again Hawking is the modern master. “There’s nothing like the eureka moment of discovering something that no-one knew before,” he said earlier this year. “I won’t compare it to sex, but it lasts longer.”
And what about love? Well physicist love quotations – you can quote me on that, I read it somewhere.
Quotations quiz
(a) “I could be bounded in a nutshell and count myself a king of infinite space.” Which Shakespeare play does this line come from, and for which popular physics book did it provide the title?
(b) “If he was around now, I’d love to buy him a beer…but I don’t know if I’d introduce him to my sister.” Who is being described here?
(c) Who said: “The effort to understand the universe is one of the very few things that lifts human life a little above the level of farce and gives it some of the grace of tragedy.”?
(d) Who said: “The more the universe seems comprehensible, the more it also seems pointless.”?
(e) Which theoretical physicist – once described as “a slender blend of Father Christmas, God and a member of The Grateful Dead” – coined the phrase “the theory of everything”?
Buy the books • Physically Speaking: A Dictionary of Quotations on Physics and Astronomy by Carl Gaither and Alma Cavazos-Gaither: IOP bookmarkphysics • The Expanded Quotable Einstein, ed Alice Calaprice: Amazon UK/Amazon US
The detection of microwave photons is crucial for a wide range of fundamental research, as well as the development of new devices. Microwave radiation is associated with the superconducting energy gap in superconductors, the energy gaps in semiconductor nanostructures, and the rotational and vibrational excitations of molecules.
But although single-photon detectors already exist for visible light, it has proved more difficult to make a similar device for microwave photons because they are typically around a thousand times less energetic. Physicists have previously built a detector that is sensitive to single photons in the far-infrared range, but it used strong magnetic fields that – in many cases – would destroy the very effect that the detector was trying to observe.
Now Astafiev and colleagues have designed a non-magnetic device that is based on two electrically connected quantum dots. Quantum dots are nano-sized deposits of one semiconductor embedded in another semiconductor. Since the dot material has an energy bandgap that is smaller than that of the surrounding material, it can trap charge carriers.
The quantum dots in the new device are made from gallium arsenide and aluminium gallium arsenide. When a photon arrives at the first dot, it excites an electron into the conduction band of the dot, and a strong bias voltage transfers this electron to the second quantum dot. This dot acts as a single-electron transistor, which is switched by the electron to register the photon. This one-way transfer of single electrons is crucial because it prevents an excited electron returning to its ground state in the first quantum dot before it can be registered.
Ostafiev and colleagues believe their detector, which is sensitive to photons with wavelengths in the sub-millimetre range, is very versatile. It can detect photons with frequencies as low as 410 GHz – compared with a lower limit of 448 GHz for the earlier device – and the researchers say that it could be tuned to respond to different wavelengths by using quantum dots of different sizes.
The team also says that it should be possible to make the device from silicon only, which would make it compatible with a wide range of existing electronic devices. Since the detector uses no magnetic field, the team is optimistic that it will also be suitable for a wide range of applications.
To create a Bose-Einstein condensate, all of the constituent particles must be cooled to just above absolute zero so that their de Broglie wavelength is comparable to their separation distance. The first condensate of atoms was created in 1995, but it has been difficult to make the molecular analogue because many of the techniques used to cool atoms – such as laser cooling – do not necessarily work for molecules.
Rather than cooling molecules until they condensed, Donley and co-workers converted part of an atomic condensate into molecules. To do this they used a magnetic pulse to tune the energy of pairs of colliding atoms within the condensate. However, since only a fraction of the atoms could have been converted into molecules, the condensate existed in a quantum superposition of atoms and molecules.
To establish that the condensate was indeed in a superposition, the researchers applied a second magnetic pulse to break the superposition and then immediately measured the number of atoms in the condensate. They discovered that this number – a measure of the relative phase between the atomic and molecular states – varied sinusoidally as the time between the pulses was increased. The frequency of this variation matched that expected from quantum mechanical calculations describing the atomic collisions within the condensate. The JILA researchers say that this agreement between theory and experiment provides strong evidence for a coherent superposition of atomic and molecular states.
The work could lead to developments in cold molecular spectroscopy and to a better understanding of molecular collisions. It could also be used to explore the physics of zero-temperature chemical reactions, and to create entangled molecules for quantum computing.
However, other physicists are not convinced that the JILA group has observed a molecular Bose-Einstein condensate. Daniel Heinzen of the University of Texas says that the research is “tantalizingly close” to demonstrating a molecular condensate, but says that what is actually generated in the experiment is a gas of pairs of atoms, each of which is in a coherent superposition of a bound state molecule, a pair of atoms in the condensate, and pair of atoms that are not in the condensate. “I think this is somewhat different to a mixture or superposition of a molecular condensate and an atomic condensate,” he says. He adds that the short lifetime of the gas may in fact make it impossible to observe molecular coherence within the gas.
Carl Wieman, one of the JILA researchers and a recipient of the 2001 physics Nobel prize for his creation of atomic Bose-Einstein condensation, believes that further proof is not really necessary. “If it walks like a duck and quacks like a duck then it’s a duck,” he says of his group’s work.