Great gaffe in the sky: the erroneous physics behind The Dark Side of the Moon

This year marks 50 years since British rock band Pink Floyd released their seminal album The Dark Side of the Moon. From my experience as a physics teacher, I can tell you that most teenagers today would struggle to name a single track on the album. But a majority of them still do recognize the iconic album cover, which depicts light refracting through a triangular prism. Indeed, I am convinced that students will be able to name both the album and the band if shown the artwork (even though neither appears on the front cover) making it a useful tool in the physics classroom even today.

In terms of actual physics behind the art, I’ll skip right past the fact that the Moon does not have a true “dark side” – simply a “far side” that we cannot see from the Earth, as the Moon is tidally locked.  Amusingly enough, this is even referenced on the album itself where a background voice says “there is no dark side to the Moon, really” before adding “as a matter of fact, it’s all dark…” This is, perhaps, a nod to the fact that the Moon does not produce its own light?

Setting these astronomical facts aside, there are two interesting aspects to the design that are directly relevant to physics students. One is how – if the original gatefold design is fully opened up – you see an image with light going through two prisms. In it, the light is split into its constituent colours before passing through a prism, but is then recombined into white light before passing through a second prism, and then being split up again.

Apparently, this was done to allow interesting displays in record shops. Nevertheless, it illustrates one of Isaac Newton’s earliest contributions to optical physics, as it shows how white light is dispersed into its constituent colours by a prism, and how it can be recombined through another prism. A previous Physics World article – “Web of confusion” (May 2022) – has already highlighted a lively classroom discussion on some of the errors therein.

But there is another aspect of the album’s artwork that is equally worthy of attention in physics classrooms. Can we use it determine the refractive index (RI) of the prism illustrated in the original image, and to find out if it corresponds to any available material? The RI of a material is essentially a measure of the extent to which light refracts as it enters or leaves the material. It is easily calculated, if one can measure the angles between the path of the light and a line drawn at right angles to the surface, known as the “normal”.

I printed a few copies of the artwork and enlisted the help of some students to determine the RI of the material on the cover. We added in the normal where the light strikes the prism and where it emerges, and carefully measured the various angles of incidence and refraction, which allowed us to calculate values for the refractive index. Or should I say refractive indices – because what we discovered was somewhat disturbing.

Having more than one RI isn’t a problem in itself. After all, at the two extremes of the spectrum, the RI for the violet light has to be greater than that of the red light. That’s why the light separates into its different colours: violet light slows down far more than red light when it enters a dense material, and that is why it bends through a greater angle. In fact, I had checked out typical values in advance and knew that the RI for red light passing through glass is usually about 1.51, while for violet light it’s about 1.53. But the Dark Side of the Moon image doesn’t produce values anything close to either.

On the way into the prism on the album cover, the angles of incidence and refraction for the violet light yield an RI of 2.42, which is far too high to be ordinary glass. After digging around, we did find that it closely matches the RI of zincite – a transparent mineral that mainly contains zinc oxide. But zincite is usually tinted either yellow or red, so it hardly matches the image in the photo.

That doesn’t really matter, though, as the material simply cannot be zincite or anything else for that matter. Because if it were zincite, we’d expect a similar, though slightly smaller, value for the red light. In fact, we get a value of 1.15 for red, which doesn’t correspond to any common material that I can track down.

I wondered briefly if variations in the density of the prism could account for the inconsistencies, but that doesn’t work either

It gets worse. When the light emerges to the right of the image, the angles measured there give us two more, entirely inconsistent, values: 1.08 for the violet light, and 1.85 for the red.

I wondered briefly if variations in the density of the prism could account for the inconsistencies, but that doesn’t work either. Simply put, if the density (and the RIs) of the glass were varying, we’d expect to see the light follow a curved path through the glass, which does not make any sense. It’s almost as though Storm Thorgerson, who designed the album cover, decided to completely ignore Snell and the laws of refraction.

It wouldn’t even have been that difficult for Thorgerson to create a more accurate and realistic version of the path the light should take. Just look at the image above, which was taken in 2017 by Mason Maxwell – an amateur photographer – using a glass prism. It shows what the Pink Floyd cover should really have been.

Perhaps we can attribute the errors to artistic licence and a lack of general optics expertise. Maybe the request from Pink Floyd keyboardist Richard Wright for a “simple and bold” design – symbolizing the album’s deep themes surrounding riches, greed and conflict – ultimately “eclipsed” scientific accuracy. Either way, 50 years on, this iconic image is here to stay.

Photons from nuclear clock transition are seen at long last

The first direct measurement has been made of a thorium-229 nuclear transition that could potentially form the basis for a “nuclear clock”. Done at CERN, the research follows a 2016 experiment that confirmed the transition’s existence but did not detect the resulting emitted photon. Much work remains before a working clock can be produced, but if such a device proves possible, it could prove an important tool for research in fundamental physics.

The most accurate clocks today are based on optically trapped ensembles of atoms such as strontium or ytterbium. Highly stable lasers are locked into resonance with the frequencies of specific atomic transitions, and the laser oscillations effectively behave like pendulum swings – albeit with much higher frequencies and therefore greater precision. These clocks can be stable to within 1 part in 1020, which means that they will be out by just 10 ms after 13.7 billion years of operation – the age of the universe.

Atomic clocks are not just great timekeepers, physicists have used them to study a range of fundamental phenomena such as how Einstein’s general theory of relativity applies to atoms confined in optical traps. In search of ever greater precision and deeper insights, in 2003 Ekkehard Peik and Christian Tamm of Physikalisch-technische Bundesanstalt in Braunschweig, Germany proposed that a clock could be produced by interrogating not electronic energy levels of atoms but nuclear energy levels.

Much smaller antenna

Such a nuclear clock would be extremely well isolated from external noise. “An atom is something like 10-10 m [across]; a nucleus is something like 10-14 or 10-15 m,” explains Sandro Kraemer of KU Leuven in Belgium, who was involved in this latest research. “The nucleus is a much smaller antenna for the environment and is thus much less prone to shifts.”

A nuclear clock might therefore be an excellent probe of hypothetical, very tiny temporal variations in the values of fundamental constants such as the fine structure constant, which quantifies the strength of the electromagnetic interaction. Any such changes would point to physics beyond the Standard Model. Moreover, nuclear binding is stronger than its atomic counterpart, so the shifts between energy levels are higher in energy and would be resonant with higher-frequency lasers, making a smaller change detectable.

This is a double-edged sword, however, as most nuclear transitions occur at much higher frequencies than can be produced by today’s lasers. Thorium-229, however, has a metastable excited state around 8 eV above the ground state – a transition that lies in the vacuum ultraviolet.

Suitable for excitation

Kraemer explains that building a laser to excite this state should just about be possible, “Out of 3000 or so radionuclei we know today, thorium is the only one we know that has a state suitable for laser excitation”.

First, however, researchers need to know the exact frequency of the transition. Indeed, the decay had long been predicted by theory, but attempts to detect the photon emitted had proved unsuccessful. In 2016, however, researchers at Ludwig Maximilian University of Munich indirectly confirmed its existence by measuring the emission of electrons in a process called internal conversion, in which the energy of the nuclear decay ionizes the atom.

Now, Kraemer and colleagues have made the first direct detection of the emitted vacuum ultraviolet photons by studying excited thorium-229 ions. The underlying idea is not new, Kraemer says, but previously researchers have tried to do this by implanting uranium-233 into crystals, which can decay to the excited thorium-229. The problem, says Kraemer, is that this releases over 4 MeV of energy into the crystal, which “is good for killing cancer, but really bad for us” as it damages the crystal, interfering with its optical properties.

In the new work therefore, the researchers used CERN’s ISOLDE facility to implant actinium-229 ions into magnesium fluoride and calcium fluoride crystals. These can decay to the metastable excited thorium-229 nucleus by β-decay, which releases four orders of magnitude less energy into the crystal. The researchers could therefore detect the photons and measure the transition energy. The final precision is still well short of the uncertainty needed to build a clock, and the researchers are now working with laser physicists to refine this.

Kyle Beloy of the US National Institute for Standards and Technology is impressed by the measurement. “There is very significant potential for this thorium-229 system as a nuclear clock and even more so to do tests of fundamental physics eventually,” he says. “In this [work], they observe a photon as it is emitted from the excited state down to the ground state, and ultimately the goal of the community here is to do the reverse. The narrow band of frequencies that the nucleus will absorb is on the order of millihertz, whereas how well we know that is on the order of 1012 Hz, so it’s like a needle in a haystack, and essentially what they’ve done is to reduce the size of the haystack by a factor of seven. That’s a big step forward for anyone searching to excite the transition.”

The research is described in Nature.

Perovskite solar cells reach new milestones for stability and efficiency

It’s been a good couple of months for perovskite solar cells, with a trio of new results that could make it easier to commercialize these next-generation devices.

The first result concerns perovskite-only solar photovoltaic (PV) cells. The initial promise of perovskite solar cells has long been impaired by the unstable nature of these crystalline materials, which are prone to surface defects that impede the flow of charge carriers (electrons and holes). Annoyingly, heat and moisture – both unavoidable in any practical solar-energy device – make this instability worse. Consequently, perovskite solar cells can lose around a third of their efficiency after just a few hundred hours’ exposure to sunlight.

Last year, Stefaan de Wolf and colleagues at King Abdullah University of Science and Technology (KAUST) in Saudi Arabia took an important step towards solving this problem by constructing a cell that incorporates both three-dimensional and two-dimensional perovskite crystals. This multidimensional cell retained 95% of its initial efficiency after 1000 hours of exposure to sunlight at a temperature of 85°C and a relative humidity of 85%.

In the latest study, published in Joule, Kai Liu and colleagues at Fudan University in China and the University of Victoria in Canada went a little further. Their cell retained 98.6% of its initial efficiency after 1000 hours of operational tests, thanks to a chemical coating that forms covalent bonds with the organic components in perovskites. According to the University of Victoria spin-out firm behind the coating, XLYNX, these bonds make the perovskite more stable, thereby limiting losses of efficiency, stability and performance.

Efficiency records tumble for tandem cells

The second promising result is a new efficiency record for so-called “tandem” solar cells, which combine perovskites with standard silicon material. In mid-April, researchers at KAUST, also led by de Wolf, announced that they had produced an experimental tandem cell with a power conversion efficiency of 33.2%. This value surpasses the previous world record of 32.5%, which was set in late 2022 by Steven Albrecht and colleagues at Helmholtz-Zentrum Berlin.

Though the latest KAUST result has not been published yet, the team say the record has been certified by the European Solar Test Installation (ESTI). The KAUST cell is also currently at the top of the US National Renewable Energy Laboratory’s (NREL) Best Research-cell Efficiency Chart, though it may not stay there for long, given the recent pattern of competing research groups leapfrogging each other’s achievements.

The final new result is yet another efficiency record, this time in a commercial product rather than an experimental device. On 24 May, the UK-based firm Oxford PV reported that a tandem cell manufactured at its production line near Berlin, Germany, converted 28.6% of incident solar energy into electricity. This figure, which has been certified by experts at Fraunhofer ISE in Freiburg, Germany, is significantly higher than the 22-24% typical of commercial silicon cells, and 1.5% above Oxford PV’s own record for a production-line device. Onwards and upwards!

Machine learning meets nanotechnology, award-winning implant regulates blood pressure

This episode of the Physics World Weekly podcast features an interview with Amanda Barnard, who began her career as a theoretical physicist and now leads a multidisciplinary research group that applies computational science across a wide range of fields including nanotechnology, materials science, chemistry, and medicine.

Barnard is also deputy director and computational science lead at the School of Computing at the Australian National University in Canberra. She talks about her interest in applying machine learning to a wide range of problems, and about the challenges and rewards of doing university administration. Barnard is editor-in-chief of the journal Nano Futures, and she talks about how this role enhances her understanding of the field.

Also in this episode, medical researcher Jordan Squair talks about a new medical implant that could help regulate blood pressure in people with spinal-cord injuries. Squair, who is based at EPFL in Switzerland, tells Physics World’s Tami Freeman about how the device was created and how it was successfully tested on a human subject.

Freeman also congratulates Squair on winning the BioInnovation Institute & Science Prize for Innovation for his development of the implant.

This podcast is sponsored by iseg.

Palladium oxides could make better superconductors

Palladates – oxide materials based on the element palladium – could be used to make superconductors that work at higher temperatures than cuprates (copper oxides) or nickelates (nickel oxides), according to calculations by researchers at the University of Hyogo, Japan, TU Wien and colleagues. The new study further identifies two such palladates as being “virtually optimal” in terms of two properties important for high-temperature superconductors: the correlation strength and the spatial fluctuations of the electrons in the material.

Superconductors are materials that conduct electricity without resistance when cooled to below a certain transition temperature, Tc. The first superconductor to be discovered was solid mercury in 1911, but its transition temperature is only a few degrees above absolute zero, meaning that expensive liquid helium coolant is required to keep it in the superconducting phase. Several other “conventional” superconductors, as they are known, were discovered shortly afterwards, but all have similarly low values of Tc.

Beginning in the late 1980s, however, a new class of “high-temperature” superconductors with Tabove the boiling point of liquid nitrogen (77 K) emerged. These “unconventional” superconductors are not metals but insulators containing copper oxides (cuprates), and their existence suggests that superconductivity may persist at even higher temperatures. Recently, researchers have identified materials based on nickel oxides as being good high-temperature superconductors in the same vein as their cuprate cousins.

A major goal of this research is to find materials that remain superconducting even at room temperatures. Such materials would greatly improve the efficiency of electrical generators and transmission lines, while also making common applications of superconductivity (including superconducting magnets in particle accelerators and medical devices like MRI scanners) simpler and cheaper.

A fundamental unsolved problem

The classical theory of superconductivity (known as the BCS theory after the initials of its discoverers, Bardeen, Cooper and Schrieffer) explains why mercury and most metallic elements superconduct below their Tc: their fermionic electrons pair up to create bosons called Cooper pairs. These bosons form a phase-coherent condensate that can flow through the material as a supercurrent that does not experience scattering, and superconductivity appears as a result. The theory falls short, however, when it comes to explaining the mechanisms behind high-temperature superconductors. Indeed, unconventional superconductivity is a fundamental unsolved problem in condensed-matter physics.

To better understand these materials, researchers need to know how the electrons of these 3d-transition metals are correlated and how strongly they interact with each other. Spatial fluctuation effects (which are enhanced by the fact that these oxides are typically made as two-dimensional or thin-film materials) are also important. While techniques such as Feynman diagrammatic perturbations can be used to describe such fluctuations, they fall short when it comes to capturing correlation effects like the metal-insulator (Mott) transition, which is one of the cornerstones of high-temperature superconductivity.

This is where a model known as dynamic mean field theory (DMFT) comes into its own. In the new work, researchers led by TU Wien solid-state physicist Karsten Held used so-called diagrammatic extensions to DMFT to study the superconducting behaviour of several palladate compounds.

The calculations, which are detailed in Physical Review Letters, reveal that the interaction between electrons must be strong, but not too strong, to achieve high transition temperatures. Neither cuprates or nickelates are close to this optimum, medium-type interaction, but palladates are. “Palladium is directly one line below nickel in the periodic table,” Held observes. “The properties are similar, but the electrons there are on average somewhat further away from the atomic nucleus and each other, so the electronic interaction is weaker.”

The researchers found that while some palladates, notably RbSr2PdO3 and A′2PdO2Cl2 (A′=Ba0.5La0.5), are “virtually optimal”, others, such as NdPdO2, are too weakly correlated. “Our theoretical description of superconductivity has reached a new level,” Motoharu Kitatani of the University of Hyogo tells Physics World. “We are positive that our experimental colleagues will now try to synthesize these materials.”

Brain–spine interface enables natural walking after spinal cord injury

To initiate walking, the brain sends commands to neurons located in the lumbosacral spinal cord – the region of the spine that controls leg movement. If an injury interrupts this communication between brain and spinal cord, it can cause permanent paralysis.

Researchers have now developed a brain–spine interface (BSI) that can restore this communication. They demonstrated that the device, described in Nature, could help an individual with paralysis of the arms and legs to stand and walk naturally.

“What we have been able to do is re-establish the communication between the brain and the region of the spinal cord controlling movement, using a digital bridge,” the study’s co-lead author Grégoire Courtine, from Ecole Polytechnique Fédérale de Lausanne (EPFL) in Switzerland, explained in a press briefing. “We captured the thoughts of [the participant] and translated these into stimulation of the spinal cord to induce leg movement.”

The BSI comprises two fully implantable systems that record cortical activity and stimulate the lumbosacral spinal cord in real time. To monitor electrocorticographic (ECoG) signals from the brain, the team used a 64-channel electrode grid embedded in a 50 mm diameter titanium case with the same thickness as the skull.

A processing unit uses ECoG signals recorded from brain regions that control movement to predict the user’s motor intentions, and then converts these intentions into stimulation commands that activate leg muscles. Electrical stimulation is delivered to the targeted region using an implantable pulse generator connected to a 16-electrode paddle lead. The whole system operates wirelessly, allowing the user to move around independently.

“We developed brain–machine interface technology based on unique implantable medical devices, named WIMAGINE, that are able to record the brain activity at the surface of the cortex,” says co-lead author Guillaume Charvet, head of the BCI programme at CEA-Leti’s Clinatec, in France. “We also developed a dedicated algorithm based on artificial intelligence methods able to decode in real time the intention of movement of the patient.”

Clinical trial

To test the BSI, the researchers recruited a 38-year-old male who had an incomplete cervical spinal cord injury from a bike accident 10 years earlier. He had previously participated in the STIMO trial, which involved targeted epidural electrical stimulation of the spinal cord. This enabled him to regain the ability to step with the help of a front-wheel walker. However, after three years of regular training with stimulation only, he had reached a plateau of recovery, motivating him to enrol in this latest study – STIMO-BSI.

Jocelyne Bloch, co-lead author and a functional neurosurgeon at Lausanne University Hospital, surgically implanted two recording devices on the participant’s brain (on regions of the cerebral cortex that respond to the intention to move the left and right lower limbs) and the paddle lead on his lumbar spinal cord.

The researchers first calibrated the BSI to select features of ECoG signals linked to the intention to move, and to configure stimulation programmes that modulate specific groups of lower limb muscles. They then used a multilinear algorithm that linked ECoG signals to the control of stimulation parameters. In just a few minutes, the algorithm calibrated a BSI that enabled the participant to control hip deflection.

BSI training at Lausanne University Hospital

To support walking with crutches, the team selected stimulation programmes that targeted muscles associated with weight acceptance, propulsion and swing functions. After several minutes of training with the BSI, the participant was able to walk naturally and independently. When the BSI was turned off, he instantly lost the ability to take steps; walking resumed as soon as it was turned back on.

The researchers note that after the original STIMO trial, the participant regained basic walking ability during stimulation and partial mobility without stimulation. However, he had difficulty transitioning from standing to walking and stopping, and could only walk over flat surfaces. Using the BSI enabled him to climb up and down a steep ramp with ease, climb stairs, negotiate obstacles and traverse changing terrains, all using the same BSI configuration. The BSI remained reliable and stable for over one year of use, including at home without supervision.

Functional recovery

After completing 40 sessions of neurorehabilitation – walking with BSI, single-joint movements with BSI, balance with BSI and standard physiotherapy – the participant was able to walk with crutches, even when the implant was switched off and exhibited improvements in all conventional clinical assessments.

These improvements without stimulation translated into a meaningful increase in his quality-of-life, such as walking independently around the house, getting in and out of a car, or sharing a beer standing at a bar with friends.

“My wish was to walk again and I believed it was possible. I tried many things before and now I have to learn how to walk naturally again,” the participant, Gert-Jan, reported in the press briefing. “I can walk at least 100 or 200 metres, depending on the day, and I can stand for two or three minutes unsupported.”

When asked to compare the BSI to the spinal-cord stimulation in the STIMO trial, he explained that stimulation alone didn’t feel completely natural. “The stimulation before was controlling me; now I am controlling the stimulation by my thoughts, that’s the big difference,” he said.

Surface plasmon polaritons launched by nano-emitters are imaged in the near field

Light emitters made from 2D and quasi-2D materials are currently of great interest in nano-optoelectronics because their lack of dielectric screening means that their electron–hole pairs (excitons) are incredibly sensitive to their environment. This is advantageous for making devices such as highly responsive photosensors and electrochemical sensors.

When deposited directly onto the surface of a metal in a metal/dielectric substrate, the light emitted by these quasi-2D materials or “nano-emitters” can generate surface plasmon polaritons (SPPs). These are light–matter quasiparticles that exist at a metal/dielectric interface and propagate along it as a wave. An SPP is an electromagnetic wave (polariton) in the dielectric that is coupled to an oscillation of electric charge on the surface of the metal (surface plasmon). As a result, SPPs have properties that are similar to both matter and light.

The electromagnetic field of an SPP is confined to the near field. This means that it exists only at the metal/dielectric interface, with its intensity decaying exponentially with increasing distance into each medium. This results in a large enhancement of the electric field, making SPPs incredibly sensitive to their environment. What is more, near-field light can be manipulated at sub-wavelength length scales.

Until now, SPP/nano-emitter systems have been studied extensively in the optical far field, but the imaging techniques used are diffraction-limited and important sub-wavelength mechanisms cannot be visualized. In a new study described in Nature Communications, researchers in the US have used tip-enhanced nanospectrosopy to study SPPs in nano-emitters in the near field. This allowed the team to visualize spatial and spectral properties of the propagating SPPs. Indeed, their research could lead to exciting new practical plasmonic devices.

Bigger is not always better

In recent years, research into photonic devices and their integration into circuits has been of great interest in industry and academia. This is because compared to purely electronic devices, photonic devices can achieve higher energy efficiencies and faster operating speeds.

However, there are two big challenges that must be overcome before photonics overtakes electronics in mainstream applications. One is that purely photonic devices are difficult to connect together to form larger circuits; and the other is that the size of photonic devices cannot be made smaller than about half the wavelength of the light they process. The latter limits device sizes to about 500 nm, which is much larger than modern transistors.

Both of these problems can be solved by creating devices that operate using SPPs, rather than conventional light. This is because the light-like properties of SPPs allow for extremely fast device operation, whereas the matter-like properties of SPPs allow for easier integration into circuits and operation below the diffraction limit.

However, in order to design practical nano-electronics, a better understanding of the sub-wavelength behaviour of SPPs is needed. Now, Kiyoung Jo, a PhD student at the University of Pennsylvania, and colleagues have studied SPPs using tip-enhanced nanospectroscopy. This technique couples a far-field spectrometer with an atomic force microscope (AFM).

SPP standing wave

The gold-coated AFM tip scatters light in the near-field, which allows the SPPs to be spatially and spectrally imaged using the spectrometer. The sample was fabricated by spin-coating a solution of quasi-2D nanoplatelets (nanometre-scale flakes of the light emitter CdSe/CdxZn1-xS) onto an gold substrate and then depositing an aluminium oxide dielectric on top using atomic layer deposition.

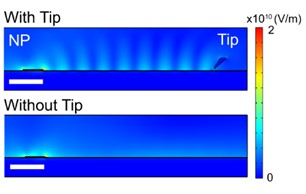
The nanoplatelets were excited using a laser and their subsequent light emission launched SPPs that propagated along the gold/aluminium oxide interface. The researchers observed that the SPPs could propagate up to hundreds of microns and could also be reflected by the gold tip back along their original path. In case of reflections, the incident and reflected SPPs interfered with one another, forming a standing wave between the tip and the nanoplatelet (see figure: “Quasiparticle reflections”). Experimentally, these were observed as parabolic-shaped fringes.

As the distance between the tip and the nanoplatelet was increased, the researchers found that the electric-field intensity varied periodically. This confirmed the presence of a standing wave and demonstrated how the nanoplatelet and tip act as a kind of cavity. Computer simulations showed, however, that, although both tip and nanoplatelet are required to observe fringes, the electromagnetic field generated by the SPPs is present with only one, confirming that both are able to launch SPPs.

The researchers also investigated the effect of the sample properties on the SPP emission. For example, they found that fringes only occurred when the nanoplatelets were “edge-up” (perpendicular to the plane of the substrate), and the excitation laser was polarized such that its magnetic field was perpendicular to the plane of incidence (TM polarization). As a result the polarization of the excitation laser can be used as a “switch” to easily turn the SPPs on and off, which is an important feature for opto-electronic devices. The team also found that the shape of the fringes could be used to determine the dipole orientation of the nano-emitter, with the parabolic shape suggesting a slight incline (circular fringes would indicate an angle of exactly 90° to the plane of the substrate).

Thickness also played an important role in the properties of the SPPs, with thicker nanoplatelets yielding stronger electric fields, and thicker dielectrics resulting in longer SPP propagation distances. Studies using different dielectric materials (titanium dioxide; and monolayer tungsten diselenide) indicated that, due to increased electric-field confinement, a larger dielectric permittivity also resulted in longer propagation distances. This is important to know, as the propagation distance directly correlates to energy transfer by the SPPs. Jo summarizes that “We find, visualize and characterize the sub-wavelength-scale energy flow via SPPs in the vicinity of individual nanoscale emitters.”

The team has shown that tip-enhanced nanospectroscopy is a powerful tool for the study of the near-field in SPP systems, allowing various properties, such as dipole orientation and implications of sample design, to be determined. “The ability to image and examine sub-wavelength photonic phenomena in excitonic semiconductors makes [near-field scanning optical microscopy] a valuable tool for fundamental studies as well as semiconductor characterization,” says Deep Jariwala, who is corresponding author on the paper describing the work. Such an enhanced understanding of SPP systems will be invaluable in the development of practical nano-optoelectronic devices.

Silicon photomultipliers: gearing up for applications in gamma-ray astronomy

Hamamatsu Photonics, a Japanese optoelectronics manufacturer that operates across diverse industrial, scientific and medical markets, is evaluating cutting-edge opportunities in high-energy physics for its silicon photomultiplier (SiPM) technology portfolio. Near term, that means the focus is on emerging applications in astroparticle physics and gamma-ray astronomy, while further down the line there’s the promise of at-scale SiPM deployment within particle accelerator facilities like CERN, KEK and Fermilab to probe new physics beyond the Standard Model.

What of the basics? The SiPM – also known as a Multi-Pixel Photon Counter (MPPC) – is a solid-state photomultiplier comprised of a high-density matrix of avalanche photodiodes operating in Geiger mode (such that a single electron–hole pair generated by absorption of a photon can trigger a strong “avalanche” effect). In this way, the technology provides the basis of an optical sensing platform that’s ideally suited to single-photon counting and other ultralow-light applications at wavelengths ranging from the vacuum-ultraviolet through the visible to the near-infrared.

Hamamatsu, for its part, currently supplies commercial SiPM solutions into a range of established and emerging applications spanning academic research (e.g. quantum computing and quantum communication experiments); nuclear medicine (e.g. positron emission tomography); hygiene monitoring in food production facilities; as well as light detection and ranging (LiDAR) systems for autonomous vehicles. Other customers include instrumentation OEMs specializing in areas such as fluorescence microscopy and scanning laser ophthalmoscopy. Taken together, what underpins these diverse use-cases is the SiPM’s unique specification sheet, combining high photon detection efficiency (PDE) with ruggedness, resistance to excess light and immunity to magnetic fields.

Gamma-ray insights

Evidently, those same characteristics are well-matched to the technical requirements of the next generation of detectors for astroparticle physics (the study of elementary particles of cosmic origin and their relation to astrophysics and cosmology). A case in point is the Cherenkov Telescope Array (CTA) Observatory, an ambitious international research initiative that’s in the process of building the world’s largest and most sensitive high-energy gamma-ray observatory, comprising 64 telescopes of different sizes to cover a broad gamma-ray energy range (from 20 GeV to 300 TeV). The telescopes will populate two arrays – one site located in the Canary Islands, Spain; the other in Chile – to cover both the northern and southern hemispheres.

Mauro Bombonati

By way of context, when gamma rays reach the Earth’s atmosphere, they interact with its outer layers to produce cascades of subatomic particles known as “air showers” or “particle showers.” These ultrahigh-energy particles can travel faster than light in the air, creating a blue flash of Cherenkov light (like the sonic boom created by an aircraft exceeding the speed of sound).

While spread over a large area (typically 250 m in diameter), the Cherenkov light lasts for only a few nanoseconds – just long enough to be tracked by the mirrors of the CTA’s telescopes and detected by the high-speed cameras positioned at their foci. As such, the CTA will ultimately enable astronomers to investigate the parent gamma rays and their cosmic origins.

“In terms of ongoing product development and innovation, we are interested in how the SiPM platform can be used for atmospheric detection of Cherenkov light,” explains Mauro Bombonati, senior sales engineer at Hamamatsu Photonics’ Italian division in Milan. “We see the CTA initiative as an ideal proving ground for advanced SiPM detectors and, by extension, a stepping-stone for future deployment of SiPM technology in large-scale accelerator facilities – for example, to support neutrino experiments and the search for dark matter.”

Blue-sky collaboration

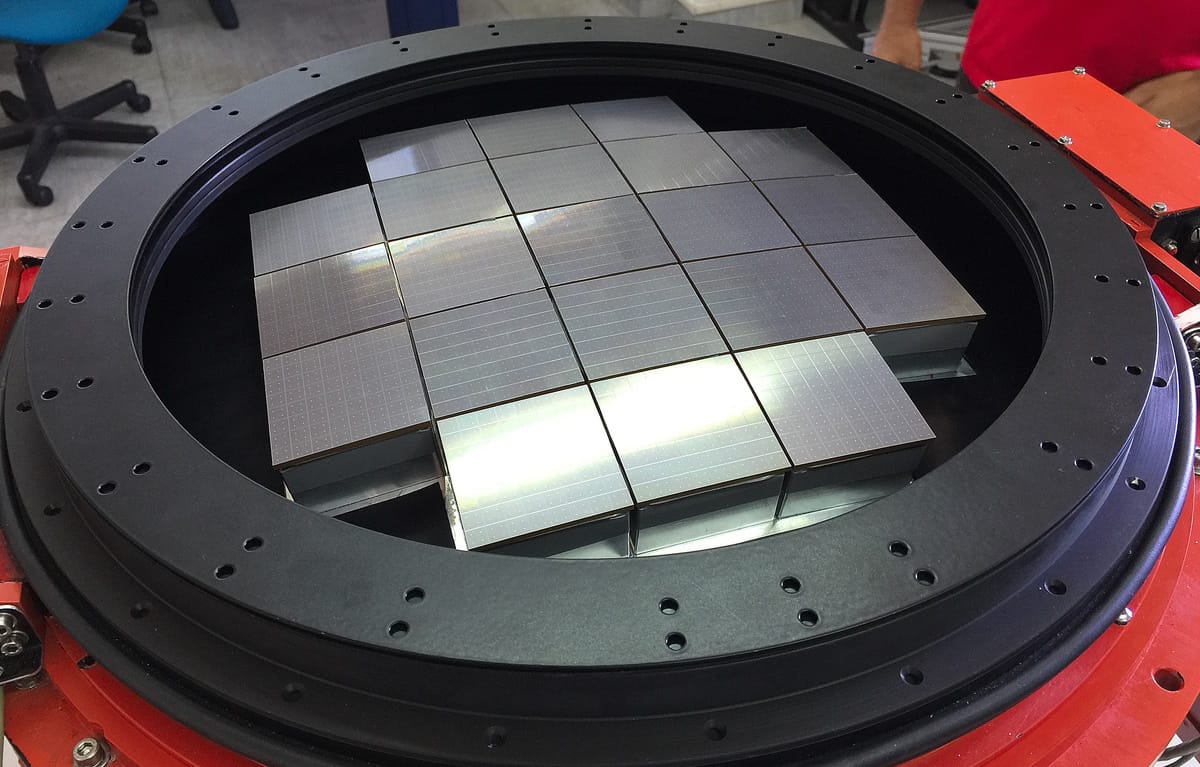
With this in mind, Hamamatsu’s R&D team has collaborated closely with the Italian National Institute of Astrophysics (INAF) in the context of the ASTRI project, an international consortium that’s in the process of building nine dual-mirror telescopes (4 m in diameter) for atmospheric Cherenkov astronomy. As a preferred technology partner, Hamamatsu handled the design, development and optimization of ad hoc SiPM modules used to populate the compact Cherenkov cameras of the ASTRI telescopes. The resulting ASTRI mini-array is currently being installed at the Teide Observatory (Tenerife, Canary Islands) and represents a “pathfinder” for the CTA’s sub-array of 37 small-scale telescopes (SSTs) that will be installed at Paranal (Chile).

Upon completion, the CTA will further comprise 23 medium-sized telescopes (MSTs) – each at 12 m diameter and distributed over both array sites – as well as four large-sized telescopes (LSTs) at 23 m diameter. Operationally, the LST and MST camera systems will exploit photomultiplier tubes; the SST cameras, in contrast, will use SiPMs to convert Cherenkov light into electrical data for high-speed readout and analysis.

It’s also worth noting that INAF, along with other CTA project teams, is pursuing variations on the SST theme, with slight modifications to the geometry and design of the SST telescopes to realize an optimum approach versus CTA technical requirements. Within Hamamatsu, too, the device-level R&D effort is ongoing – specifically improving SiPM PDE in the near-UV (200–400 nm), where Cherenkov light intensity is optimum.

the focal plane of an ASTRI telescope with SiPM detector array

“We’re improving the wafer fabrication process to reduce the number of lattice defects in the photoelectric conversion layer,” notes Bombonati. The goal is increased carrier lifetime and greater numbers of carriers reaching the avalanche layer. “To date,” he adds, “Hamamatsu engineers have demonstrated a 16% enhancement in the detector sensitivity at 350 nm.”

Another focus of Hamamatsu’s R&D involves pile-up suppression in SiPM detectors – i.e. to make the rising edge of the signal waveform sharper by adjusting the quenching resistor and reducing terminal capacitance. In this way, a lower trigger threshold can be used to separate Cherenkov “events” from noise, such that lower-energy events can be observed as standard.

Equally significant is the exploitation of through-silicon-via (TSV) technology, which is essentially a vertical electrical connection that passes completely through a silicon wafer to maximize the active area for photon detection while simultaneously minimizing dead space (thereby enhancing PDE while also lowering crosstalk between SiPM pixels).

Competitive intelligence

Strategically, Hamamatsu maintains a watching brief on the wider landscape in high-energy physics to ensure a customer-driven frame of reference for its in-house innovation programme. A case in point is the company’s “observer status” within CERN’s European Committee for Future Accelerators (ECFA), an initiative that underpins community-wide development of long-term R&D roadmaps for accelerator and detector technologies.

“Engagement with the ECFA helps us to prioritize emerging technology trends and user requirements for SiPM in astroparticle physics and accelerator-based science,” concludes Bombonati. “At the same time, developing SiPM solutions for frontier research in high-energy physics also yields paybacks elsewhere – not least in terms of enhanced capability and competitive differentiation for our more established industrial applications.”

Cannabis breath-test research goes up in smoke

Roadside breath tests are a staple of policing. Whenever officers suspect drivers of being drunk, they ask them to blow into a tube. This tube leads to a handheld device popularly known as a Breathalyzer that analyses the breath sample and outputs an estimate of the driver’s blood-alcohol level. Though not infallible, Breathalyzers are quick and accurate enough to help get drunks off the road before they harm themselves and others.

But what if the driver hasn’t been drinking? What if, instead, they’ve been smoking some fine, fine weed?

Like alcohol, cannabis is legal in many jurisdictions. Like alcohol, it can render users unfit to drive for several hours, long after their last dance with Mary Jane is but a hazy, munchie-filled memory. So, is there a Breathalyzer for cannabis?

The answer, so far, is no – but not for lack of trying. The latest effort comes from researchers at the US National Institute of Standards and Technology (NIST) and the University of Colorado at Boulder. Led by Tara Lovestead and Kavita M Jeerage of NIST’s applied chemical and materials division, the team set out to measure the amount of tetrahydrocannabinolic acid (THC, the active ingredient in cannabis) in users’ breath, and to monitor how it changes over time.

Barriers to a cannabis breath test

Such studies are challenging for three reasons. One is that, unlike alcohol, relatively little THC shows up directly in a user’s breath. Instead, a cannabis Breathalyzer – let’s call it a Reefalyzer – would have to detect tiny amounts of THC in particles that form within the lungs and are then exhaled.

A further challenge is that THC can persist in the bodies of habitual users for weeks after any high has worn off. This means that a yes/no answer isn’t good enough: a practical Reefalyzer would have to distinguish between intoxicating and non-intoxicating levels of THC.

Finally, although Colorado is one of several US states to allow marijuana use for recreational as well as medical purposes, the drug remains illegal at a federal level. As a result, the federally-employed NIST researchers could not handle the drug they were trying to study.

A “federally compliant mobile laboratory”

In a paper published in the Journal of Breath Research, Lovestead and colleagues outline the ingenious way they overcame one of these challenges. To collect breath samples from cannabis users in a controlled way, the team developed a “federally compliant mobile laboratory” that met users at their place of residence. There, the researchers collected breath and blood samples before and after users returned to their homes to smoke high-THC cannabis from a local dispensary. Finally, the researchers used laboratory instruments to measure the amount of THC in the users’ breath.

So far, so good. From a Reefalyzer perspective, though, the results were disappointing. “We expected to see higher THC concentrations in the breath samples collected an hour after people used,” Lovestead told the NIST press office. In fact, the researchers found that pre-use and post-use THC levels spanned a similar range. “In many cases, we would not have been able to tell whether the person smoked within the last hour based on the concentration of THC in their breath,” she concluded.

The team identified a few possible avenues for future experiments. One possibility would be to measure the flow rate of breath samples, to help identify outliers and investigate whether flow plays a role in aerosol capture. Another would be to perform tests on THC-spiked aerosols generated in a laboratory, rather than relying solely on human subjects.

The bottom line, though, is that the researchers say their results “do not support the idea that detecting THC in breath as a single measurement could reliably indicate recent cannabis use”. So if you’re waiting for Reefalyzers to appear alongside Breathalyzers in your favourite TV cop show – well, don’t hold your breath.

Award winning studies focus on reducing radiotherapy risks

ESTRO 2023, the annual congress of the European Society for Radiotherapy and Oncology, featured an extensive scientific programme spanning six key themes: physics, brachytherapy, clinical, interdisciplinary, radiobiology and RTT (radiation therapists). For each of these tracks, one submitted abstract was chosen as the “Best Paper” in its class, with the winners presenting their research in a dedicated “Highlights of Proffered Papers” plenary session.

Toxicity modelling

In the physics track, the Best Paper Award went to Tiziana Rancati from the National Cancer Institute of Milan, for a study examining models of late toxicity after prostate cancer radiotherapy. In particular, Rancati introduced a model for normal tissue complication probability (NTCP) based on Cox regression (a method for predicting the time to an event using several variables): the Cox-NTCP model.

“The specific purpose of this analysis was to propose a Cox-NTCP model for late toxicity after prostate cancer radiotherapy, including genetic information from a polygenic risk score incorporating SNP–SNP interactions,” Rancati explained. To develop their model, Rancati and colleagues worked within the REQUITE and RADPrecise projects, multi-centre studies of cancer patients that aimed to validate predictive models and biomarkers to reduce radiotherapy side effects.

Their analysis considered four late-toxicity endpoints: grade 1+ and 2+ rectal bleeding; grade 2+ late urinary frequency; and grade 1+ late haematuria (blood in the urine). For dosimetry, they investigated equivalent uniform dose (EUD) values calculated from dose–volume histograms (DVHs) and dose–surface histograms (DSHs).

Using the two-year REQUITE follow-up data, Rancati and colleagues developed an interaction-aware polygenic risk score. They started with 43 SNPs (single nucleotide polymorphisms, the most common type of genetic variation among people) known to be associated with late toxicity, validated 13 that worked within REQUITE, and used data mining to find SNP–SNP combinations associated with either increased or decreased risk of toxicity. They then weighted the risk score and protective risk score to create a polygenic risk score with interactions (PRSi).

The analysis included 1482 patients, the majority of whom received volumetric modulated arc therapy (VMAT) with conventional fractionation. Patient follow-up occurred at between one and eight years, with a median follow-up of two years. “With such heterogeneity in follow-up, we shifted from static NTCP models to actuarial NTCP models based on Cox regression,” Rancati explained. “This takes into account the maximum follow-up time of each patient and the time of any toxicity.”

Rancati shared some results from the study. For grade 2+ urinary frequency, for example, the EUD to the whole bladder (calculated from the DSH) was the best dosimetric predictor of long-term toxicity. Cox-NTCP curves of toxicity versus bladder-surface EUD showed that toxicity was most likely for radiosensitive patients with PRSi scores of 1, and lowest for those with scores of -1, as seen in radioresistant patients. She noted that the curves were different for three- and five-year follow-up, emphasizing the importance of including time into NTCP models, while the PRSi scores show the importance of the genetic risk factors.

Results for haematuria were similar, but with EUD to the bladder neck appearing more important than dose to the whole bladder. For rectal bleeding, the best dosimetric descriptor was rectal EUD calculated from the DVH. Rancati noted that in this case, the PRSi score was still associated but less discriminative than seen with other toxicities, with a shallower dose–response curve.

“We showed the benefit of adding a polygenic risk score with interactions to Cox-NTCP prediction models,” Rancati concluded. “These models allow both patient-specific tailoring of the prediction and accounting for the follow-up time. Dose to organs- or sub-organs-at-risk modulates the risk of toxicity.”

Improving quality-of-life

The Best Paper Award in the brachytherapy track went to Vivek Anand from the Hinduja Hospital and Medical Research Centre in Mumbai, India. Anand presented a study comparing quality-of-life for patients with tongue cancer after treatment with external-beam radiotherapy (EBRT), or EBRT plus high-dose rate (HDR) brachytherapy.

Anand explained that adjuvant radiotherapy for treatment of tongue cancers is known to reduce the patient’s quality-of-life. HDR brachytherapy, however, can deliver a high dose of radiation to the tumour while sparing adjacent normal tissues. “This modality reduces morbidity without compromising on outcomes,” he said.

The study included 63 oral tongue cancer patients who had undergone surgery followed by adjuvant radiotherapy, using either using EBRT or EBRT plus brachytherapy. EBRT was delivered to the neck nodes and whole tongue, with a higher dose boost delivered to the tumour bed and positive nodes. In the second group, patients received EBRT to the neck nodes, with a higher dose to positive nodes, plus six days of HDR brachytherapy to the primary tumour bed. Patients with cancerous nodes also had weekly concurrent chemotherapy.

To compare functional outcomes in the two groups, the researchers used a questionnaire – the EORTC Quality of Life Head and Neck Module – which asks patients to rate dozens of factors including, for example, pain in the mouth and jaw, problems swallowing, loose teeth, speech problems, dry mouth, skin problems, and weight loss or gain. They also examined overall survival in both groups.

The researchers found that the overall treatment time was slightly increased in the EBRT plus brachytherapy group, from 43.6 to 51.1 days. However, there was no difference in overall survival between the two groups.

Of the 63 patients, 24 in EBRT group and 18 in the EBRT plus brachytherapy group completed the questionnaire, at median follow-ups of 37 and 35 months, respectively. “All symptom scales showed that brachytherapy was better,” said Anand. “Clinically and symptomatically, they were worse in the EBRT group. The only statistically significant parameter was weight loss, which proves that brachytherapy had little problems when used for the oral cavity.”

Anand concluded that delivering radiation dose by brachytherapy to the oral tongue improves the patient’s quality-of-life, noting that the increased treatment time in the EBRT plus brachytherapy group did not result in decreased outcomes. “Larger numbers of patients and longer follow-up are warranted to study if we can make this one of the standard-of-care treatments,” he said.

Screening for lung disease

Andrew Hope from Princess Margaret Cancer Centre and the University of Toronto was the winner of the Best Paper Award in the interdisciplinary track, for his study on AI-based screening for interstitial lung disease (ILD). ILD poses a big challenge for oncology, Hope explained. It predisposes patients to lung cancer, but also increases the risks of cancer treatment. For radiotherapy, ILD increases the risk of radiation pneumonitis and even death.

Andrew Hope

ILD is traditionally diagnosed before radiation treatment using the patient’s diagnostic imaging scans or by noting clinical symptoms such as shortness of breath. But in some cases, patients may progress onto radiotherapy with undetected ILD, increasing the risk of radiation-related complications.

“However, there is an additional image that is available – the treatment planning image,” said Hope. “Routinely, this is not diagnostically reviewed or assessed. So we thought that there might be an opportunity to explore this image in a more diagnostic fashion.”

To automatically identify patients with ILD during radiotherapy planning, Hope and colleagues developed a machine learning pipeline called the MIRA clinical learning environment (MIRACLE). The MIRACLE-ILD system uses convolutional neural networks (CNNs) to identify ILD from a planning image, including a 2D U-net to perform the lung contouring and a 3D CNN for classification.

Following initial training of the MIRACLE-ILD on diagnostic CTs (which did not work well due to differences between diagnostic and planning scans), the researchers retrained the model using transfer learning with a radiotherapy-specific data set. They chose to threshold the model to provide 65–75% sensitivity to ILD at the cost of a 15–20% false positive rate.

To verify the clinical performance of MIRACLE-ILD, the team first deployed the model in “silent mode”, with no notifications sent to treating physicians. This study included 180 patients, nine of whom had ILD. MIRACLE-ILD correctly identified six of these cases, with a reasonable accuracy (86%), sensitivity (67%) and specificity (87%). “MIRACLE would have detected two of the four patients that were unknown to have ILD by the treating team at the time,” Hope noted.

In May 2022, the team moved on to the live phase, in which any positive cases were flagged to the physicians. This study included 254 patients, 13 of whom had ILD, and used the same model and threshold as before. MIRACLE-ILD flagged 42 patients as ILD-positive, with good accuracy (84%) and specificity (85%), but slightly lower sensitivity (54%) than previously. Here, there were seven unknown ILD cases and the system found three of them prior to treatment.

“In total, we had 434 patients of which 22 had ILD. The overall performance of the model was quite reasonable, with an accuracy of 85% and a specificity of 86%. We detected five of 11 unknown ILD cases in this cohort,” said Hope. “We feel this represents a validated prospective way to screen radiotherapy plans for the possibility of a patient having ILD.”

He pointed out that the system remains live at the Princess Margaret Cancer Centre and is used to screen every patient who receives thoracic radiotherapy.

The rest of the best

Clinical Best Paper: Molecular classification of endometrial cancer is predictive of response to adjuvant radiotherapyNanda Horeweg, Leiden University Medical Center

Radiobiology Best Paper: Hypoxic tumour cells drive tumour relapse after radiotherapy as revealed by a novel tracing toolApostolos Menegakis, Netherlands Cancer Institute

RTT Best Paper: Randomized trial of person-centered versus standard RTT care for breast cancer patients NCT04507568Michael Velec, Princess Margaret Cancer Centre

Copyright © 2026 by IOP Publishing Ltd and individual contributors