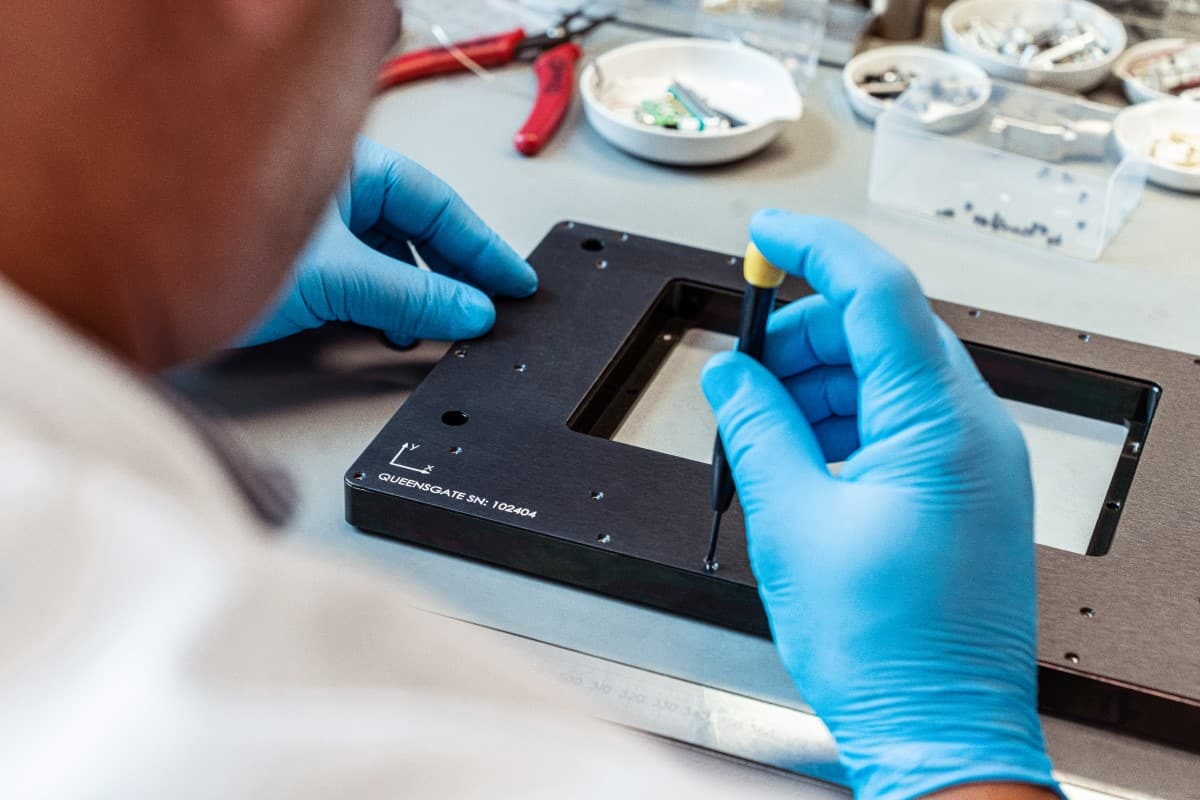
Industrial metrology: an ongoing R&D collaboration with NPL scientists is helping UK nanopositioning specialist Queensgate to enhance end-to-end QA across product design, development and manufacturing. (Courtesy: Queensgate)
Enhanced spatial correction in multi-axis nanopositioning stages provided the original motivation – and, ultimately, the successful production outcome – for the latest project in the long-running R&D collaboration between Queensgate, a UK manufacturer of high-precision nanopositioning products, and scientists at the National Physical Laboratory (NPL), the UK’s National Metrology Institute.
With funding from Analysis for Innovators (A4I) – a programme run by Innovate UK, the UK’s innovation agency – the two partners undertook a “deep dive” into the nature and extent of parasitic (off-axis) motion errors in Queensgate’s multi-axis nanopositioning stages. Their granular investigation has yielded a practical correction and calibration methodology that will reinforce Queensgate’s end-to-end quality assurance (QA) across product design, development and manufacturing for its portfolio of piezo-driven nanopositioning stages (as well as enabling technologies such as piezo actuators, capacitive sensors, control electronics and software).
“Our collaboration with Queensgate has yielded reciprocal benefits over a wide range of joint R&D projects for the past decade or so,” explains Andrew Yacoot, principal scientist who leads NPL’s dimensional nanometrology programme and chairs the Working Group for Dimensional Nanometrology of the Consultative Committee for Length (one of ten Consultative Committees that oversee the SI units, the international standards of measurement). That win-win sees NPL address one of its broader missions: helping specialist technology companies to solve thorny industrial problems and, by extension, delivering transferable innovation, continuous product improvement and long-term commercial impacts. “At the same time,” adds Yacoot, “we get a direct line into Queensgate’s product development team to inform them of our unique, often non-standard, nanopositioning requirements for nanoscale science and metrology.”
Andrew Yacoot: “Our collaboration with Queensgate has yielded reciprocal benefits.” (Courtesy: NPL)
If that’s the back-story, what of the project detail? For starters, spatial-error correction in nanopositioning stages represents a non-trivial exercise in applied measurement – owing, in large part, to the difficulty of capturing and analysing sufficient data points, also the complexities associated with coding the necessary error-correction algorithms. All of which provides the context for Queensgate’s latest tie-up with NPL, where Yacoot and colleagues exploit multi-axis interferometric instrumentation to support the laboratory’s ongoing R&D efforts in high-accuracy nanopositioning.
To this end, a dedicated NPL stage rig uses three orthogonally mounted, plane-mirror differential interferometers (designed by NPL) to measure the relative displacement between a mirror cube (mounted on a stage) and a set of reference mirrors. The interferometers are illuminated using light from stabilized helium-neon lasers that have been calibrated against NPL’s primary metre-realization laser to give traceable position measurement. To reduce thermal and acoustic effects, the entire set-up is also enclosed and mounted on a vibration isolation platform.
Made to measure
Using this experimental rig to characterize spatial errors (and inform the subsequent calibration process), the NPL project team put two Queensgate stages through their paces: the QGSP-XY-600-Z-600 (which has a 600 μm range along the x, y and z axes) and the QGNPS-XY-100D (which moves 100 μm in the x and y axes only). The latter is a high-performance stage that has been well characterized as part of a previous Queensgate/NPL collaboration on high-speed atomic force microscopy (AFM). Using a “known good” stage also allows the calibration methodology to be assessed in situations where the errors are smaller and thereby demonstrate the transferability of the error-correction techniques.
Zoom in and NPL’s measurement methodology is simple enough – albeit necessarily exhaustive. For each point in the stage’s volume of motion, the stage was commanded to move to a position and then allowed to settle for a specified time. “Closed-loop control ensures this position reflects the displacement reported by the stage’s capacitive sensors,” explains Yacoot. “The actual displacement is then collected from the NPL interferometers, in order to determine the spatial positioning error.”
Experimental insights
Operationally, the software for control of the stage rig and data collection was written by Edward Heaps, a member of Yacoot’s nanometrology team. His work was informed by previous studies showing that a scan of 11 points along each axis gives sufficient data for mapping spatial positioning errors (and, crucially, without an excessive timeframe for data acquisition).
For the 3D stage, Heaps captured a total of 1331 (11×11×11) data points at 40 μm (commanded) intervals, while for the 2D stage a total of 121 (11×11) points were captured at 10 μm (commanded) intervals. Furthermore, it was necessary to capture actual spatial positions for the commanded points for all axes moving in both directions – to assess repeatable errors caused by unavoidable hysteretic processes within the stage – while repeating the entire measurement cycle six times to quantify stochastic errors.
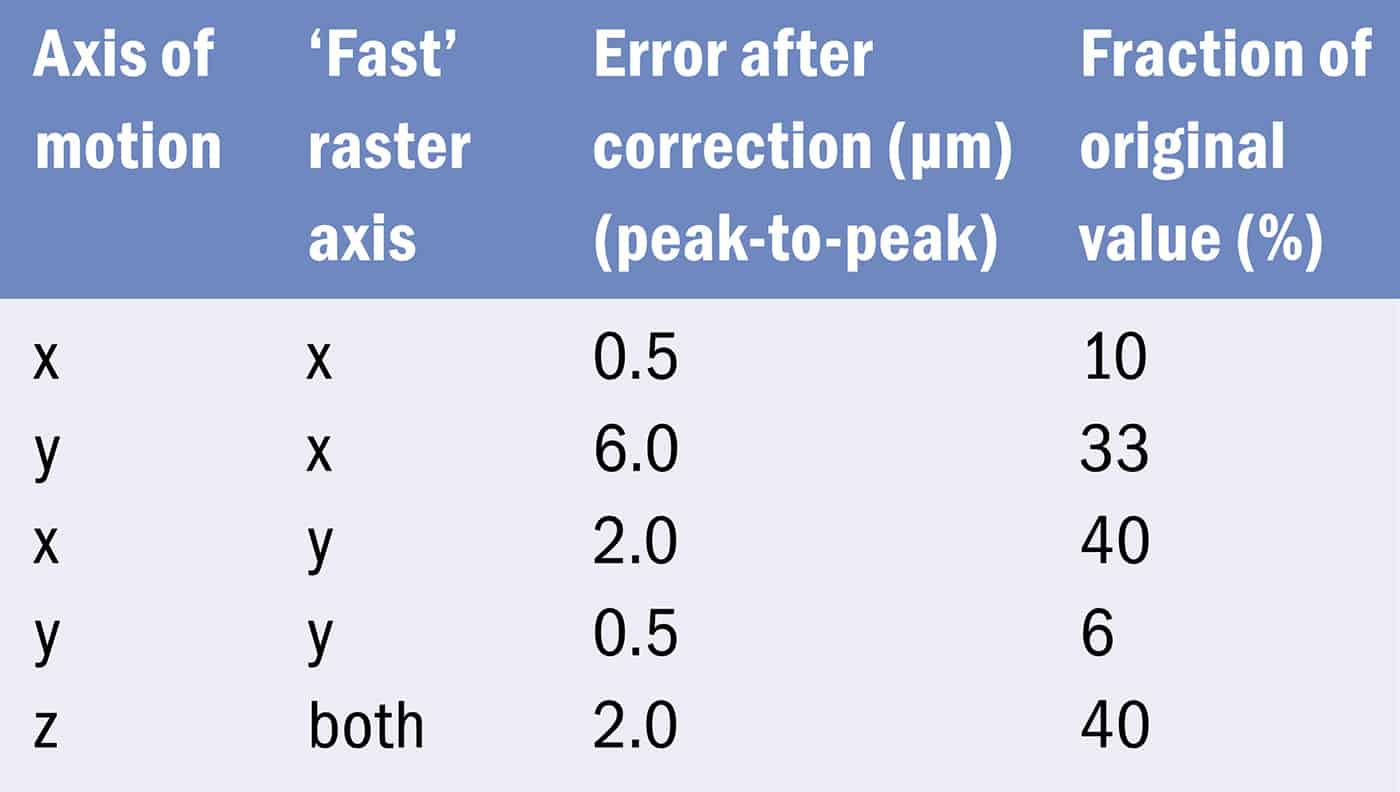
The resulting data set underpins a dedicated error-correction algorithm devised and optimized by Yacoot’s colleague Alistair Forbes, a mathematician and NPL Fellow. Following implementation of the algorithm within prototype stage firmware, the algorithm provides the basis for a robust calibration procedure that – evidenced by a repeat set of experimental measurements on the spatially corrected stages – yields a significant tightening of the positioning errors in the devices under study (see tables 1 and 2). Equally, the large multi-axis stage achieved performance improvements in line with the uncompensated shorter-range xy stage – opening up opportunities to deploy stages with longer travel ranges (600 µm x 600 μm) in high-precision applications like AFM, nanolithography and 3D nanoprinting.
“Right now, we are implementing the correction algorithm into full production-quality firmware while rolling out the calibration process within our assembly operations,” explains Sam Frost, production manager and site lead at Queensgate’s manufacturing facility in Paignton, UK. “There’s more work needed to standardize the new-look workflows, but we’ll be shipping the first commercial stages to benefit from NPL’s enhanced measurement and calibration methodology later on in the spring.”
Meanwhile, Queensgate’s product manager, Craig Goodman, is already laying the ground for the next joint project with NPL’s nanometrology team. With follow-on funding secured in the latest A4I round earlier this year, the partners will seek to build on the error-correction advances in linear nanopositioning stages, tailoring the multi-axis correction algorithm for application in Queensgate’s tip-tilt stages (which combine linear and angular motion along the x, y and z axes). “Tip-tilt stages are used in advanced silicon wafer processing and, owing to their construction, exhibit large cross-coupling errors between the two rotational axes,” explains Goodman. “It’s a complex proposition to quantify cross-talk between all the different actuators and sensors in a tip-tilt platform, let alone translate those insights into an optimized correction and calibration scheme.”
Table 1: Spatial positioning errors for the QGSP-XY-600-Z-600 stage on each axis after correction
Table 2: Spatial positioning errors for the QGNPS-XY-100D stage on each axis after correction
Powerful probe A brain scan using an experimental technique known as “dissolution dynamic nuclear polarization” (d-DNP). This process can greatly improve the images produced using magnetic-resonance imaging (MRI). (Courtesy: James Grist et al 10.1016/j.neuroimage.2019.01.027 )
Life, for physicists, is an odd thing, seeming to create order in a universe that mostly tends towards disorder. At a biochemical level, life is even stranger – controlled and thermodynamically powered by a myriad of different molecules that most of us have probably never heard of. In fact, there’s one molecule – pyruvic acid – that’s crucial in keeping us alive.
When burned, pyruvic acid releases carbon dioxide and water. If you’re exercising hard and your muscles are running low on oxygen, it’s converted anaerobically into lactic acid, which can give you a painful stitch. Later, your liver recycles the lactic acid back into sugars and the process starts anew.
Magical molecule Pyruvic acid is central to the technique of dissolution dynamic nuclear polarization (d-DNP).
But pyruvic acid – known chemically as 2-oxypropanoic acid (CH3CO-COOH) – is also a marker for what’s going on inside your body. Run up a flight of stairs, skip a meal or get anaesthetised, and the rate at which pyruvic acid is metabolized (and what it’s converted into) will change. The speed with which it’s made or consumed will also vary enormously if you’re unfortunate enough to have a heart attack or develop cancer.
As it turns out, we can track this molecule by exploiting the intrinsic angular momentum, or “spin”, of the nuclei in pyruvic acid. Spin is a fundamental physical property that comes in either integer or (in the case of protons and carbon-13 nuclei for example) half-integer multiples of ħ (Planck’s constant divided by 2π). Using an experimental technique known as “dissolution dynamic nuclear polarization” (d-DNP), it’s possible to create a version of the acid where many more of its carbon-13 nuclei exist in one spin state than another.
In the video below, specially recorded for Physics World, Jack Miller explains the fundamental spin physics behind dissolution dynamic nuclear polarization. The technique allows the polarization from a stable chemical source of unpaired electrons, such as a carbonyl radical, to be transferred to the nuclei in pyruvic acid, which can be used to boost the quality of MRI images.
By injecting this “hyperpolarized” pyruvic acid into a biological system, we can improve the notoriously poor signal-to-noise ratio of magnetic-resonance imaging (MRI) by a staggering five orders of magnitude. MRI, which has been of huge benefit in medicine, uses a mix of strong magnetic fields and radio waves to yield detailed images of human anatomy and physiological process inside the body. Its downside is, though, that patients often have sit for over an hour in an MRI machine for clinicians to get images that have a good enough resolution for their needs.
With d-DNP, however, we can gain spectacular MRI images that reveal in detail what happens to pyruvic acid in biological systems. Over the last 20 years, the technique has been used to image bacteria, yeast and mammalian cells. It has looked at animals such as rats, mice, snakes, pigs, axolotls – and even dogs being treated for cancer. Most importantly, about 1000 people at 20 or so research labs around the world have been imaged using d-DNP with almost 50 clinical trials under way.
So how does this technique work and what can it reveal to us about the human body?
Ups and downs of magnetic resonance
Giving clinicians valuable images of the location of water and fat in the body, the beauty of MRI is that it’s non-invasive and won’t harm a patient – even if sitting inside the bore of a magnet is not particularly pleasant. But magnetic resonance can yield far more than just pretty pictures because the behaviour of a nucleus in an applied magnetic field depends on where the nucleus is in a molecule and its precise location in the human body. In fact, we can use radio waves to measure the quantity and location of those nuclei in biological systems, turning MRI into a spectroscopic technique.
MRI spectroscopy is able to reveal the precise distribution of molecules, such as lactic acid and adenosine triphosphate (ATP – the source of energy for use and storage at the cellular level) in almost any biological tissue. Unfortunately, these molecules are usually present at such low concentration that MRI images of them have a much lower resolution that equivalent images of water or fat. Worse, most MRI spectroscopy experiments require a patient to sit still for hours to get enough decent data, which is difficult especially if they’ve got an itchy nose or need the toilet.
In the late 1990s, however, Jan Henrik Ardenkjær-Larsen – a physicist at the Technical University of Denmark (TUD) in Copenhagen – realized that d-DNP could make MRI spectroscopy much more sensitive. Developed with his TUD colleague Klaes Golman and others, the technique of d-DNP involves some beautiful basic physics that emerged from nuclear and particle labs back in the 1950s (see box at the end of this article, “Stealing polarization from electrons”). At the heart of d-DNP is the concept of “nuclear polarization”, which comes from the energy levels of a nucleus with spin being split into two (or more) components when exposed to a magnetic field. The difference in energy, which is proportional to the strength of the field, provides useful information about the location of the nucleus.
To get an easily measurable signal, however, you need far more nuclei in the higher-energy state (n↑) than in the lower-energy state (n↓). The key figure of merit is the “absolute nuclear polarization”, P, which is the difference between the number of nuclei in the two states divided by their total number i.e. (n↑ – n↓) / (n↑ + n↓). For protons or carbon-13 nuclei, which have a half-integer spin, P depends only on temperature, magnetic field and their “gyromagnetic ratio” (magnetic moment divided by angular momentum).
1 In search of improved polarization
Magnetic resonance imaging (MRI) relies on there being many more nuclei with one kind of spin than another because the resulting polarization (P) creates a large and measurable magnetization. Unfortunately, MRI is very insensitive because the value of P for carbon nuclei (blue), protons (green) and electrons (orange) is tiny at room temperature – only reaching its maximum value of 1 at very low temperatures and very strong fields (the data here are for a 3.35 T superconducting magnet). While it is hard to reach a value of 1 for nuclei, it is easy to get there for electrons using liquid helium at 1.4 K. Trouble is, most materials don’t contain unpaired electrons. That’s where dissolution dynamic nuclear polarization (d-DNP) comes to the rescue (see main text).
The value of P can range from a minimum of 0 to a maximum of 1 at absolute zero. At room temperature and in magnetic fields that we can reasonably achieve in the lab, P is annoyingly small – typically 10–6 or less. In other words, if there are exactly a million spins in the lower state, there are only a million and one in the upper state. However, in a macroscopic biological material there will be enough spin-half nuclei for it to become magnetized – albeit still relatively weakly – when placed in a magnetic field.
Precessing around the applied field several million times per second, this weak magnetization can be measured by applying a pulse of radio waves. They generate a time-varying magnetic field, which induces a voltage in a nearby electrical circuit. To obtain an MRI image, all you need to do is vary the applied magnetic field across a sample and bathe it in radio waves. The result of such experiments is a map of the frequency and phase of the magnetic-resonance signal.
But because P is so small, the magnetization is frustratingly weak, the recorded voltages are small, and the image resolution is poor. Patients requiring, say, a high-resolution brain scan often have sit for over an hour in an MRI machine for clinicians to get a big enough signal-to-noise ratio on the images they need. So even though modern hospital MRI scanners use superconductors that generate some of the strongest and most homogeneous magnetic fields on the planet, MRI – both for imaging and spectroscopy – is still a hugely time-consuming technique. What d-DNP can do is make MRI spectroscopy much more sensitive.
2 Delicately does it
Dynamic dissolution nuclear polarization, or d-DNP, boosts the signal-to-noise ratio of MRI by a factor of 100,000, creating incredible images. It involves transferring the polarization from a substance with unpaired electrons to the protons in a material such as pyruvic acid, shown here in a vial, by zapping it with microwaves at liquid-helium temperatures. The frozen acid is then lifted from the cryostat by hand and melted by dripping superheated water onto it. In this prototype system made in about 2006, Jack Miller is shown holding a large metal stick containing superheated buffer that he is ready to drop onto the sample in the cryostat. This liquid can now be injected into a biological sample and an MRI scan carried out. But you have to be quick as the polarization decays fast. Commercial, automated d-DNP systems designed for human use are now built by firms such as GE Healthcare, which use sterile plastics to transfer the pyruvic acid into a patient. (Courtesy: Jack Miller)
The technique involves mixing pyruvic acid with a stable chemical source of unpaired electrons, typically a carbonyl radical trapped in a tiny molecular cage known as a “trityl radical”. The mixture is put in a vial, which is lowered into a bath of liquid helium, cooling it down to a temperature of 1.4K (figure 2). Microwaves are then fired at the sample, transferring the polarization from the carbonyl’s electrons to the nuclei in the pyruvic acid, which now has a polarization about five orders of magnitude higher than at room temperature.
The acid is then transferred into a patient or other biological system in a nearby MRI scanner. This is done by squirting superheated water at a temperature of about 200ºC through a pipe on to the frozen acid so it rapidly melts. Another pipe is used to suck the acid up through a sterilized filter, which removes the trityl radical. The acid is then mixed with a base (to make sure it’s pH neutral), collected in a syringe and injected into the sample or patient. As the temperature of the pyruvic acid has changed almost instantaneously, the spins in the warm liquid are completely out of thermodynamic equilibrium.
Any enterprising experimentalist has got no more than five minutes to take advantage of the humungous increase in magnetization that dynanmic dissolution nuclear polarization affords
This is not an experiment for the faint hearted as pouring boiling water on to a cryostat is not usually a great idea. It’s also a race against time. From the moment that spin-polarized pyruvic acid is created, its signal starts dropping, returning to equilibrium with a characteristic decay time of about 60 seconds. Any enterprising experimentalist has therefore got no more than five minutes or so to take advantage of the humungous increase in magnetization – and hence signal – that d-DNP affords.
Get in quick
And that’s the big drawback of pyruvic acid. Only processes that occur faster than about 60s can be studied. Researchers literally have to run from their cryostat with their syringe full of pyruvic acid to the scanner. But once injected into a living system, advanced spectroscopic imaging techniques can follow the acid as it moves through the body, monitoring where it is, how quickly it moves and – most importantly – what it changes into (figures 3 and 4).
3 Heart of the matter
These MRI images show how d-DNP was used to study a patient who had suffered a heart attack five days previously. On the far left is the “ordinary” MRI image, with the heart marked by an arrow. The second image shows when pyruvic acid was injected into one of the patient’s veins, it was rapidly transported to every tissue in the body, including the heart and spleen (pink regions). The heart uses pyruvic acid in a complex series of biochemical reactions, with the resulting energy used to contract the heart muscle, which you can usually tell from a ring of bicarbonate produced – soon to be breathed out as carbon dioxide. Heart-attack patients do not, however, process the pyruvic acid in the normal way, leading to a conspicuous “hole” in the ring (see arrow in the third image). These images reveal a corresponding increase in lactic acid (shown on the far right in orange) in both organs, especially in this patient’s spleen, which indicates they were producing more immune cells in this areas – a known and imperfectly understood reaction to a heart attack.
The first people to be imaged with the technique were a group of men who had previously been diagnosed with prostate cancer. In a study led by Sarah Nelson from the University of California, San Francisco, in 2013, highly skilled pharmacists created the hyperpolarized pyruvic acid using a repurposed magnet from an Oxford Instruments nuclear magnetic resonance (NMR) machine operating at a field of 3.35T (Sci. Transl. Med.5 198). After injecting the substance into patients, the researchers were able to detect the cancer in each person examined from the increased amount of lactic acid they subsequently produced.
Lactic acid is one of the hallmarks of cancer because tumours produce a lot of it, acidifying the local environment, disturbing nearby cells and helping the tumour to spread. In one patient, the team in San Francisco even spotted an additional tumour deposit that conventional imaging missed. Confirmed by another biopsy, the detection ultimately led to the doctors changing the treatment that the patient underwent.
4 Brain impact
Conventional MRI is great at revealing the structure of tissues, such as this healthy human brain shown at three different depths (left column, top to bottom). The images were taken by a team led by the radiologist Ferdia Gallagher at the University of Cambridge, UK (NeuroImage189 171). When pyruvic acid was injected into a patient via a vein, d-DNP images reveal precisely how much energy the brain is using, as indicated by the bright yellow in the vein at the back of the head (second-left column). The acid is converted into lactic acid (middle column) and bicarbonate (right column). It is also possible to determine the rate, kPL, at which pyruvic acid transforms into lactic acid (second-right column). Some patients with tumours would see a dramatic increase in the rate of conversion. (Courtesy: James Grist et al 10.1016/j.neuroimage.2019.01.027 )
One difficulty with d-DNP is that the liquid helium, which is essential for the technique, cannot easily be sterilized. Spores remain visible in it, which – if they got inside a sick patient – could be deadly. It is therefore difficult to ensure that the technique is sterile, safe, repeatable and nowhere near as dangerous as it sounds. Our current solution is to transport the pyruvic acid from the cryostat to the syringe by via a single-use sterilized coaxial plastic tube.
These devices are outrageously expensive to make as they involve various sterile filters, flowing chemicals and computer-driven syringes to handle the pyruvic acid. The tube also has to be sturdy enough to withstand a temperature difference of almost 500ºC (i.e. from liquid-helium temperatures to the boiling-hot solvent) without cracking and spraying fluid around. Each scan on a human participant can therefore cost several thousand pounds.
The power of polarization Jack Miller is currently running a clinical trial to see how d-DNP can help women suffering from ovarian cancer. (Courtesy: Jack Miller)
But when you think how much it costs to treat cancer patients with surgery or drugs, it’s very much a price worth paying. And the results are breath-taking. What you get is a series of images that, roughly speaking, show the concentration of the pyruvic acid as it moves through the body and the concentration of what it turns into. These images are an invaluable insight into the human condition because the amount of acid depends on the specific biochemical reactions that occur in different parts of the body.
We know, for example, that anti-cancer chemotherapy drugs are successful if they slow the rate at which pyruvic acid is converted into lactic acid. So by imaging a cancer patient with d-DNP after they’ve taken the drugs, clinicians might be able to tell within days or hours if the drug is likely to work. Without d-DNP, patients often require another set of scans weeks later to see if they have worked and if the tumours have shrunk.
There are nearly 50 registered clinical trials using d-DNP around the world, including one I am setting up myself in Denmark. It will aim to help women suffering from locally advanced ovarian cancer, who in about 30% of cases currently need to undergo difficult operations that do not successfully remove the tumour. Surgeons are currently unable to accurately predict if they will be able to cut out a tumour before they start, and may – in hindsight – wish they had tried chemotherapy for longer beforehand.
The technique is the outcome of more than six decades of supposedly arcane basic physics that many would have dismissed as being irrelevant and of no use to the “real world”
Being able to quickly and objectively measure and quantify an individual’s disease – and how it is responding to therapy – is a holy grail of much medical research. Dissolution DNP could be a way to let us do this on a routine basis and is, I argue, a great example of interdisciplinary research and applied physics. The technique is the outcome of more than six decades of supposedly arcane basic physics that many would have dismissed at the time as being irrelevant and of no use to the “real world”.
I take great comfort in knowing that this wonderful mix of quantum physics, chemistry and clinical medicine is literally saving lives.
Stealing polarization from electrons
The principle behind dissolution dynamic nuclear polarization (d-DNP) can be traced back to the US theoretical physicist Albert Overhauser, who realized way back in 1953 that the gyromagnetic ratioof electrons is about 500 times bigger than for nuclei. Given that P is proportional to this ratio, the electrons’ polarization will therefore be far larger too. Overhauser predicted that by firing microwaves of just the right energy at a metal such as lithium-7, which has unpaired electrons, you ought to be able to transfer the large polarization of the electrons to its nuclei.
Three years later Thomas Carver and Charles Slichter showed that the polarization could indeed be “loaned” from electrons in this way (Phys. Rev.102 975). Using battery-powered solenoid magnets, they increased their polarization by two orders of magnitude from about 10–9 to 10–7. Other physicists joined in the quest for higher nuclear polarizations, with much progress made by the Latvian-born physicist Anatole Abragam. Rather than using lithium-7, he cooled a particular paramagnetic salt in a strong magnetic field until almost all its electrons at thermal equilibrium were in the ground state, achieving a polarization of nearly 1.
By firing microwaves at the sample, he was able to transfer a big chunk of the electrons’ huge polarization to the nuclei. The nuclei’s polarization rose over half an hour to about 0.8, which is many orders of magnitude bigger than it would be otherwise. The nuclei are said to be “dynamically polarized” because as soon as the microwaves are switched off, the electrons and nuclei both relax back to equilibrium. The value of P falls exponentially away with a half life ranging from seconds (for electrons) to days (for nuclei at very low temperatures).
The technique, which was then known simply as dynamic nuclear polarization (i.e. without the “dissolution” term), also became of interest to high-energy physicists at labs like CERN, who realized that metre-sized blocks of cryogenically cooled paramagnetic salts could be used as targets for experiments. These materials can be given a known spin, so by firing beams of particles into them, it became possible to study how hadrons interact under controlled conditions. By the 1970s, the technique had gone from being an obscure solid-state physics “trick” to a routine and useful feature of particle physics.
But there’s a big difference between measuring hadrons at low temperature and probing living biological materials. To do so, we need a molecule that polarizes easily, decays slowly and does something biologically interesting once injected into a living organism. Pyruvic acid fits the bill perfectly. Apart from being at the heart of all chemical reactions that power life, it’s miscible with commonly used chemical electronic free radicals, readily dissolves in hot solutions and is safe when injected into humans.
Australian company RayGen is tackling a problem that faces all solar farms: how to deal with the Sun’s intermittency in a way that makes economic sense. In temperate, cloudy locations such as the UK, the problem is often not enough sunlight. But where the Sun can be ferocious in the middle of the day – including a large part of Australia – electricity generation can threaten to overpower the grid. Raygen’s solution is to capture solar energy at high efficiencies, then store excess energy as a heat differential between two pools of water.
Physicists in the US have discovered a laser-based “switch” that turns a sample of ions completely transparent at certain frequencies. Working at the California Institute of Technology (Caltech), the researchers found that when they coupled ytterbium ions (Yb3+) to a nanophotonic resonator and strongly excited them with laser light, the ions abruptly stopped reflecting light at frequencies associated with their vibrations. This effect, which the team dubs “collectively induced transparency”, could have applications in quantum optical devices.
“We discovered the phenomenon while trying to develop techniques to control ytterbium atoms coupled to an optical cavity using laser light,” co-team leader Andrei Faraon tells Physics World. The cavity, which measures 20 microns across, contains roughly a million Yb3+ ions. As a group, these ions are vibrating at a broad distribution of frequencies, but Faraon explains that each individual ion only vibrates within a very narrow frequency range.
“When probed with a laser with lower power, the system is opaque,” he continues. “When the laser is tuned at a frequency exactly in the middle of the frequency distribution, however, and its power increased, the system becomes transparent.”
Akin to destructive interference
This selective transparency effect is related to how the ions oscillate with respect to the laser, Faraon says. He compares it to the well-known phenomenon of destructive interference, in which waves from two or more sources cancel each other out. In the system studied in this work, the groups of ions absorb and re-emit light continuously. Normally, this re-emission process means that laser light gets reflected. At the collectively induced transparency frequency, however, something very different happens: the re-emitted light from each of the ions in a group balances, leading to a dramatic decrease in reflection.
As well as collectively induced transparency, Faraon and colleagues also observed that the ensemble of ions can absorb and emit light much faster or slower than a single ion depending on the intensity of the laser. These processes are known as super-radiance and sub-radiance, respectively, and are not well understood. Even so, the researchers say that this highly nonlinear optical emission pattern could be exploited to create more efficient quantum optical technologies. Examples might include quantum memories in which information is stored in an ensemble of strongly coupled ions, as well as solid-state super-radiant lasers for ensemble-based quantum interconnects in quantum information processors.
Deep thinker Toichiro Kinoshita (left) and Richard Feynman, friends and collaborators on a boat ride during a high-energy physics conference at the Scripps Institute in La Jolla, California, in 1961. (Photo by Clarice Schwinger, courtesy AIP Emilio Segrè Visual Archives)
In both his personal and his professional life, the pioneering theoretical physicist Toichiro “Tom” Kinoshita forged the steadiest of paths through the most tumultuous of times. Born on 23 January 1925 in Tokyo, Japan, he spent the bulk of his career in the US where he played a trailblazing role in the development of quantum electrodynamics (QED). Most notably, his calculations of one of its key constants – g-2 – helped make QED the most precise theory in the history of physics.
Kinoshita, who died on 23 March 2023 aged 98, was no stranger to me. He was the father-in-law of a close friend and I had known him for almost three decades. In fact, I was fortunate to be able to talk with Kinoshita in depth about his long and fruitful career during an eight-hour oral-history interview that I carried out in 2016 for the Niels Bohr Library and Archives of the American Institute of Physics.
Japanese roots
As I discovered during our conversation, Kinoshita was the heir to a family of rice-farm owners who expected their male child to take over the family business. Their plans were disrupted by Japan’s role in the Second World War, which had already begun by the time Kinoshita was a teenager. Most of his peers were drafted to serve in the military, many never to return.
But Kinoshita was lucky. The Japanese military wanted those who had a talent for physics to calculate bomb trajectories for artillery barrages at the battle front. The authorities therefore pushed Kinoshita through a tightly compressed version of his high school and college curriculum at the University of Tokyo. Along the way, he learned advanced physics from mentors who taught articles, smuggled into Japan by submarine, that had been written by Werner Heisenberg and other German physicists.
Kinoshita learned advanced physics from mentors who taught articles, smuggled into Japan by submarine, that had been written by Werner Heisenberg and other German physicists
In August 1945, while on his university summer break, Kinoshita was at home with his parents in the city of Yonago when he heard on the radio that Hiroshima, which lay about 125 km to the south, had been flattened. As he told me in our interview, Kinoshita knew – from the magnitude of the explosion – that this was no ordinary bomb, but one that had to be tapping atomic energy. “I knew what atomic energy can do, so I thought immediately this must be an A-bomb,” he said.
A few days later he was at Shinjuku train station in Tokyo when everyone was unexpectedly instructed to stay put for important news. In what was a highly unusual move, the Japanese emperor came on the public address system to announce that Japan had surrendered. Kinoshita was relieved, as others around him were too; like so many Japanese people he was afraid of and appalled by the war begun by his country’s military leaders. “Wow, that’s good. I don’t have to die,” he recalled thinking.
Hundreds of thousands of American troops arrived a few weeks later and occupied the country. The new US-installed government pushed through a nationwide land-reform programme. The Kinoshita family’s land was seized and distributed among its sharecroppers, leaving Kinoshita with no inheritance. Strange as it may seem, he was thrilled because his sudden poverty freed him of his family’s expectations that he would become a landlord of rice farms. Instead, he would be able to pursue physics.
Surviving on grants from the University of Tokyo and from teaching physics classes at another nearby university, Kinoshita graduated in 1947 before going on to do a PhD. His mentor was Sin-Itiro Tomonaga, who later shared the 1965 Nobel Prize for Physics with Richard Feynman and Julian Schwinger. Tomonaga brought Kinoshita to the attention of Robert Oppenheimer, the US physicist who had headed up the Manhattan atomic-bomb project.
Oppenheimer in turn arranged for Kinoshita and his colleague Yoichiro Nambu – another future Nobel laureate – to be postdocs at the Institute for Advanced Study (IAS) in Princeton, New Jersey. Kinoshita could, however, barely scrape together the money for the passage and he was forced to take a cargo boat from Tokyo to Seattle. He also had to leave behind his wife Masako or “Masa” Kinoshita (née Matsuoka) – a former student in one of his classes whom he had married in 1951. Her wealthy parents, members of Japan’s small Marxist community, had been jailed during the war, then lost everything when Allied bombs destroyed their family business.
From Seattle, Kinoshita visited labs on the US west coast, including the Lawrence Berkeley Laboratory and the California Institute of Technology. Travelling by bus and train, he headed east across the Rockies, visiting first Denver and then Enrico Fermi’s lab in Chicago. Eventually he arrived in Princeton, with his wife joining him in 1953. Later that year he stayed with a landlady who couldn’t pronounce “Toichiro” and so dubbed him “Tom” – a name that was to stick for the rest of his life.
Wobbly foundations
In 1956 – after two years at the IAS and another at Columbia University in New York – Tom and Masa ended up at Cornell University, where he stayed for the rest of his career. There, Masa practised a traditional Japanese textile artform known as kumihimo, or “gathered threads”, giving workshops in the US and Japan, and publishing a monumental, 360-page book on the subject in 1994. She rediscovered and developed an archaic and nearly forgotten form of kumihimo that involved complex loops, redeploying it using her background in mathematics.
In 1962 Kinoshita visited CERN on a Ford Foundation fellowship. On the second day of his visit to Geneva, he joined a lab tour, and – while on the very first stop – found himself mesmerized by a graph that experimentalists at the Proton Synchrotron had tacked to the wall. Having measured the way muons wobble in a magnetic field, they wanted to know how their findings tallied with the theoretical value and were seeking someone who could calculate it.
Kinoshita was stunned by the graph, which reminded him of aspects of the research into QED he had carried out with Tomonaga during the war. He dropped out of the tour, went to the library, and worked the rest of the night. The next morning he returned to the Proton Synchrotron and told the experimentalists, “I know how!”
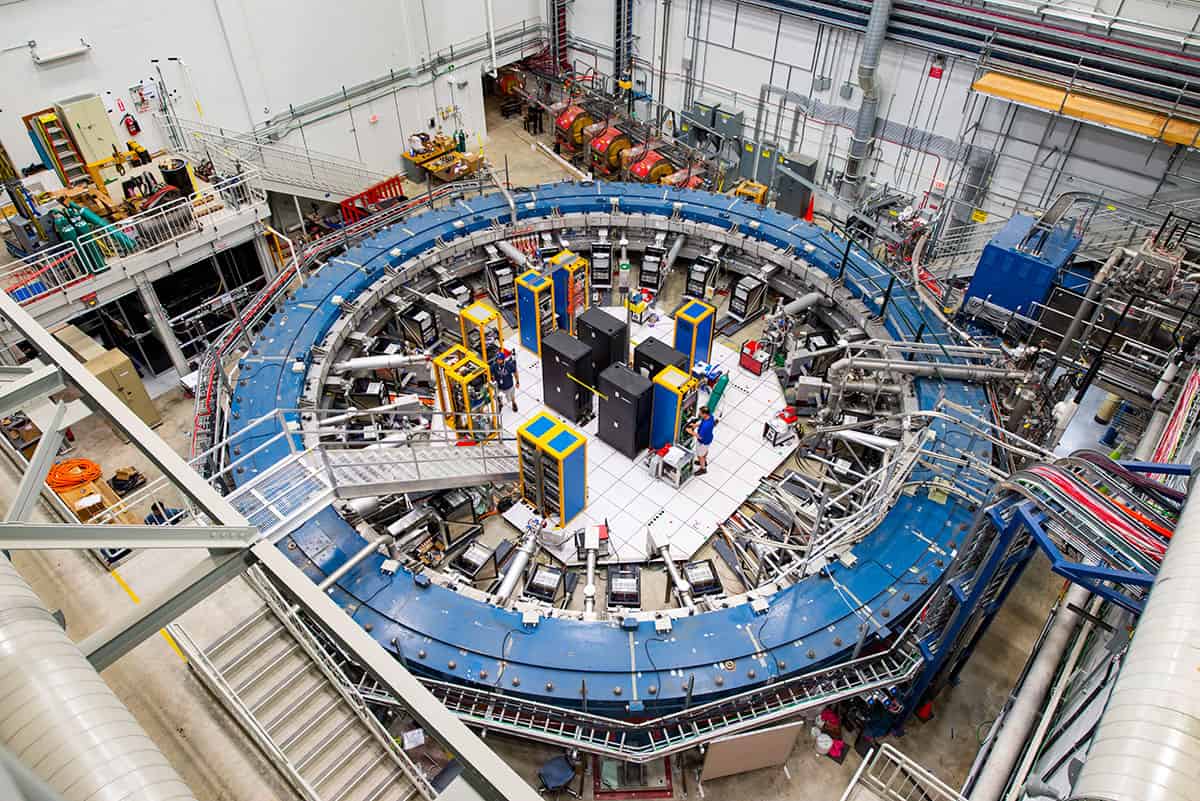
Measurement matters The Muon g-2 experiment at Fermilab in the US is the latest in a long line of attempts to see how muons interact with magnetic fields, with the discrepancy between the value of g-2 measured in such experiments and the theoretical value – calculated by the likes of Toichiro Kinoshita – potentially leading to a new understanding of nature. (Courtesy: Fermilab/Reidar Hahn)
It was exciting work, for the number was intimately woven into the foundations of QED. That theory conceives of particles as spinning magnets, with the ratio of their magnetic moments to their spin known as g. In the simplest form of quantum mechanics, g has a value of exactly 2. But reality had to be different, for muons are tugged by traces of all other particles – known and unknown, leptons and hadrons – each of which slightly affects the wobble.
Given that QED was a blueprint incorporating everything that theorists knew about, the difference between the experimentally determined value of g and 2 therefore measured the comprehensiveness and accuracy of the entire theoretical architecture of QED. In other words, measuring g-2 could reveal if that architecture was sound, even if it couldn’t tell you the exact location of any defect.
In fact, g-2 was so fundamental to QED that if nature contained new physics – particles or forces not yet discovered, and thus not in the theory – they would show up as the difference between the theoretically predicted amount and the value measured in experiments. Rarely does it make sense to go all out in pursuing calculations of a number; nobody measures recipe ingredients to thousandths of a gram or petrol to billionths of a litre. But g-2 is different. From a muon’s wobble, you can get precision.
The calculations, though, were incredibly hard, because they were unsolvable and thus had to proceed in a series of successive, ever more precise approximations. What’s more, each newly discovered particle and force had to be incorporated. Physicists commonly expresses this complexity in terms of the “Feynman diagrams” of each possible interaction, with each diagram corresponding to a series of long equations, and Kinoshita had to evaluate hundreds and even thousands of them.
When physicists say that QED is the most precisely calculated theory in the history of science, they can thank Kinoshita
Back then, Kinoshita worked alone and by hand in calculating g-2. As the years went by, he took on more helpers and used more powerful computers. Kinoshita eventually spent over half a century as a pioneer in the physics use of supercomputers and became one of their biggest users as he summed six, eight and then 10 orders of Feynman diagrams to calculate g-2 ever more precisely. When physicists say that QED is the most precisely calculated theory in the history of science, they can thank Kinoshita.
Meanwhile, a series of ever larger and more precise experiments were built to compare the experimental value with his: a sequence of three at CERN, one at Brookhaven National Laboratory and another at Fermilab. Sometimes the results were close to Kinoshita’s number, spreading fear among physicists that there was no new physics, while at other times the results were so far off from the predicted value that experimentalists and theorists alike were thrilled.
Kinoshita became an increasingly high-profile physicist as the go-to person for understanding the foundations of the Standard Model of particle physics. In fact, g-2 became an ever more high-profile number, as the world’s most powerful accelerator, the Large Hadron Collider, was eking out fewer and fewer surprises.
Despite officially retiring from Cornell in 1995, Kinoshita remained active in physics. In 2018, aged 93, he published a paper in Physical Review D (97 036001) refining his calculation of g-2 to the 10th order. His final paper – on the general theory of g-2 calculations to all orders –appeared the following year in Atoms (7 28). His student and close collaborator Makiko Nio, from RIKEN research lab in Japan, is one of the physicists now continuing the work.
The critical point
Quiet, methodical and meticulous, Kinoshita always appreciated or would contribute to the humour in every situation. Late in his life, friends learned to look for the sign that he was about to make a witty remark: an almost imperceptible uptick at both corners of his mouth, and a slight deepening of the wrinkles that fringed them. Eventually, Kinoshita moved away from Cornell, reluctantly, to a house in Amherst, Massachusetts, built by the architect Ray Kinoshita, one of his three daughters.
She had designed a house for herself with a separate living area for her parents, with shoji screens, open shelving and a wooden deck looking out into the woods, similar to the living quarters they had been accustomed to. The University of Massachusetts made Kinoshita an adjunct and gave him an office, where he showed up almost every day until COVID hit.
Admiring colleagues periodically put Kinoshita forward for a Nobel prize. He never received it, surely because his contributions, though indispensable to contemporary physics, are difficult to label. Physicists, however, benefit hugely from people like Kinoshita, who are intimately familiar with the resources, methods and techniques that underpin their field. Such physicists propel the discipline forward, yet cannot be easily pigeon-holed as discoverers or theory-creators. Kinoshita was like a reliable and trustworthy engineer who gives you the confidence that the house you and your entire community are living in won’t collapse.
Masa sadly died last year, and Tom soon after. The two will be buried together in Ithaca, near Cornell. Their headstone has been designed by their daughter Ray and by Ray’s own daughter Emilia Kinoshita, a designer and materials researcher. It will feature a blend of Feynman diagrams and kumihimo patterns, embodying the deepest shapes and rhythms of the unruly world that Masa and Tom lived through and explored.
A protocol for entangling microwave and optical photons has been demonstrated by researchers in Austria. This has the potential to help to overcome one of the central issues in the formation of a quantum internet by allowing microwave frequency circuits to exchange quantum information through optical fibres.
The central vision underpinning a quantum internet – first articulated back in 2008 by Jeff Kimble of Caltech in the US – is that networked quantum processors could exchange quantum information, much as classical computers exchange classical information via the Internet. Transferring quantum information is far more difficult, however, because background noise can destroy quantum superpositions in a process called decoherence.
Many of the most powerful quantum computers in existence, such as IBM’s Osprey, use superconducting qubits. These work at microwave frequencies, which makes them extremely vulnerable to disruption by background thermal radiation – and explains why they need to be kept at cryogenic temperatures. It also makes transferring information between superconducting qubits extremely difficult. “[One way] is to build ultracold links,” explains Johannes Fink of the Institute for Science and Technology Austria in Klosterneuburg. “The record was just published in Nature [by Andreas Wallraff’s group at ETH Zurich in Switzerland and colleagues]: 30 m at 10–50 mK – that has some challenges for scaling up.” In contrast, he says, “fibre optics works really well for communication – we use it all the time when we surf the Internet”.
Quantum transduction
A scheme whereby quantum information could be transferred between microwave qubits by sending photons down optical fibres would therefore be extremely valuable. The most direct approach is quantum transduction, in which, by the interaction with a third photon, a microwave photon is up-converted to an optical photon that can be sent along fibres.
Unfortunately, practical implementations of this process also introduce both loss and noise: “You send ten photons and maybe only one of them gets converted…and maybe your device adds some extra photons because it was hot or for some other reason,” says Fink’s PhD student Rishabh Sahu, who is joint first author on a paper describing this latest research. “Both of these bring the fidelity of transduction down.”
An alternative way to transfer quantum information is called quantum teleportation and was first demonstrated experimentally in 1997 by Anton Zeilinger’s group at the University of Innsbruck – for which Zeilinger shared the 2022 Nobel Prize for Physics. When a qubit interacts with one photon in an entangled pair, its own quantum state gets entangled with the second photon.
Entanglement swap
A quantum network could be produced under ambient conditions if this second photon could travel down a low-loss optical fibre to interact with an identically prepared transmission photon from a second network node through a so-called Bell state measurement. This would perform an “entanglement swap” between the remote superconducting qubits.
Entangled photon pairs are generated by a process called spontaneous parametric down-conversion, whereby one photon splits into a two. However, nobody had previously managed to generate an entangled pair of photons whose energy differed by a factor of more than 10,000. This difference encompasses a photon at an optical telecoms wavelength of about 1550 nm; and another at a microwave wavelength of about 3 cm.
Fink’s group pumped a lithium niobate optical resonator that was part of a microwave resonator with a high-power laser at telecom wavelengths. The vast majority of the laser light simply came back out of the resonator unchanged and was filtered out. However, approximately one photon per pulse split into two entangled photons – one microwave and the other at a wavelength just slightly longer than the pump photons.
“We verified this entanglement by measuring the covariances of the two electromagnetic field fluctuations. We found microwave-optical correlations that are stronger than classically allowed, which signifies that the two fields are in an entangled state.” says Liu Qiu, a postdoctoral researcher and joint first author on the paper describing the work. The researchers now hope to extend this entanglement to qubits and room temperature fibres, implement quantum teleportation and entangle qubits in separate dilution refrigerators.
Alexandre Blais of the Université de Sherbrooke in Canada collaborated on Wallraff’s Nature paper and he is impressed with Fink and colleague’s work, “Normally optics and microwaves don’t talk to each other. Optics is really high energy and tends to ruin the quantum coherence properties of your microwave circuits. Now [the researchers] have standing photons: if I want to transfer that information into another fridge I need to transfer that information into a flying photon in an optical fibre, and there will be loss there. And that photon then has to travel down that fibre, enter the second fridge and do some magic…We should not think that this makes everything easy now – it’s just the beginning, but that doesn’t take away from the quality of the experiment.”
Think of glaciers and images of vast, pristine sheets of ice, blanketing swathes of the Arctic and the Antarctic come to mind. While it’s true that 99% of glacial ice is restrained to the polar regions of our planet, glaciers are also found in mountain ranges on almost every continent, covering nearly 10% of the Earth’s land surface. Glacial ice is also the largest reservoir of fresh water on our planet – holding almost 69% of the world’s fresh water.
Despite appearing as silvery untouched rivers of ice in images, glaciers contain many organic deposits, such as dust and microbes. But researchers are finding they also encompass a worrying amount of toxic nuclear materials, and we are only now beginning to understand the risks posed as glaciers melt.
“For some of these glaciers that have been assessed, particularly the ones in the European Alps and other parts of Europe, the concentrations of some of these fallout radionuclides are as high as we’ve recorded them inside disaster zones like Chernobyl or the Fukushima area in Japan,” explains Philip Owens, an environmental scientist at the University of Northern British Columbia, in Canada.
Dust, dirt, microbes
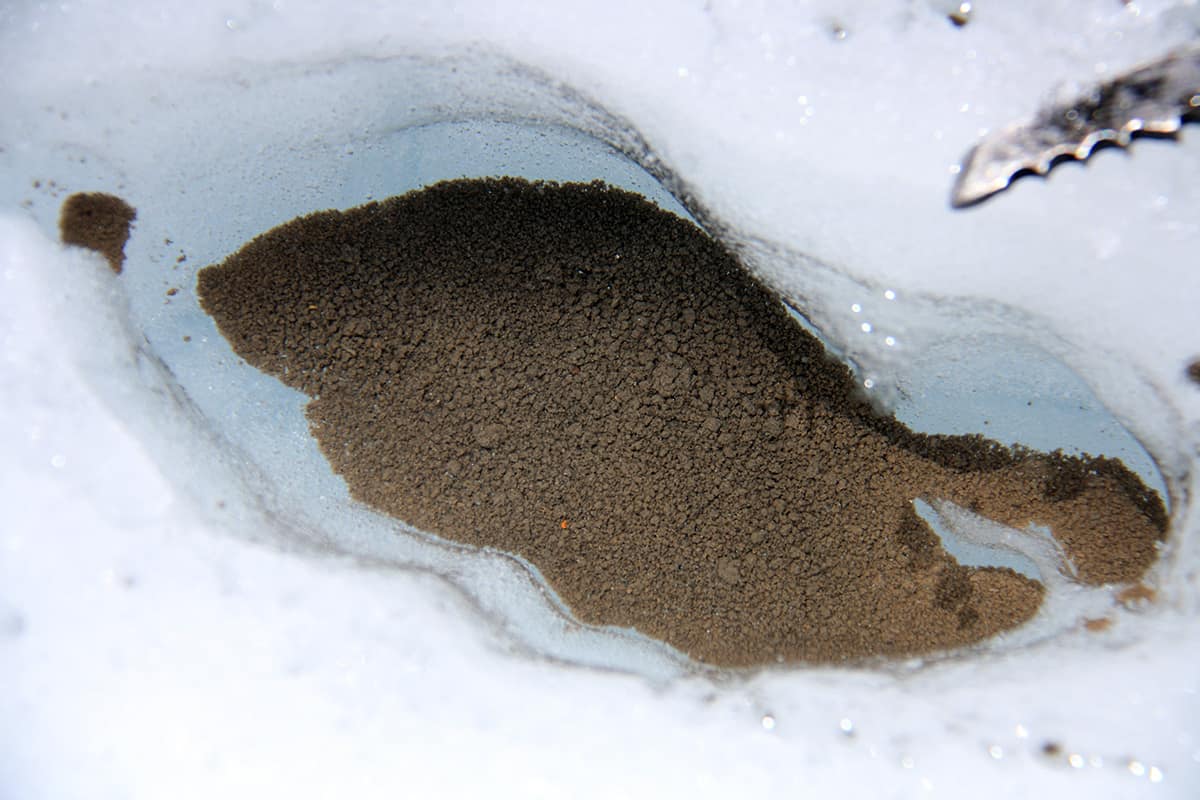
Up close, glaciers are not perfectly white. They are often grey and dirty looking, even black in places, thanks to deposits. Known as cryoconite, this dark, fine sediment that forms on glacial surfaces is made up of dust, dirt and soot, as well as small rock and mineral particles. It originates from a variety of places, including the local surroundings such as weathered rocks and exposed ground near the glacier – but also from faraway sources like deserts and arid land, wildfires and combustion engines.
These materials are carried onto glaciers through various processes such as wind, rain, atmospheric circulations, and anthropogenic and animal activities. Because this cryoconite is dark in colour it heats up in the Sun and melts the ice, creating water-filled depressions. These holes then become traps for more material, causing larger collections of cryoconite to form.
Shades of abundance A cryoconite hole in the Forni glacier in the European Alps, sampled by Giovanni Baccolo of the Paul Scherrer Institut in Switzerland. The colour of cryoconite depends on the different concentrations of the organic matter it is made up of: the darker the shade, the more abundant the organic matter. (Courtesy: Giovanni Baccolo – Paul Scherrer Institut)
Cryoconite is also full of organic materials such as algae, fungi, bacteria and other microbes. As these collect, grow and multiply on the sediment, they start to form a considerable part of the cryoconite mass. The organic matter also produces sticky biofilms, which help the microbes to stick to the sediment and each other, and form communities, helping collections of cryoconite to further grow.
But cryoconite is not just rocks, dust, dirt and microbes. Research has shown that it is also full of many different anthropogenic contaminants, including heavy metals, pesticides, microplastics and antibiotics. Like the more natural components, these too are trapped by the watery depressions and sticky biofilms, binding to the dust and minerals in the sediment.
Far-reaching radioactive fallout
In recent years it has become clear that cryoconite is often full of another rather unexpected contaminant – nuclear material in the form of “fallout radionuclides” (FRNs). Tests found that the concentrations of these artificial radionuclides greatly exceed those in other terrestrial environments. Indeed, some of these sediments are the most radioactive ever found outside of nuclear exclusion zones and test sites.
It has been known for a while that the surfaces of glaciers can have unusually high levels of radioactivity. In recent years scientists have been exploring the issue in more detail. According to glaciologist Caroline Clason from Durham University, in the UK, the concentration of radioactivity seen in cryoconite is sometimes “two or even three orders of magnitude higher than we would find in other types of environmental matrices, like sediments and soils, lichens and mosses that we find in different parts of the world”.
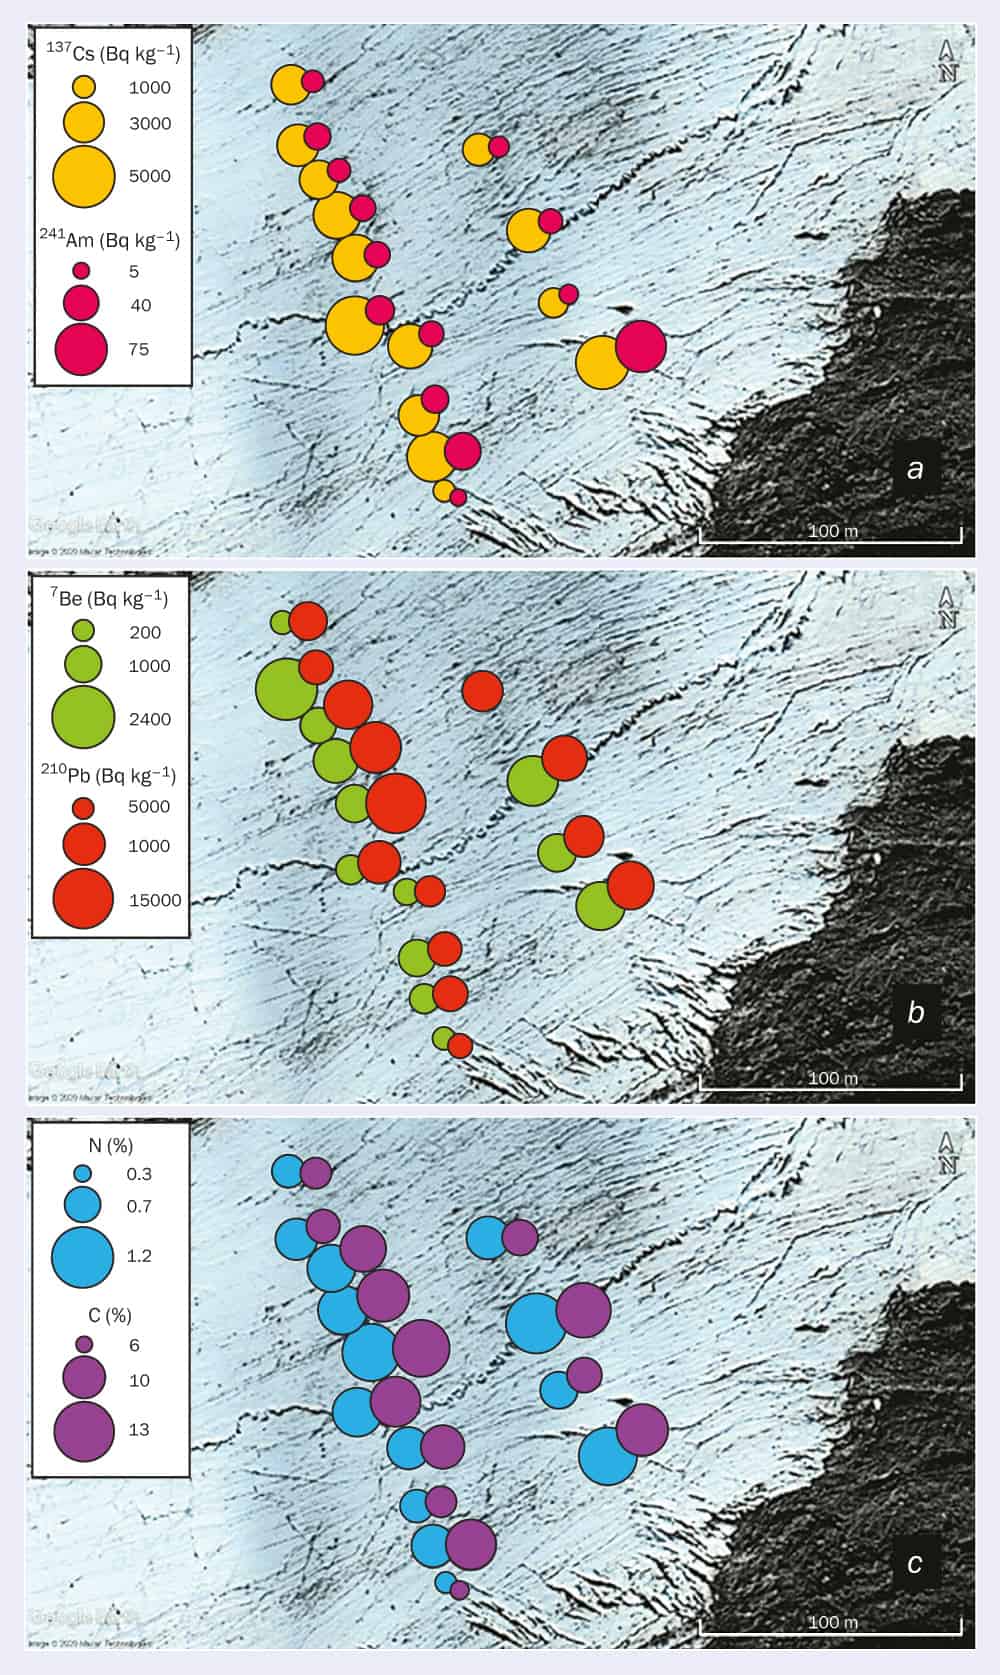
In 2017 Clason and colleagues discovered that levels of fallout radionuclides in cryoconite from the Isfallsglaciären glacier in Arctic Sweden were up to 100 times higher than in material collected in the valley around the glacier (figure 1). Concentrations of the radioactive isotope caesium-137 (137Cs) were as high as 4500 becquerels per kilogram (Bq/kg), with average levels of around 3000 Bq/kg (TC15 5151). “It’s quite incredible how much [radioactivity] the material on the glacier surface has managed to accumulate,” says Clason. “Much more than we see in the rest of the environment in the same location.”
The artificial radionuclides 137Cs and caesium-134 (134Cs) are fission products produced by the splitting of uranium-235 in nuclear power reactors and some nuclear weapons. Most of the caesium isotopes on the Norwegian and Swedish glaciers originate from the Chernobyl nuclear accident, but there is also fallout from the hundreds of atmospheric nuclear tests conducted in the mid-20th century.
Infamous as the worst disaster in the history of nuclear power generation, the Chernobyl incident took place on 26 April 1986 during a low-power test of the Number Four reactor at the Chernobyl nuclear power plant, which was then in the Soviet Union. The test caused an explosion and fire that destroyed the reactor building, and the catastrophic incident released a significant amount of radioactive material, including isotopes of plutonium, iodine, strontium and caesium. Most of this fell in the immediate vicinity of the nuclear power plant and large areas of what is now Ukraine, Belarus and Russia, but atmospheric circulations, as well as wind and storm patterns, also scattered it over much of the northern hemisphere.
Weather patterns dumped a substantial amount of the radioactive fallout from Chernobyl in Scandinavia. Norway is estimated to have received around 6% of the 137Cs and 134Cs released from the nuclear power plant. The isotopes were carried to the country by a south-easterly wind and deposited during rainfall in the days following the nuclear disaster.
The caesium then entered the food chain, as it was taken up by plants, lichens and fungi, which were eaten by grazing animals such as reindeer and sheep. In the years following the disaster large amounts of meat, milk and cheese from reindeer and sheep in Norway and Sweden had caesium-isotope concentrations that massively exceeded limits set by the authorities. These foods are still regularly tested.
There was also significant fallout from Chernobyl in the Austrian Alps, with heavy rainfall in the days following the disaster leading to very high levels of contamination in some areas. A 2009 survey of the Hallstätter and Schladminger glaciers in northern Austria found concentrations of 137Cs in cryoconite ranging from 1700 Bq/kg to 140,000 Bq/kg (J. Env. Rad.100 590).
Wind, rain, fire and more
There appear to be several reasons why cryoconite accumulates radionuclides and becomes so radioactive. Radioactive material is transported through the atmosphere by winds and global circulation patterns. It is then washed out of the atmosphere by precipitation, which is known to be particularly effective at collecting particulate matter and bringing it down to the ground. Furthermore, levels of rain, snowfall and fog tend to be high in the mountain and polar regions that host glaciers.
A lot of dry material, from phenomena such as forest fires and dust storms, also gets dumped in glacial environments. This dust, soot and similar material travels via atmospheric circulation, but as it does so it starts to bind together and scavenge other material from the atmosphere – including pollutants such as radionuclides – until it becomes too heavy and falls to the ground.
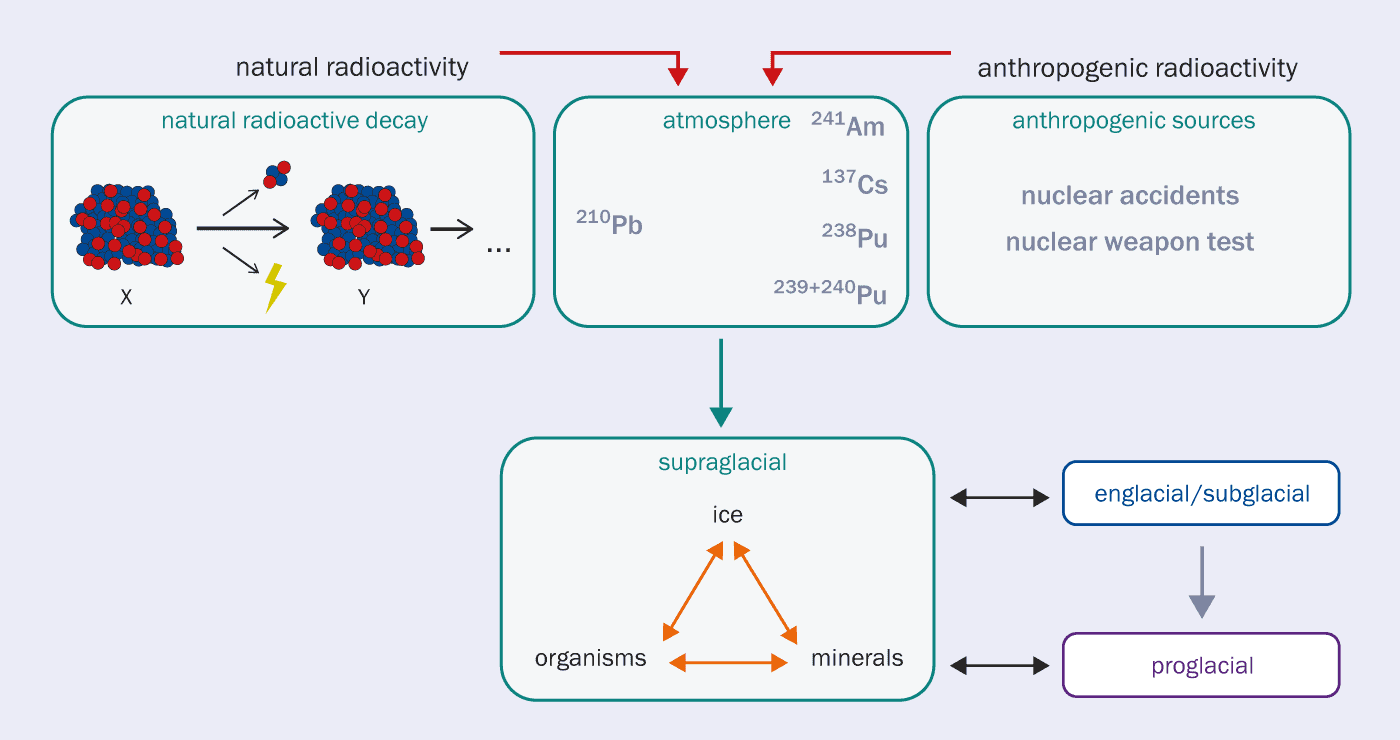
2 How radionuclides get into the glacial environment This illustration depicts the various sources of radionuclides that Edyta Łokas and colleagues found in cryoconite deposits in glaciers in Norway. Radionuclides come from natural sources and as a result of anthropogenic nuclear fission. The levels of these radionuclides in glaciers build up thanks to prolonged exposure of cryoconite to atmospheric dust, as well as the presence of certain cryophilic organisms and organic matter. Tests found the natural radionuclide 210Pb, which has a half-life of 22.3 years, and is formed in the atmosphere via radioactive decay of radon (222Rn). Anthropogenic sources such as nuclear accidents and weapons testing contributed isotopes of caesium (137Cs), plutonium (238Pu, 239Pu, 240Pu) and americium (241Am), all of which ended up in the glacial system. The elements transfer from the atmosphere via different processes and are found in varying parts of the glacier; such as on the glacier’s surface (supraglacial), in the margin of the glacier and the adjoining ice sheet (proglacial), within the body of the glacier (englacial) and at the bottom of the glacier (subglacial). (Adapted from: CC BY NC ND 4.0 Buda et al.2020 Sci. Tot. Environ.724 138112)
Once radionuclides and other contaminants are in the glacial environment, they are shifted around by hydrological processes. In warmer parts of the year, snow pack and ice in a glacial catchment melt, along with parts of the glacier itself. This melt water flows onto and over the glacier, taking contaminants like the radionuclides that were stored in the snow and ice with it. As the water flows through channels and holes across the glacier, it is filtered by cryoconite sitting in these depressions, which is full of materials including silts and clay that are known to bind elements such as radionuclides, metals and other anthropogenic particles (figure 2).
Organic scavengers
The biological component of cryoconite also seems to enhance its ability to collect and accumulate radionuclides. Indeed, Łokas explains that for cryoconite with a high proportion of organic material – such as algae, fungi and bacteria – the concentration of radionuclides is much higher.
The cryoconite on the Blåisen glacier in Norway that had particularly high levels of radioactivity also had a high organic content. While studies of other glaciers have found cryoconite that was between 5% and 15% biological material, the sediments from Blåisen were around 30% organic matter. The researchers say this could be part of the reason for its high concentrations of radionuclides.
Shades of grey Edyta Łokas from the Institute of Nuclear Physics of the Polish Academy of Sciences in Kraków on a glacier covered with cryoconite holes. (Courtesy: IFJ PAN/UAM)
Łokas says that the ability of cryoconite to hold and concentrate radionuclides seems to be “related to metal binding properties of extracellular substances that are excreted by micro-organisms”. These sticky biofilms immobilize metals, and other materials that can be toxic, to prevent them from entering the cells of the micro-organisms, she explains.
This link between organic matter and fallout radionuclides has also been spotted elsewhere. When Owens analysed cryoconite samples from the Castle Creek glacier in British Columbia, Canada, he found a significant positive relationship between the concentration of radionuclides in samples and the percentage of organic material (Sci. Rep.9 12531). The more biological material, the more radioactive material.
Owens explains that fallout radionuclides are everywhere. What’s happening on glaciers, he says, is that they are “being focused into these really small locations on the glacier surface”. There are ways that both the materials that make up the sediment and the extracellular substances excreted by the micro-organisms that live in it, can bind contaminants. This all makes the cryoconite a highly efficient scavenging agent, and over time radionuclides that have fallen all over the glacial catchment become concentrated in it.
Varying sources and concentrations
Although it tends to be the most concentrated, 137Cs is not the only radionuclide found in cryoconite. High concentrations of other radioactive materials, such as americium-241 (241Am), bismuth-207 (207Bi) and plutonium (Pu) isotopes, have also been detected. These are linked to the global fallout of radionuclides from atmospheric nuclear weapons testsrather than nuclear-power disasters.
This mix of inputs, along with global atmospheric circulation and weather patterns, means that sources and concentrations of radioisotopes on glaciers vary across the planet. For instance, Owens says that while levels of radionuclides are high in cryoconites in Canada they are mainly from nuclear bomb tests, as it is a long way from Chernobyl.
Łokas is currently analysing details of radioactivity in cryoconites from various sites around the world, including in the Arctic, Iceland, the European Alps, South America, the Caucasus Mountains, British Columbia and Antarctica. Glaciologists from many countries, including Owens and Clason, have donated, collected and tested samples for this work.
Concentrated activity The Gries glacier in the Leopontine Alps. Radioactivity in cryoconite is particularly high in the Alps. (Courtesy: Giovanni Baccolo – Paul Scherrer Institut)
Tests have found that radioactivity is particularly high in the Alps and Scandinavia, while Łokas says the lowest levels found so far have been on glaciers in Iceland and Greenland. No signal from Chernobyl was identified in these areas, just the global fallout from weapons tests, Łokas adds.
The work has also identified some interesting radionuclide signals. There are higher proportions of 238Pu, 239Pu and 240Pu in cryoconites from the southern hemisphere than the northern hemisphere, Łokas says. This is due to the failure of a satellite carrying a SNAP-9A radiothermal generator in 1964. The satellite disintegrated, releasing around a kilogram of 238Pu into the atmosphere, mainly over the southern hemisphere.
There is also a spike in 238Pu isotopes from samples of the Exploradores glacier in Chilean Patagonia. This is likely linked to the failed Russian Mars probe that broke up in the atmosphere over South America in 1996, Łokas says. It was carrying around 200 g of 238Pu pellets and, while their exact fate is unknown, they are thought to have fallen somewhere over Chile and Bolivia.
Cause of concern?
It is as yet unclear how worried we need to be about this concentration of radioactive material on glaciers. There is no certainty over whether it poses an environmental risk on a large scale, or whether it is a localized issue on the glaciers, Clason says. “I certainly wouldn’t want to go and eat the material on the ice surface; it’s really quite radioactive in comparison to other environmental sediments,” she adds. “But the extent to which that’s a problem once you are outside of that immediate glacial catchment, we just don’t know.”
When the sediment is sitting on the glacier, it is unlikely to be an issue for the ecosystem and human health. But as glaciers melt and retreat more and more of that legacy material stored on the ice gets released
There are reasons to be concerned. Radioactive materials have well-documented negative impacts on health. Glaciers also store vast amounts of fresh water, with billions of people around the world using the melt water for agriculture and drinking water. As the climate warms, glaciers are also retreating, which could potentially release stored contaminants and sediments in high concentrations.
“With all the glacial melt, this cryoconite material is coming into a lot more contact with glacial melt water. It’s now beginning to be exposed and can be delivered to the downstream ecosystem,” Owens explains. When the sediment is sitting on the glacier, he says, it is unlikely to be an issue for the ecosystem and human health. But as glaciers melt and retreat more and more of that legacy material stored on the ice gets released.
It is also not clear exactly how much radioactivity there might be in a glacial system, Clason adds. “In addition to direct atmospheric deposition of radionuclides, a lot of the radioactivity we see in cryoconite is likely being melted out of old snow and ice that was deposited many years ago,” Clason explains. “The ice itself has an inventory of radioactivity that isn’t well understood.”
Once it flows into rivers, the radioactive material is likely to be diluted, Owens says, “but we don’t know,” he cautions. Clason agrees. “While the concentrations are high where we sample, in the grand scheme of things, once all that material has been washed off or the glacier melts and deposits it in the environment, it might be diluted to the extent that it’s not above the concentrations you see in the environment otherwise,” she says. “So that’s what we need to figure out next.”
In the future, Clason hopes to carry out more detailed analysis of the amount of cryoconite on glacial surfaces, using techniques such as high-resolution drone imagery. This would allow researchers to estimate how much radioactivity there might be on a glacier. Mapping the cryoconite on the surface like this, and then combining the information with glacier melt models, could help us understand how the sediments and the contaminants they contain might be released in the future.
Don’t try this at home: a 19th century depiction of Benjamin Franklin’s famous experiment. (Courtesy: Bequest of A. S. Colgate, 1962)
Some of the most iconic images of the American polymath Benjamin Franklin show him doing a very silly thing — flying a kite in a thunderstorm. This is a reference to a famous experiment that Franklin is believed to have done in 1752, confirming that lightning was an electrical phenomenon similar to that observed in primitive batteries of the time.
However, according to the Brazilian historian Breno Arsioli Moura, most illustrations of the experiment misrepresent what Franklin is believed to have done.
According to Moura, the purpose of the experiment was to show that electricity can flow like a fluid from the sky to the ground. To do this, Franklin fastened a small metal spike to a kite and connected the spike to a conducting kite string. The other end of the kite string was fastened to a metal key. Also tied to the key was an insulating silk ribbon, which was held by Franklin as he flew the kite.
Tell-tale spark
The idea was that the metal spike would collect electrical charge from the sky and the charge would then flow down the string where it would accumulate in the key. After some accumulation time, Franklin would put a finger near to the key and look for a tell-tale spark that would confirm the flow of electricity from the sky to the ground.
The above image was published by Currier & Ives 120 years after the experiment was done. Franklin is shown gripping the conducting string with his right hand and holding the key in his left hand. Moura points that if done this way, the experiment would simply not work because Franklin would short-circuit the current to earth.
Franklin is also shown with a boy who is assumed to be his son William – but William would have been in his early twenties at the time of the experiment.
No lightning
In many illustrations, Franklin is shown doing the experiment with lightning flashing near the kite, but Moura says he did not intend to draw lightning down on himself – he wasn’t stupid, after all. Finally, Moura says that Franklin recommended that the kite flier be under a roof or some other cover to ensure that the silk ribbon remained dry because a wet ribbon would conduct electricity. Indeed, Moura says that many depictions fail to show the silk ribbon, which was a key component of the experimental set-up.
Because of his role in American independence, Franklin is a much romanticised figure in the US, so it’s not surprising that some artistic licence has been taken with how his famous experiment is portayed. Moura also points out that Franklin’s own account of the experiment is vague and that the artistic depictions tend to reflect a description published in 1767 by the English chemist Joseph Priestley. Although Franklin is thought to have approved of Priestley’s description, Moura says that the two accounts differ on several important points.
So why is this important to Moura? He believes that the uncritical use of inaccurate illustrations in classrooms and textbooks could undermine the teaching of important experiments. He also says that poor illustrations could also encourage people to try to do unsafe experiments, like flying a kite in an electrical storm. He describes his research in the journal Science & Education.
Stale sweets
It’s always disappointing to bite into a gummy sweet only for it to be all hard and stale. Keeping them soft and fresh is an important issue given that texture can be just as important as taste for such candies.
Now, researchers in Turkey at Ozyegin University and Middle East Technical University have carried out a series of experiments to explore how changing key parts of the gummy-making process, such as the concentration of starch and gelatin, can affect the final product, as well as how the sweets behave when stored at different temperatures.
The researchers used a statistical model to describe how each combination affected the quality of the gummy sweets, finding that to keep the sweets as soft as possible for as long as possible, it was best to store them at a warm temperature.
After this sweet success, the researchers now plan to study the role of plant-based formulations, mould shapes, and packaging types on quality. The team describes its research in the journal Physics of Fluids.
For millions of people with cardiac pacemakers and defibrillators, and for the manufacturers of these life-saving cardiac implantable electronic devices (CIEDs), a primary concern is avoiding device malfunction caused by electromagnetic interference.
Early research on electromagnetic interference between CIEDs and electric vehicle chargers was conducted with cars that required smaller current flows and electromagnetic fields than those on the market today. Newer high-power chargers use DC power and can deliver up to 350 kW.
“As the charging current is directly proportional to the magnetic field, the high-power chargers have the potential to cause clinically relevant [electromagnetic interference],” the researchers write in their latest study, published in the journal EP Europace.
In the study, the researchers asked 130 individuals with CIEDs to plug in and charge an electric car. No instances of electromagnetic interference or other adverse effects were found.
“This study was designed as a worst-case scenario to maximize the chance of electromagnetic interference,” says lead author Carsten Lennerz in a European Society of Cardiology press release. “Despite this, we found no clinically relevant electromagnetic interference and no device malfunction during the use of high-power chargers, suggesting that no restrictions should be placed on their use for patients with cardiac devices.”
Six car models from four manufacturers, including a test vehicle capable of drawing 350 kW from a high-power charger, were used in the study. The maximum voltage drawn was 1000 V, and the maximum current was 500 A. Participants were asked to place the charging cable directly over their CIED to maximize the likelihood of electromagnetic interference and were monitored for signs of device malfunction or changes in heart rhythms. During a total of 561 charges, the researchers did not detect any inhibition of pacing in pacemakers, nor any rapid arrhythmias that might lead to shock for patients with defibrillators.
Lennerz, an assistant professor at the German Heart Centre Munich, commented that while the current study was dedicated to testing for electromagnetic interference related to high-power charging technology, home chargers, which use a smaller current but alternating current (AC), are also likely to be safe for individuals with CIEDs.
Sub-clinical electromagnetic interference was not examined in the current study. Future work studying sub-clinical electromagnetic interference, the researchers note, should consider that wireless monitoring techniques may be impacted by electromagnetic interference. They also point out that because a small number of each specific CIED was tested, very rare events specific to any one device may not have been captured.
The methods and results of their study notwithstanding, the researchers remind individuals with CIEDs that it is better to not place a charging cable directly over a cardiac device and to not remain near a charge cable for long periods of time.
In this episode of the Physics World Weekly podcast, the CERN physicist Jamie Boyd talks about the ForwArd Search ExpeRiment (FASER), which is located 480 m downstream from a particle collision point on the Large Hadron Collider (LHC) in Geneva.
FASER is on the lookout for weakly interacting particles that are created in LHC collisions and then travel through rock and concrete to reach the detector. Earlier this year the experiment made history by being the first to detect neutrinos created at a particle collider.
But as Boyd explains, neutrinos were not the primary target when FASER was first proposed. Instead, the experiment was built to study hypothetical particles – such as dark photons – that are associated with dark matter. Dark matter is itself a hypothetical substance that many physicists believe can explain some puzzling properties of galaxies and larger-scale structures in the universe.








 This podcast is sponsored by