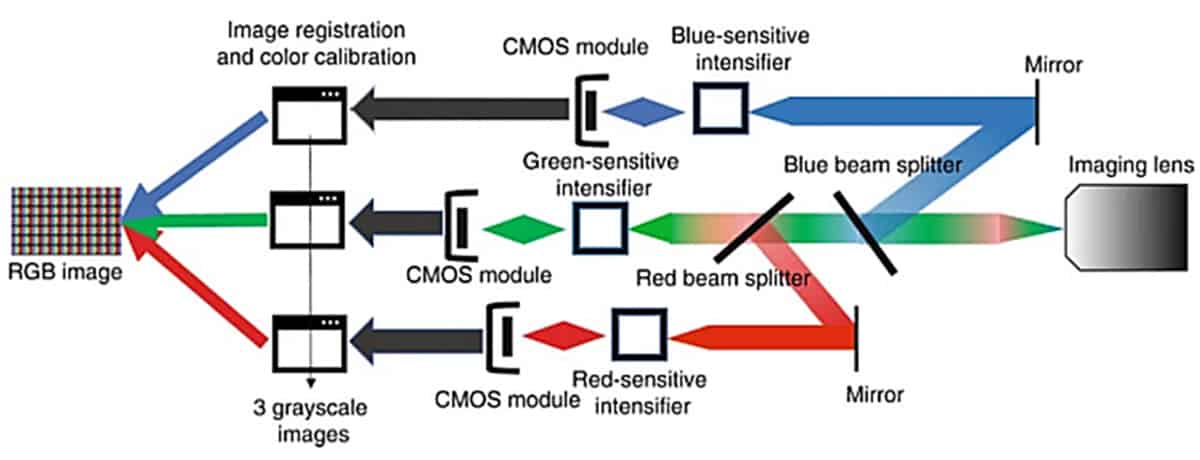
Custom camera Schematic of the colour Cherenkov camera that captures RGB wavelength channels separately. (Courtesy: CC BY 4.0/J. Biomed. Opt. 10.1117/1.JBO.28.3.036005)
Cherenkov imaging during radiotherapy enables real-time visualization and mapping of the radiation beams as they deliver dose to a patient’s body, providing a way to evaluate the accuracy of treatment delivery in real time. It is also being extensively tested in research laboratories worldwide as a tool to quantify the actual radiation doses delivered to patients, in a way that is unaffected by skin colour.
The optical imaging technique offers the benefits of high spatial resolution, high sensitivity and fast imaging speed compared with conventional methods for measuring radiation dose. But there are still challenges to overcome before all of its capabilities can be adopted for clinical use.
Cherenkov radiation is produced when charged particles travel at a speed greater than the phase velocity of light in tissue. The signal intensity is proportional to the delivered radiation dose and, in an ideal scenario, accurately indicates the dose delivered during radiotherapy treatment.
In reality, however, tissue attenuation reduces the intensity of the emitted Cherenkov radiation, and alters the linear relationship between deposited dose and observed Cherenkov emission. Because of this, the Cherenkov signal from human tissue is not yet accurately interpretable as fully proportional to the dose.
Researchers at Dartmouth College and the University of Wisconsin-Madison are working to make Cherenkov imaging a reliable indicator of radiation dose. In a recent study reported in the Journal of Biomedical Optics, they used a custom, time-gated three-channel intensified camera to image the red, green and blue wavelengths of Cherenkov emission from various tissue phantoms. They hypothesize that the intensity of Cherenkov emission changes with variations in biological absorption features – such as blood concentration within tissue and melanin concentration in human skin with different levels of pigmentation.
Brian Pogue “Spectroscopic interpretation may help to better relate Cherenkov emission to ionizing radiation dose delivered during radiotherapy.”
“Tissue absorption and scattering may cause a large variation among patients in detected Cherenkov emissions,” explains principal investigator Brian Pogue, of the University of Wisconsin-Madison School of Medicine and Public Health and Dartmouth’s Thayer School of Engineering. “We know that variation in skin colour can alter the signal level by up to 90%, and changes in blood or scattering content can cause up to 20% signal variation.”
“We conducted our study to better understand how tissue optical properties affect the emission colours of Cherenkov light, and to begin to identify ways to use the spectrum of the light for calibration or correction of tissue attenuation effects,” he explains.
For the study, Pogue and colleagues prepared tissue and blood phantoms with varying levels of melanin and blood volume. They created synthetic 0.1 mm-thick epidermal layers containing seven different concentrations of synthetic melanin that match those in human skin, and then placed these layers on top of thick bulk tissue phantoms. The researchers also tested seven blood phantoms with blood concentrations ranging from that of fatty tissue up to highly vascularized muscle tissue.
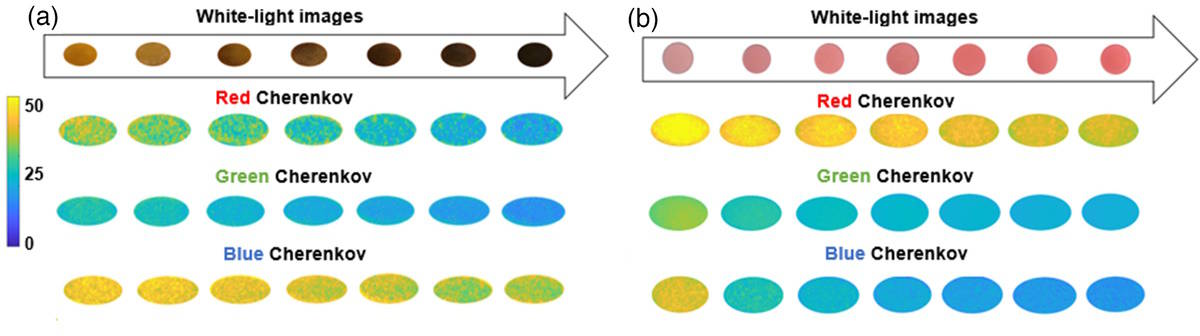
Varying melanin and blood concentration White-light and colour-resolved Cerenkov images of (a) tissue phantoms with melanin concentrations from 0.0018 to 0.072 mg/ml, and (b) blood phantoms with blood concentrations from 0.5% to 3.5%. (Courtesy: CC BY 4.0/J. Biomed. Opt. 10.1117/1.JBO.28.3.036005)
The researchers irradiated the phantoms with a 3 Gy dose using 6 MV photon and 6 MeV electron beams and acquired images for each colour channel. The acquisitions were time-gated to the linac, to capture Cherenkov emission only during the microsecond radiation pulses without background ambient light. They note that for both beams, there was no observable Cherenkov emission for melanin above 0.0076 mg/ml (a medium high-level).
The team reports that Cherenkov emission from the phantoms decreased as melanin concentration increased. Extremely high melanin levels caused a significant reduction in Cherenkov emission, making it challenging to perform imaging in individuals with the darkest skin tones.
Colour also made a difference when imaging blood phantoms, with greater attenuation as blood concentration increased. The red channel attenuated to a lesser extent than the blue and green channels, due to the absorption of blue and green colours by oxyhaemoglobin in the blood. “These findings suggest that imaging in the red and near-infrared wavelengths will be better,” comments Pogue. “In addition, having characterized the amount of attenuation in each colour band will facilitate calibration for skin colour.”
“Our findings support the idea that colour or spectral imaging of Cherenkov might provide an experimental methodology for separation of biological attenuation of the intensity from the physical generation of Cherenkov with dose deposition. The goal would ideally be to use the Cherenkov intensity as an indicator of the dose delivered in the tissue, independent of the blood volume within it or skin colour, using colour correction,” the researchers write.
The team has started a clinical trial with collaborators at Moffitt Cancer Center, to image patients with a larger range of skin colour variation, and hopes to expand the trial to UWHealth in Madison “This will allow us to test this type of imaging in patients who better represent the normal range of cancer patient populations,” Pogue tells Physics World. “We really want to better understand how the images look, and if we can rely upon Cherenkov imaging to show us the pattern of radiation delivery to all patients, independent of their skin colour.”
“So far, the data look encouraging,” he adds. “Because less light is emitted as the melanin content of the skin gets higher, we are also using colour imaging to correct for this. We are hopeful that we can make the system largely independent of the skin colour. We believe that spectroscopic interpretation may help to better relate Cherenkov emission to ionizing radiation dose delivered during radiotherapy.”
Researchers have succeeded in observing individual photons and a pair of bound photons interacting with a single quantum dot in a different way. The feat could pave the way to the manipulation of exotic photonic states with implications for quantum-enhanced measurement techniques, light-based quantum computing and metrology.
One of the characteristics of photons is that they do not easily interact with one another. This property allows for near-distortion-free transfer of information at light speed for long-distance communications in optical fibres. In some instances, however, researchers want light to interact. In interferometers, for example, they want to generate states of light that can make these instruments more sensitive. This requires some interaction between the photons.
The interacting photons form bound states, quasiparticles that give rise to technologically important physical processes like stimulated emission (lasing). Until now, however, such states had never been observed directly.
Inducing strong photon interactions
In the new work, researchers led by physicists Sahand Mahmoodian of the University of Sydney in Australia and Natasha Tomm from the University of Basel in Switzerland observed these states by guiding pulses of very dim laser light (that is containing a low number of photons) via a circulator into a quantum-dot cavity system. The light is backscattered and redirected by the circulator towards a so-called Hanbury Brown-Twiss set-up equipped with single photon detectors that record the moment at which individual photons hit them.
The pulses can be approximated as having zero, one or two photons in them, explains Mahmoodian, but the probability of having one photon is much larger than two photons. “When we measure the intensity of the pulse packet, that measurement is dominated by the one-photon part of the pulse because the two-photon part is much smaller in magnitude. We overcome this problem by measuring the so-called second-order correlation function of light, which allows us to measure the likelihood of two photons arriving within a very short time difference at the detectors.”
Two photons delayed less than one photon
The measurement technique, which is detailed in Nature Physics, is insensitive to single photons so it only records the two-photon part of the pulse. By comparing these two measurements, the researchers observed that the two-photon state was delayed less than one-photon state. They were able to see the difference between one photon interacting with their system compared with two because the device that they built induces such strong interactions between the photons. With this very strong photon–photon interaction, the two photons form the two-photon bound state.
“To measure single photons, we measure its time of arrival at just one of the detectors in our set-up,” explains Tomm. “To measure the correlation between two photons, we measure the time of arrival of two photons at two different detectors. If there is only one photon, only one of the two detectors ‘clicks’, and the other one not, so the ‘correlation’ between the two detectors is null. This is why this measurement is insensitive to single photons: we make use of two detectors. If there is only one photon, only one detector clicks.”
“Being able to see one photon and two photons interacting differently with a quantum dot (which behaves essentially like a single artificial atom) basically means we are doing nonlinear optics with just two photons,” adds Mahmoodian. “By demonstrating that we can identify and manipulate such photon bound states, we have taken a vital first step towards harnessing quantum light for practical use,” he tells Physics World.
According to the researchers, such quantum states of light can in principle be used to make more sensitive measurements with better resolution using fewer photons – something that could be important for applications in biological microscopy, where high-intensity light can damage delicate samples and in which the features being observed are particularly small.
“The platform that we have built is very flexible,” adds Mahmoodian. “It is an almost ideal interface between light and matter at the quantum scale and could be used to generate a variety of different types of quantum light for application in areas like quantum-enhanced communication, metrology or computation.”
For example, such a device could provide a building block for realizing special states of photons that can be used to build “fault-tolerant” quantum computers that are robust to noise, he says. “This is one of our future research directions.”
The United Arab Emirates’ Mars probe has taken the first high-resolution images of Deimos, the smaller and lesser observed of Mars’ two moons. The images were released yesterday at the week-long European Geosciences Union meeting in Vienna.
The image above, taken on 10 March, shows Mars and the near-side of Deimos captured in their exact relative positions. According to Hope science lead Hessa Al Matroushi from the Mohammed Bin Rashid Space Centre, the craft’s orbit allowed many flybys of Deimos that resulted in the clear images with the closest distance the probe came to the moon being 100 km.
“Because of our orbit we are able to take pictures not only from the near-side, but from the far side as well,” Al Matroushi told Physics World. “We are looking at Deimos from all sides.”
Data from Hope’s ultraviolet spectrometer matches that from Mars’ other moon – Phobos. This suggests that the two moons likely have their origins from breakoff matter from Mars, which has a basaltic make-up.
The main aim of Hope is to study the atmosphere of Mars and the mission has been extended for one more year. Al Matroushi hopes to now observe the effects of the varying solar cycle on the planet.
Al Matroushi also expects Hope’s findings to benefit other missions such as Japan’s Martian Moon Exploration, which is set to launch next year and plans to study Phobos and Deimos as well as retrieve samples from Phobos.
“It is very important how missions can benefit one another,” adds Al Matroushi. “No one mission can do it all.”
Most exoplanets lying in the habitable zones around stars are in fact inhospitable to plant life as we know it. That is according to a new study from microbiologists and astronomers at the University of Georgia who say that taking into account the light a planet receives as well as its ability to hold liquid water is a better definition of whether life could exist on other planets.
The Habitable Zone (HZ) is traditionally defined to be the range of distances around a star where an exoplanet can support liquid water on its surface. Too far, and the planet remains frozen like Mars. Too close and the oceans evaporate, as happened to Venus. The zone in the middle is neither too hot, nor too cold, but just right – the so-called “Goldilocks zone”.
Nothing certain is known about the properties and requirements of alien life. However, there are generally two schools of thought in astrobiology. One is that evolution on other planets can figure out ways to sidestep seemingly insurmountable barriers to life as we know it, while others claim that life is everywhere bounded by the same universal physical principles, and can thus only operate a certain way, similar to as on Earth.
The researchers started from the latter premise and introduced a “Photosynthetic Habitable Zone” (PHZ) – the area around a star where not only liquid water can exist, but where there is also sufficient light with wavelengths between 400 and 700 nm. The latter is necessary to generate a surplus of oxygenic photosynthesis – the energy source of all plant life on Earth.
“Oxygenic photosynthesis is crucial for the search for life in the universe. If we are going to recognize signs of life on an alien world, it would probably be a biosignature such as a substantial atmosphere that is oxygen-rich, because that is difficult to explain [without living organisms],” lead author Cassandra Hall from the University of Georgia, told Physics World. “The PHZ is more practical in some sense than the HZ because it provides a more comprehensive picture – not only is liquid water possible in the PHZ, but also Earth-like oxygenic photosynthesis, which we know for certain is capable of transforming a planetary atmosphere into one full of biosignatures.”
While it is possible that life on other planets evolves to photosynthesize beyond these wavelengths, there are compelling physical reasons to believe that this range may be universal. Water, for example, is highly transparent to light at photosynthetically active wavelengths, whereas beyond these wavelengths absorption rapidly increases, making oceans opaque to light from outside this narrow gap – a strong incentive for ocean-borne organisms to photosynthesize within the same ranges as on Earth.
Detecting biosignatures
The team also found that photosynthetic life may be less likely on planets larger than Earth. This is because their thicker atmospheres would block much of the useful light before it can reach the surface. These “super-Earths” and “mini-Neptunes” were previously considered to be potentially suitable abodes for alien life given that their thick atmospheres can produce snug, beneficial environments, even at greater distances from the host star. Hall and colleagues suggest instead that observable life is more common on small, Earth-like exoplanets with more tenuous atmospheres.
The detection of biosignatures in exoplanet atmospheres requires significant telescope time so the researchers hope their work will be used to direct observational resources towards planets more likely to show life.
While the James Webb Space Telescope only has limited capabilities to study exoplanet atmospheres, planned telescopes such as the 39 m European Extremely Large Telescope in Chile will soon be able to effectively hunt for oxygen on exo-Earths through transit spectroscopy. Even more ambitious is the Habitable Exoplanet Observatory concept mission at NASA, which would be able to directly image exoplanets and characterize their atmospheres.
So how can we increase the proportion of electricity generated by solar cells? Is it simply a matter of cutting the cost of the photovoltaic panels and increasing their availability? Unfortunately, no – the reality is more nuanced.
Solar farms are most productive in locations where the Sun beats down hard day after day, such as Australia and the south-west US. But in such places, so much energy is being generated during the middle of day that, at times, there’s too much. Owners of solar farms then have to pay the electricity grid to take away the additional energy. And if the grid doesn’t want it, the farms are forced to reduce their output or even shut down generation entirely.
To address this maddening state of affairs, new hybrid renewable energy systems are starting to appear in these locations, combining electricity generation with some form of energy storage, so that the grid only receives power when it needs it. However, while there are various storage options, they each have limitations. Lithium-ion batteries, for example, cost around five times as much as solar panels and their performance degrades with time. In hydroelectric schemes, the excess electricity would be used to pump water to higher ground, thus converting the electrical energy from the solar cells into potential energy that could be converted back when needed. But this set-up requires hilly locations, which are incompatible for solar farms because they are prone to cloud and rain. It is also prohibitively expensive to construct a solar plant in an arid location and connect it to a hydro scheme via electrical transmission lines.
One alternative to the conundrum is a patent-pending technology being developed by the Australian firm RayGen. By pairing solar cells with water-based thermal storage, this Melbourne-based company is offering what it claims is a cost-competitive system that meets the needs of grid operators.
Not just solar power
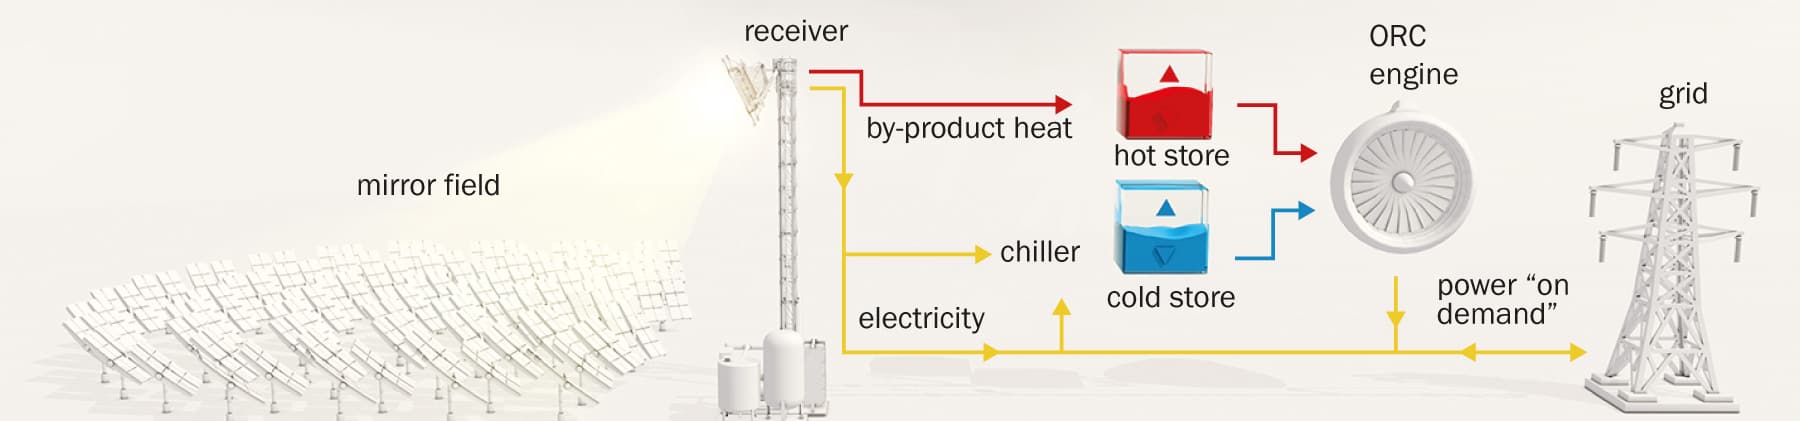
RayGen’s system consists of multiple stages and technologies (figure 1). First, a series of mirrors focuses sunlight onto a collection of solar cells at the top of a receiver tower. These cells convert the rays into electricity, which is fed into the grid, just like in a conventional solar farm. Although the focused light causes the cells’ temperature to increase, a cooling flow of water prevents them from overheating and becoming inefficient. The heat now held in the cooling circuit is transferred via a heat exchange to a secondary system that flows into a thermally insulated underground reservoir of water at a temperature of 90 °C.
1 Field of dreams The full RayGen system, combining focused solar power and water-based cooling. The field of mirrors (left) focuses the sunlight onto a receiver tower (middle left), which features a collection of solar cells. Excess heat from the cells is transferred into a hot store of water held at 90°C (red), while the electricity generated (yellow) either goes to the grid (right) or is used to cool a cold reservoir of water (blue). The two stores of water drive an organic Rankine cycle (ORC) engine, which can provide power to the grid on demand. (Courtesy: RayGen)
When the grid needs additional electricity, this thermal store, alongside a reservoir of cold water, drives an organic Rankine cycle (ORC) engine, in which the hot water evaporates ammonia that turns a turbine to generate electricity. The ammonia is then cooled and re-condensed by the cold water to go through the cycle again. On days when there is an excess amount of solar power, that electricity can bolster the energy-storage capacity of the thermal section of the system.
RayGen claims the cost of this system is kept down because it draws on various established renewable technologies – from pit-based thermal energy storage to photovoltaics and ammonia-based turbines – and so can compete in the marketplace. “On the solar side we’re cost-comparable with utility-scale photovoltaics on a dollar-per-watt basis,” says Kira Rundel, RayGen’s commercial manager. “On the storage side, it’s similar to pumped hydro. And in terms of the cost of energy storage, because we’re just using water, it’s similar to hydro power.”
Technology test run
RayGen has almost finished commissioning its first power plant, located about a six-hour drive inland from Melbourne, near a place called Carwarp. So many solar farms have been installed in this area that on a sunny day there can be an over-supply to the grid, which gives RayGen the chance to showcase its credentials. On this site the company has constructed four of its 1 MW systems, sitting side-by-side. In addition to generating up to 4 MW of electricity from the solar cells, this facility has a 50 MWh storage capacity, and can deliver 3 MW to the grid for 17 hours via the ORC turbines.
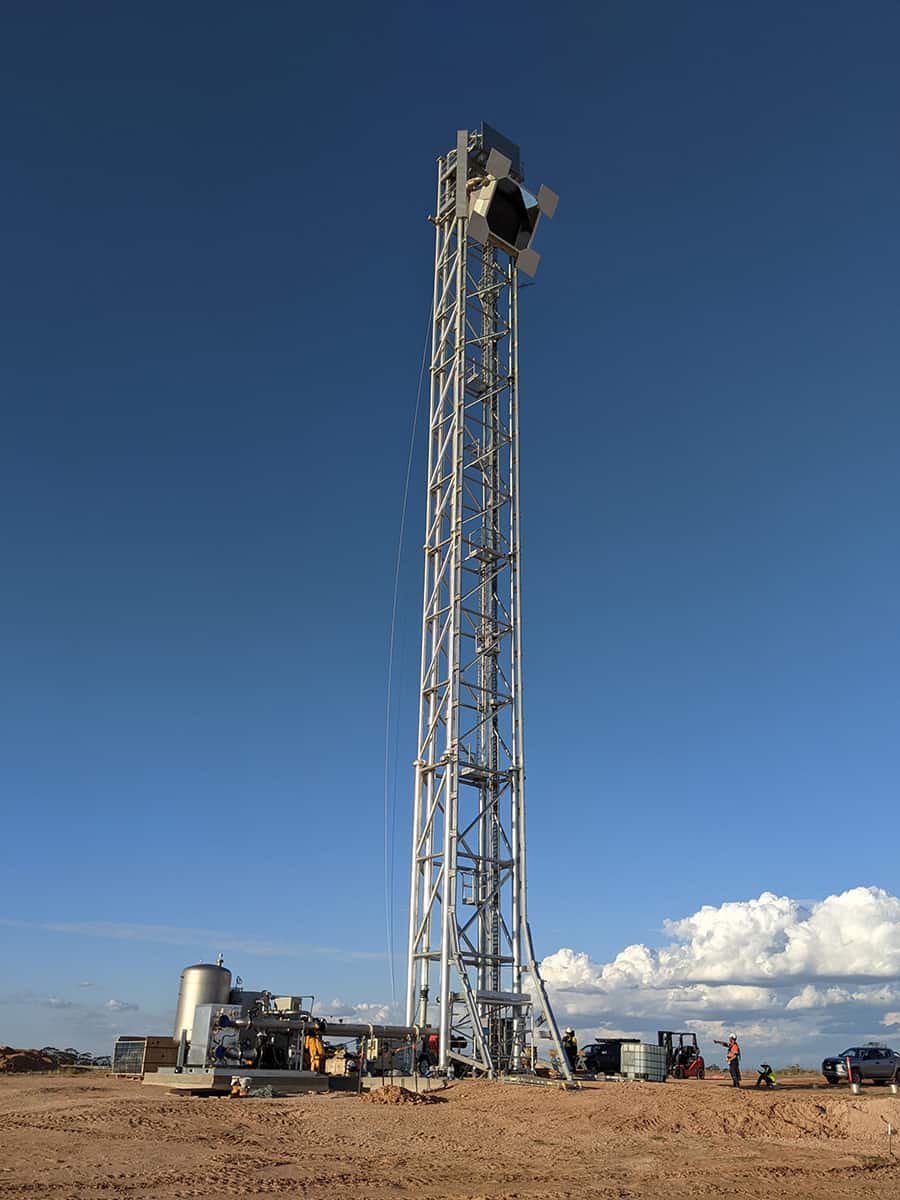
Focus point In the RayGen system, an array of mirrors direct sunlight to a photovoltaic receiver mounted on a tower, shown here under construction in July 2022. (Courtesy: RayGen)
Each 1 MW system features a field of nearly 300 “smart” mirrors, arranged around a tower-mounted photovoltaic receiver. The mirrors are able to track the position of the Sun through the day, directing light to the tower from dawn to dusk and focusing the rays by a factor of 750. As well as reducing the number of photovoltaic cells needed, and therefore the cost, magnifying the intensity of sunlight onto the receiver also delivers a valuable increase in efficiency.
The receiver itself has a 4.41 m2 active area comprising 441 solar modules, each 10 × 10 cm in size and populated with the most efficient class of commercially available solar cell. Widely used to power satellites – an application where high efficiency and a robustness to radiation are highly valued – these particular cells are made of several semiconducting materials, including germanium, gallium arsenide and gallium indium phosphide, so therefore have multiple p–n junctions. As each junction has a different absorption profile, the cells can capture most of the Sun’s full spectrum – which stretches from ultraviolet to infrared – grabbing twice as much sunlight as traditional silicon, and efficiently converting it into electricity.
With RayGen’s set-up, cell efficiency for electricity generation is around 38%, while for the modules it’s just over 35%, and receiver efficiency is nominally 32% (the exact figure depending on operating conditions). In comparison, cells made from traditional silicon would have a module efficiency of around 18–20%. While such silicon cells would save money, it would be a false economy according to RayGen’s chief research officer, John Lasich. He argues that this initial cost gain would be overshadowed by a substantial cut to electrical power generation and an inferior ratio of electricity-to-heat generation.
The role of water
RayGen also claims its technology addresses a major weakness of all traditional photovoltaic systems. Even those that use the best devices waste much of the Sun’s incident energy in the form of heat, which also raises the cell’s temperature and impairs its efficiency. In the RayGen system, however, this excess heat is used.
In each receiver, water is used to cool the photovoltaics. It is pumped up the tower, through the back of the modules and back down to the base, where a heat exchanger transfers the thermal energy to a secondary system. The re-cooled water in the initial circuit can then be pumped back up the tower to be reused.
The secondary system flows to the hot reservoir, which at Carwarp is a 17,000 m3 pit containing 90 °C water. The pit is lined with a polymer, insulated and sealed, which means that – thanks also to the very low surface to volume ratio – very little energy is lost. “If you think of it like a battery, the self-discharge is lower than a fraction of a per cent over several weeks,” says Lasich.
When the grid needs energy and the Sun isn’t shining, heat from this pit drives an ORC turbine. As ammonia is the working fluid in this closed-loop system, it has to be cooled and re-condensed after passing through the turbine, which is done with a second 17,000 m3 pit, held at a lower temperature. In hot, sunny places, such as the outskirts of Carwarp, this pit would heat up to 40 °C or more if not manually cooled. As this is only 50 °C less than the hotter pit, the efficiency of electrical generation from the ORC turbine would be no more than about 5%. So to increase that to 12–15%, RayGen cools the cold-water pit to near freezing using an industrial chiller, creating a temperature difference of around 90 °C between the two massive bodies of water. “That’s equivalent to a hydro set-up with two dams with a head of 1000 m,” says Lasich.
While 12–15% efficiency for energy generation from the turbine is not that high, no electricity is consumed in heating water to 90 °C. Electricity is only used for chilling the cold pit, and for every 1 MWh used for this purpose, 0.7–0.8 MWh is recovered when running the turbine. The chilling of the second pit enables RayGen’s energy storage system to behave just like a giant battery, according to Lasich. When the grid has more than enough energy, any excess can be used to run the chiller, which can also be powered by the electricity from RayGen’s multi-junction solar cells.
Sunny times ahead?
“The RayGen system is an interesting exploitation of concentrator photovoltaic (CPV) technology, and the storage element using water from cooling the cells is an excellent addition to the electricity generation alone,” says Geoff Duggan, who was chief technical officer at Fullsun Photovoltaics Limited in the UK, before it went into liquidation and was dissolved in 2022. He is not convinced, however, that this new approach will revise interest in CPV systems. “It has always been dogged by the costs and the inability to scale to capacities where costs will be dramatically reduced.”
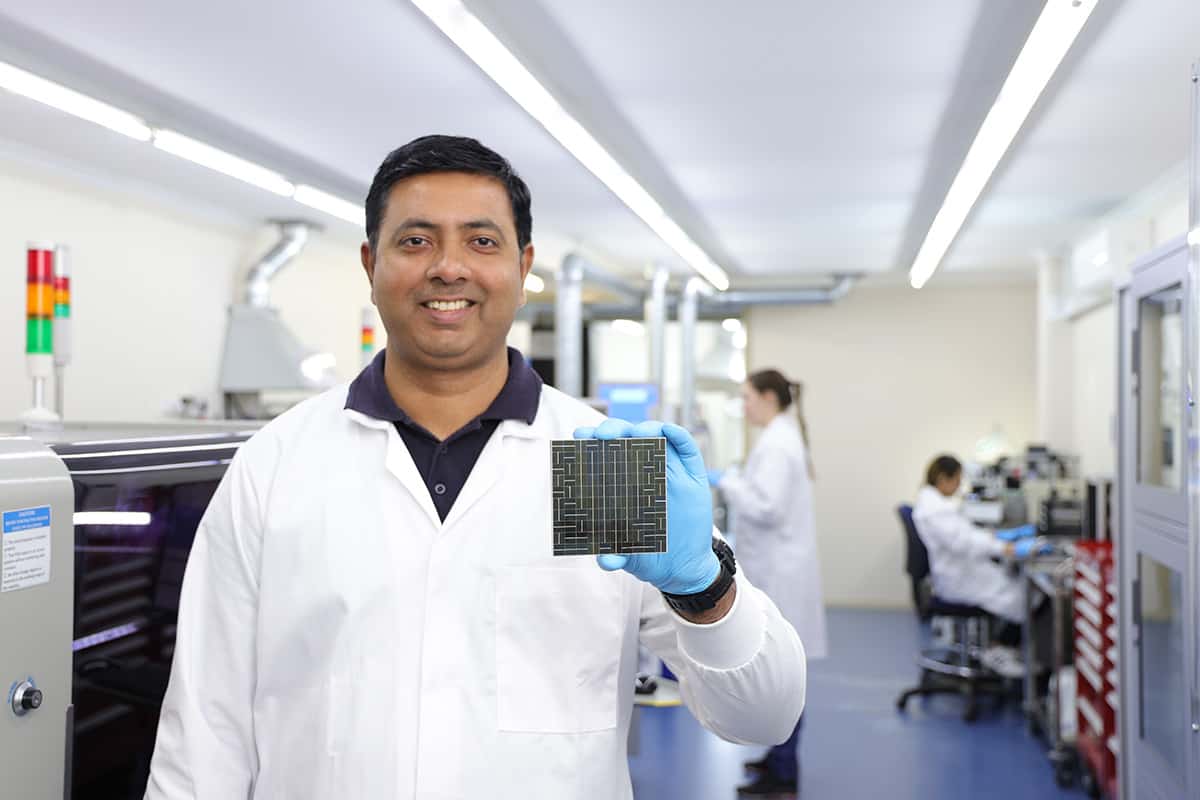
Extended range Srinivasa Balamurugan, module manufacturing expert at RayGen, holding one of the company’s solar cells. (Courtesy: RayGen)
RayGen is obviously more optimistic about the technology, and also says that customers ordering a RayGen system will be able to generate income from a number of different revenue streams. As well as getting paid for exporting electricity, further payments come from just being able to provide the grid with additional capacity, even if it’s not used. And on top of that, there’s a revenue opportunity from the frequency ancillary services market, because the combined solar and thermal system can respond within seconds to the demands of the grid. Rundel reckons that a RayGen system “delivers profitable and attractive commercial projects, together with our strategic partners”.
As well as signing off the 4 MW project near Carwarp, RayGen is putting together a production line to make its modules. It hopes the total number of modules produced each year will be able to generate 170 MW of power. As the number of projects in the pipeline continues to grow, this line will be expanded to greater scale.
Larger projects will also need larger systems. For example, the pits for bigger future projects will be scaled up in line with increased ORC capacity, to continue to provide 12–24 hours’ storage. RayGen expects pits at this scale to have a volume of 150,000–250,000 m3, depending on the required storage duration for a given project. One partner, Photon Energy, has already secured land in South Australia for a facility that will combine 300 MW of solar with a storage capacity of 3.6 GWh that’s capable of delivering up to 150 MW.
While initial projects are in Australia, RayGen’s ambitions extend overseas. Not everywhere in the world has the idyllic weather that a RayGen system needs, but there are opportunities anywhere with plenty of sunshine, a need for electricity, and a grid that would benefit from a flexible, fast supply and storage system.
A research team headed up at Duke Center for In Vivo Microscopy has created the highest-resolution MR images ever obtained of the mouse brain. The key to this breakthrough, which the team describe as “the culmination of nearly 40 years of research”, lies in the merging of magnetic resonance histology with light sheet microscopy.
The imaging technique, described in Proceedings of the National Academy of Sciences, could help improve our understanding of changes in the brain that arise from ageing or disorders such as Alzheimer’s disease.
To create the record-breaking images, the Duke researchers – working with colleagues at the University of Tennessee Health Science Center, the University of Pennsylvania, the University of Pittsburgh and Indiana University – first performed 3D MR histology of the mouse brain within the skull. They used a powerful 9.4 T MR scanner with coils that achieve gradients more than 100 times those of a clinical MRI system.
The researchers imaged the brain using gradient echo and diffusion tensor imaging (DTI) at 15 µm isotropic resolution – which they point out is roughly 1000 times higher than most preclinical DTI/MRI systems. The high-resolution MR data enabled creation of the most detailed MR connectivity maps ever achieved. They generated connectomes (a map of the neural connections in the brain) from track-density images with a super-resolution of around 5 µm.
Following the MR scanning, the researchers next imaged the brain using light sheet microscopy, an emerging technology that can produce 3D whole-brain images at cellular resolution. The technique allowed them to label specific groups of cells across the brain, such as dopamine-issuing cells, for instance, to visualize the progression of Parkinson’s disease.
An important enabler here was the ability to perform accurate image registration. The team used high-performance computing pipelines to merge the DTI with light sheet microscopy of the same specimen, providing a comprehensive picture of cells and circuits. This resulted in a so-called high-dimensional integrated volume with registration (HiDiver) with an alignment precision better than 50 µm.
The researchers performed four experiments to develop and validate their HiDiver technique. First, they studied 90-day-old mice to create new 3D HiDiver reference atlases with 24 times the spatial resolution of any previous DTI atlas. They used a second set of mice to improve throughput and test the registration accuracy. The third experiment tested the robustness of HiDiver registration to variations in mouse genotype and age.
Finally, they performed a high-throughput study examining how different regions of the brain and strains of animal were affected by aging. One set of MR images, for example, showed how brain-wide connectivity changes as mice age, and how specific regions, such as the memory-involved subiculum, change more than the rest of the brain. Another set of images revealed brain connections that highlight the deterioration of neural networks in a mouse model of Alzheimer’s disease.
The researchers say that new insights from mouse imaging will lead to a better understanding of conditions in humans, such as how the brain changes with age, diet, or even with neurodegenerative disorders such as Alzheimer’s or Parkinson’s diseases.
“It is something that is truly enabling. We can start looking at neurodegenerative diseases in an entirely different way,” says lead author G. Allan Johnson in a press statement.
Machine learning has been used to characterize the heavy elements that the first stars in the universe passed on to their immediate successors after they exploded in supernovae. This cosmic inheritance of elements was studied by researchers affiliated with the Kavli Institute for the Physics and Mathematics of the Universe in Tokyo, who have found evidence that most of the first generation of stars in the universe existed in systems of two or more stars.
The first generation of stars in the universe formed from material provided directly from the Big Bang – which was almost exclusively hydrogen and helium. Believed to be massive and short-lived, these stars created heavier elements (called “metals” by astronomers) when the stars exploded as supernovae. This material then formed the building blocks of the second generation of much longer-lived stars – some of which survive to this day in the Milky Way. While these stars contain more heavier elements than the first generation, they are still described as “extremely metal poor”.
Previous computer simulations have suggested that many first-generation stars existed in groups of two or more, but until now there has been no observational evidence of this multiplicity. Now, the Kavli team has used a machine learning system to analyse the metal content of about 460 second-generation stars that were observed by the Prime Focus Spectrograph on Japan’s Subaru Telescope in Hawaii. These spectral data contain information about the elemental makeup of the stars and the supernovae that provided the material for their formation.
Simulated supernovae
The data were analysed using a machine learning algorithm that was created by Tilman Hartwig of the University of Tokyo. Machine learning is a type of artificial intelligence (AI) and the system was trained using thousands of simulations of first-generation supernovae over a wide range of stellar masses and explosive energies. These simulations used a nucleosynthesis model to predict the elemental production of each type of supernovae. The algorithm was then able to determine whether a second-generation star was created with the output of one supernova or of several supernovae.
“We found that the majority (68%) of second-generation stars were enriched by multiple supernovae from the first stars, by analysing the chemical compositions of the observed second-generation stars,” explains team member Chiaki Kobayashi of the Centre for Astrophysics Research at the UK’s University of Hertfordshire. “Our findings mean that at the beginning of the universe, the first stars formed in a multiple star system or in a cluster of stars, which was indicated in theoretical simulations, but has never been confirmed with observations before.”
“Light elements such as carbon and nitrogen can be produced in low-mass stars like the Sun, but the majority of elements such as oxygen and iron are produced by supernovae. The latest research also suggests that the heaviest elements such as gold and uranium are also produced by supernovae,” she explains. “These elements are distributed from star-forming regions to interstellar medium by supernova explosions. This process can trigger or can suppress the formation of the next generation of stars, and therefore supernovae are important for the entire history of galaxies.”
Stellar birth and death
Miho Ishigaki, who is also at the University of Tokyo adds that the conventional approach to interpreting the elemental abundances in star is to fit the data to a model that describes the output of a single star that has undergone a supernova. This assumes that only one supernova is responsible for producing the metals in a given extremely metal-poor star.
“If more complex situations, such as the multiple supernovae enrich the next generation of stars, it is not possible to constrain the models with confidence given limited data,” she says, which is why the team turned to machine learning. “The machine learning approach is an efficient way of interpreting those data taking into account complex theoretical models. Such an AI-based approach will be more important in the next decade when more data from upcoming astronomical surveys become available,” she explains.
Kobayashi adds, “I can now imagine lots of bright stars forming together, which can speed up galaxy formation and chemical enrichment of the universe. This idea is consistent with what we are seeing with the latest results from James Webb Space Telescope.”
Kobayashi says that the team will next investigate is how many supernovae on average enriched the second generation of stars, a study that will require more accurate observational data.
This video with Helsinki-based company Bluefors was filmed at the 2023 March Meeting of the American Physical Society in Las Vegas. It features the firm’s vice president and general manager Sauli Sinisalo along with director of services Sami Nyman. Together, they outline how Bluefors’ ultra-low temperature cryogen-free dilution refrigerators support quantum research and development.
Sinisalo and Nyman also explain how Bluefors’ new Total System Care allows the company to service, maintain and analyse the performance of their systems to make sure they keep running smoothly. The new Bluefors Lab service, meanwhile, can be used to test quantum hardware, software or other applications – providing companies in the early phases of R&D access to a millikelvin measurement system.
The LIGO-India detector will be an identical copy of the two Advanced LIGO (a-LIGO) observatories located in the US at Hanford, Washington, and Livingston, Louisiana, which each consist of an L-shaped interferometer with 4 km-long arms. In 2015 researchers working at the two detectors announced the first direct detection of gravitational waves.
As well as providing the interferometer’s hardware and design data, Caltech and MIT will help to install the new facility. India, meanwhile, will build the vacuum system and other infrastructure to house and operate the interferometer. IUCAA will lead in gravitational-wave science and data computation, while RRCAT will assemble the laser and mirror, and the IPR will install the high-vacuum system.
Having first recieved “in-principle” approval from the Indian government in 2016, India has already started some pre-construction work, including designing the LIGO-India buildings, laying roads to the site and fabricating and testing vacuum chambers. Once operational, the observatory will work with the existing network of gravitational-wave detectors – the two aLIGO detectors in the US, Virgo detector in Italy, and the KAGRA detector in Japan – to allow gravitational-wave sources to be better pinpointed and monitored.
The project will be a great source of learning and excitement for future generations of young physicists in India
Qudsia Gani
“Until know, we have had a limited view of the universe,” says Caltech physicist Rana Adhikari, who helps lead the development of LIGO India. “With LIGO-India, we have three immediate upgrades to the world’s gravitational capabilities: finding signals in parts of the sky that LIGO is blind to, being able to point astronomers to the precise location of these explosions, and, perhaps most importantly, being able to measure both polarizations of gravitational waves.”
‘Exciting’ opportunities
Tarun Souradeep, director of Raman Research Institute, Bangalore who is a former spokesman of LIGO-India, says that the project will bring together researchers in fundamental and applied sciences and high-end technology, from national research laboratories, universities and industry.
Early-career physicists in India are also excited that LIGO-India is finally moving ahead. “LIGO-India offers cutting-edge research opportunities to young researchers in laser physics, optics and computing, besides general physics,” says Qudsia Gani, from the Government College for Women in Srinagar. “LIGO-India provides an opportunity to the Indian researchers who would otherwise have needed to go elsewhere to pursue research in such fields.”
Some of those opportunities have already begun, with Indian students working with the aLIGO team as part of Caltech’s Summer Undergraduate Research Fellowship (SURF) programme. Caltech also plans to invite several visiting scientists from India to work at aLIGO. “The project will be a great source of learning and excitement for future generations of young physicists in India,” adds Gani.
Superposition, entanglement and other baffling facets of the quantum world are now the driving forces behind various breakthrough technologies. Whereas “quantum 1.0” was all about interrogating the mysteries of Schrödinger’s wave equations and setting up clever experiments to close loopholes in the theory, “quantum 2.0” is putting the most bizarre aspects of quantum physics to routine work. Quantum computers based on superposition, as well as encryption devices relying on entanglement for long-distance communication, are now all becoming technologically viable.
But despite the burgeoning growth of quantum technology, one thing that hasn’t changed is the cumbersome and counterintuitive language we use to talk about all things quantum. While the reality of entanglement and superposition is beyond all reasonable doubt, it is as maddening as ever to describe them in words. Quantum phenomena are strange, but that does not mean we should be satisfied with strange language to describe them.
From the very early days of quantum mechanics, Albert Einstein, Niels Bohr, Werner Heisenberg and others strove to understand this new-fangled non-classical physics of quantum 1.0. Their struggle concerned a gap between how we talk about phenomena and how we encounter them in the laboratory. That gap was created by the imperfect metaphorical language still largely used to characterize non-classical phenomena.
While the reality of entanglement and superposition is beyond all reasonable doubt, it is as maddening as ever to describe them using words
The concept of “entanglement” can’t help but evoke two (or more) discrete things being woven together yet somehow also separate, like tangled skeins of yarn. As for “superposition”, it conjures up the image of a cloud of different states just before some external cause selects one state, while the others vanish. Or think of terms and phrases like “field”, “path”, “self-interference”, “collapse of a wave function” or a “photon choosing to go back in time”. There’s a big gap between what’s being pictured and the phenomena they label.
Language counts
Physicists usually have a firm enough intuitive grip on what’s happening when immersed in their craft that they’re generally not that bothered by these terms, even if sometimes they’re still a mystery. In quantum 2.0, however, with its soon-to-be-commonplace devices and future applications, we should be careful how we use the language we inherited from quantum 1.0. There are two reasons why.
The first is clarity. If scientists can’t straightforwardly describe how these devices and applications work, it makes the devices seem mysterious and other-worldly. Spooky and counterintuitive language also makes scientists seem like priests, anointed individuals who connect with the beyond. If physicists can’t put things in language that others understand, it implies that no language makes sense, or physicists can’t find one that does, or they’re making things up. This ultimately encourages scepticism and science denial, as well as acceptance of scientific illiteracy.
A second reason is practical. Finding the right language for quantum effects can help avoid confusion in developing quantum 2.0 technologies. Bad metaphors may make certain kinds of devices – quantum telephones, human teleportation devices – seem more physically plausible than they are. On the other hand, taking metaphors too literally – hewing too closely to the pictures conjured by them – can tilt the thinking of designers in the wrong direction. Better pictures of the real will help to plan better experiments to study it.
The word “entanglement”, for instance, is a good way of talking about quantum physics in certain areas when we can cast behaviour in terms of particles. But we can’t think of discrete energy states in a field too literally as particle-like; that is, independent of each other. To do so would require a mechanism for their dependence. That, in turn, would need other metaphors, such as the wave function being able to “choose” its states, which in turn demands either non-local effects or superluminal communication.
As for “superposition”, it is also a metaphor that works in certain situations, such as those where it seems as though possibilities exist simultaneously. But this suggests there is a kind of “container of possibilities” – like an electron in a potential well – that shows up only at the quantum scale. This, in turn, implies that quantum and classical phenomena are separated by a distinct border rather than by a difference of degree. The metaphor is therefore hard to apply to, say, macromolecules, quantum liquids or the quantum fluctuations near the event horizon of a black hole, where the two bleed into each other.
The critical point
Bohr famously held that we cannot make a literal picture of quantum phenomena, which poses a seemingly insurmountable obstacle to precise language. But he did not mean we should abandon the attempt to create language that we really and truly understand that describes accurately what we encounter. Bohr struggled mightily to create a language that reconciles the peculiarity of quantum phenomena with the ordinary language used to describe experimental situations. Still, there is no reason to think that it is impossible to develop a language that successfully describes quantum phenomena.
There is no reason to think that it is impossible to develop a language that successfully describes quantum phenomena
QBism is one attempt. QBist language combines the resources of Bayesian probability and quantum information theory to treat the preparation of quantum systems, not as picking out wave-like or particle-like things, but drafting a probabilistic assessment of measurement outcomes for the user. Instead of seeing, say, a photon with unknown polarization as “making a choice” about its polarization when shot through a calcite crystal, the QBist approach treats the result as “updates” in our “information about the system”.
This language provides a unified description, but does not insist that the photon is “particle-like” or “wave-like”. Not all physicists are satisfied with QBism, and it might not be the only such approach to characterizing quantum phenomena. But any alternative to QBism will have to help us see what’s really puzzling about quantum mechanics without us getting stuck on past characterizations of the puzzles. If such an attempt succeeds, we’re truly on the threshold of quantum 2.0.
Robert P Crease (click link below for full bio) is chair of the Department of Philosophy, Stony Brook University, US. Jennifer Carter is a lecturer in philosophy at Stony Brook, where Gino Elia is a PhD student