Uncovering the tiny defects that make materials fail

Materials make up the world around us. They are everywhere, from the wood, plastics and ceramics in our homes, to the metals and concrete used to construct buildings and bridges. But over time, materials can degrade, their structure changes, they become less reliable and sometimes they even fail altogether – with catastrophic consequences.

One big challenge with engineering materials such as steel is therefore to ensure they last as long as possible. That means finding ways to counteract “materials degradation” processes such as fatigue from cyclic stresses; creep (slow deformation) caused by mechanical stress at high temperatures; wear and tear from components rubbing against each other; and corrosion triggered by chemicals in the environment including water, salts and aggressive gases.

Degradation can build subtly until the entire structure suddenly fails

Understanding the way materials change during these processes can be challenging, as the underlying mechanisms often occur at the atomic level. Slight movements or reactions of individual atoms are imperceptible to the human senses, but when multiplied across billions or trillions of atoms, they build up into dramatic changes in the material. These alterations may occur at small levels for years before a noticeable change is observed in a component, and degradation can build subtly until the entire structure suddenly fails.

Imperfect crystals

Many important materials, such as metals, silicon or diamond, are crystals – highly-ordered repeating units of atoms. Their regular lattice formations can produce a myriad of useful properties, such as strength, heat conductivity, electrical conductivity and optical transparency. While these properties are hugely important for applications and are optimized by a perfect crystal structure, it is the deviations from perfection that are key in materials degradation.

1 Flaws in perfection
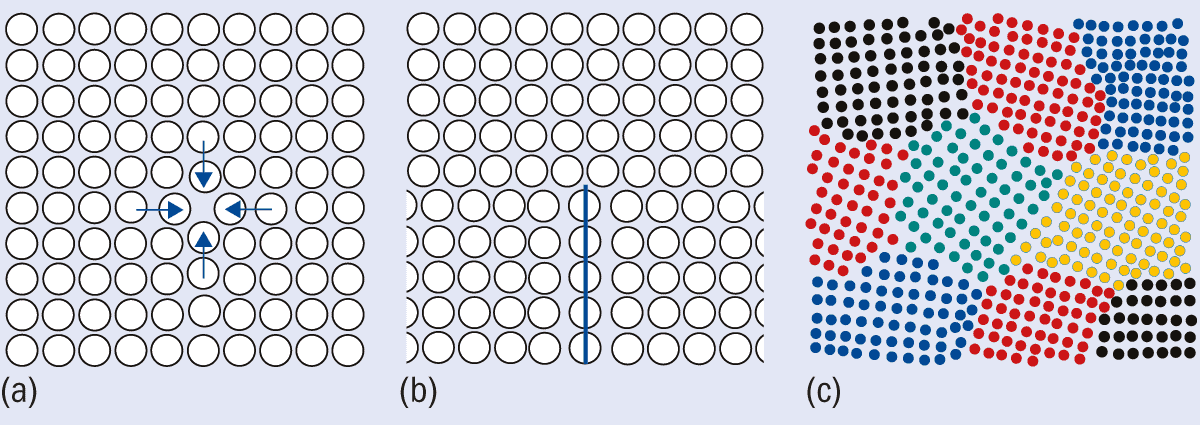
Illustration of defects in a crystal lattice

These “defects” can take many forms, the simplest case being a missing atom – or vacancy – in the repeated lattice (figure 1). More complex long-range defects include dislocations, where whole lines or spirals of atoms can be out of place. There are also grain boundaries, where regions of crystal that formed at different angles meet, which can leave a line of atoms with misaligned bonds. The inclusion of additional chemical elements to a material can complicate its structure even more. New phases known as precipitates can form, and as these are likely to have different structures to the bulk crystal, they introduce areas with different properties.

When a defect experiences external influences, such as stress force, a change in temperature or even a chemical attack, many complex and interesting interactions can occur. The atoms at defects don’t have the same bond structure as those in the main crystal, and can be missing bonds entirely. This means the defects are easier to move under stress, and can more readily react with other chemical elements to form new bonds.

Understanding how a simple defect is affected by a single degradation mechanism such as increased stress, temperature or chemical reaction can be relatively straightforward. But a component in a bridge, aircraft, or nuclear reactor might have billions of such interactions occurring in complex environments. Uncovering how these individual microscopic processes combine into complicated macroscopic changes across a component is hugely challenging, but innovative tools and approaches are now enabling materials scientists to study these degradation problems in new ways.

In particular, the rise of high-speed microscopes lets us characterize atomic-scale defects faster and over larger areas than ever before. Meanwhile, techniques such as machine learning, image recognition, and data processing means we can study bigger datasets. Taken together, we are obtaining new, atomic-level insights into how materials degrade, which in turn is letting us make better predictions of how materials might ultimately fail.

Stress corrosion cracking

2 Cracks in steel
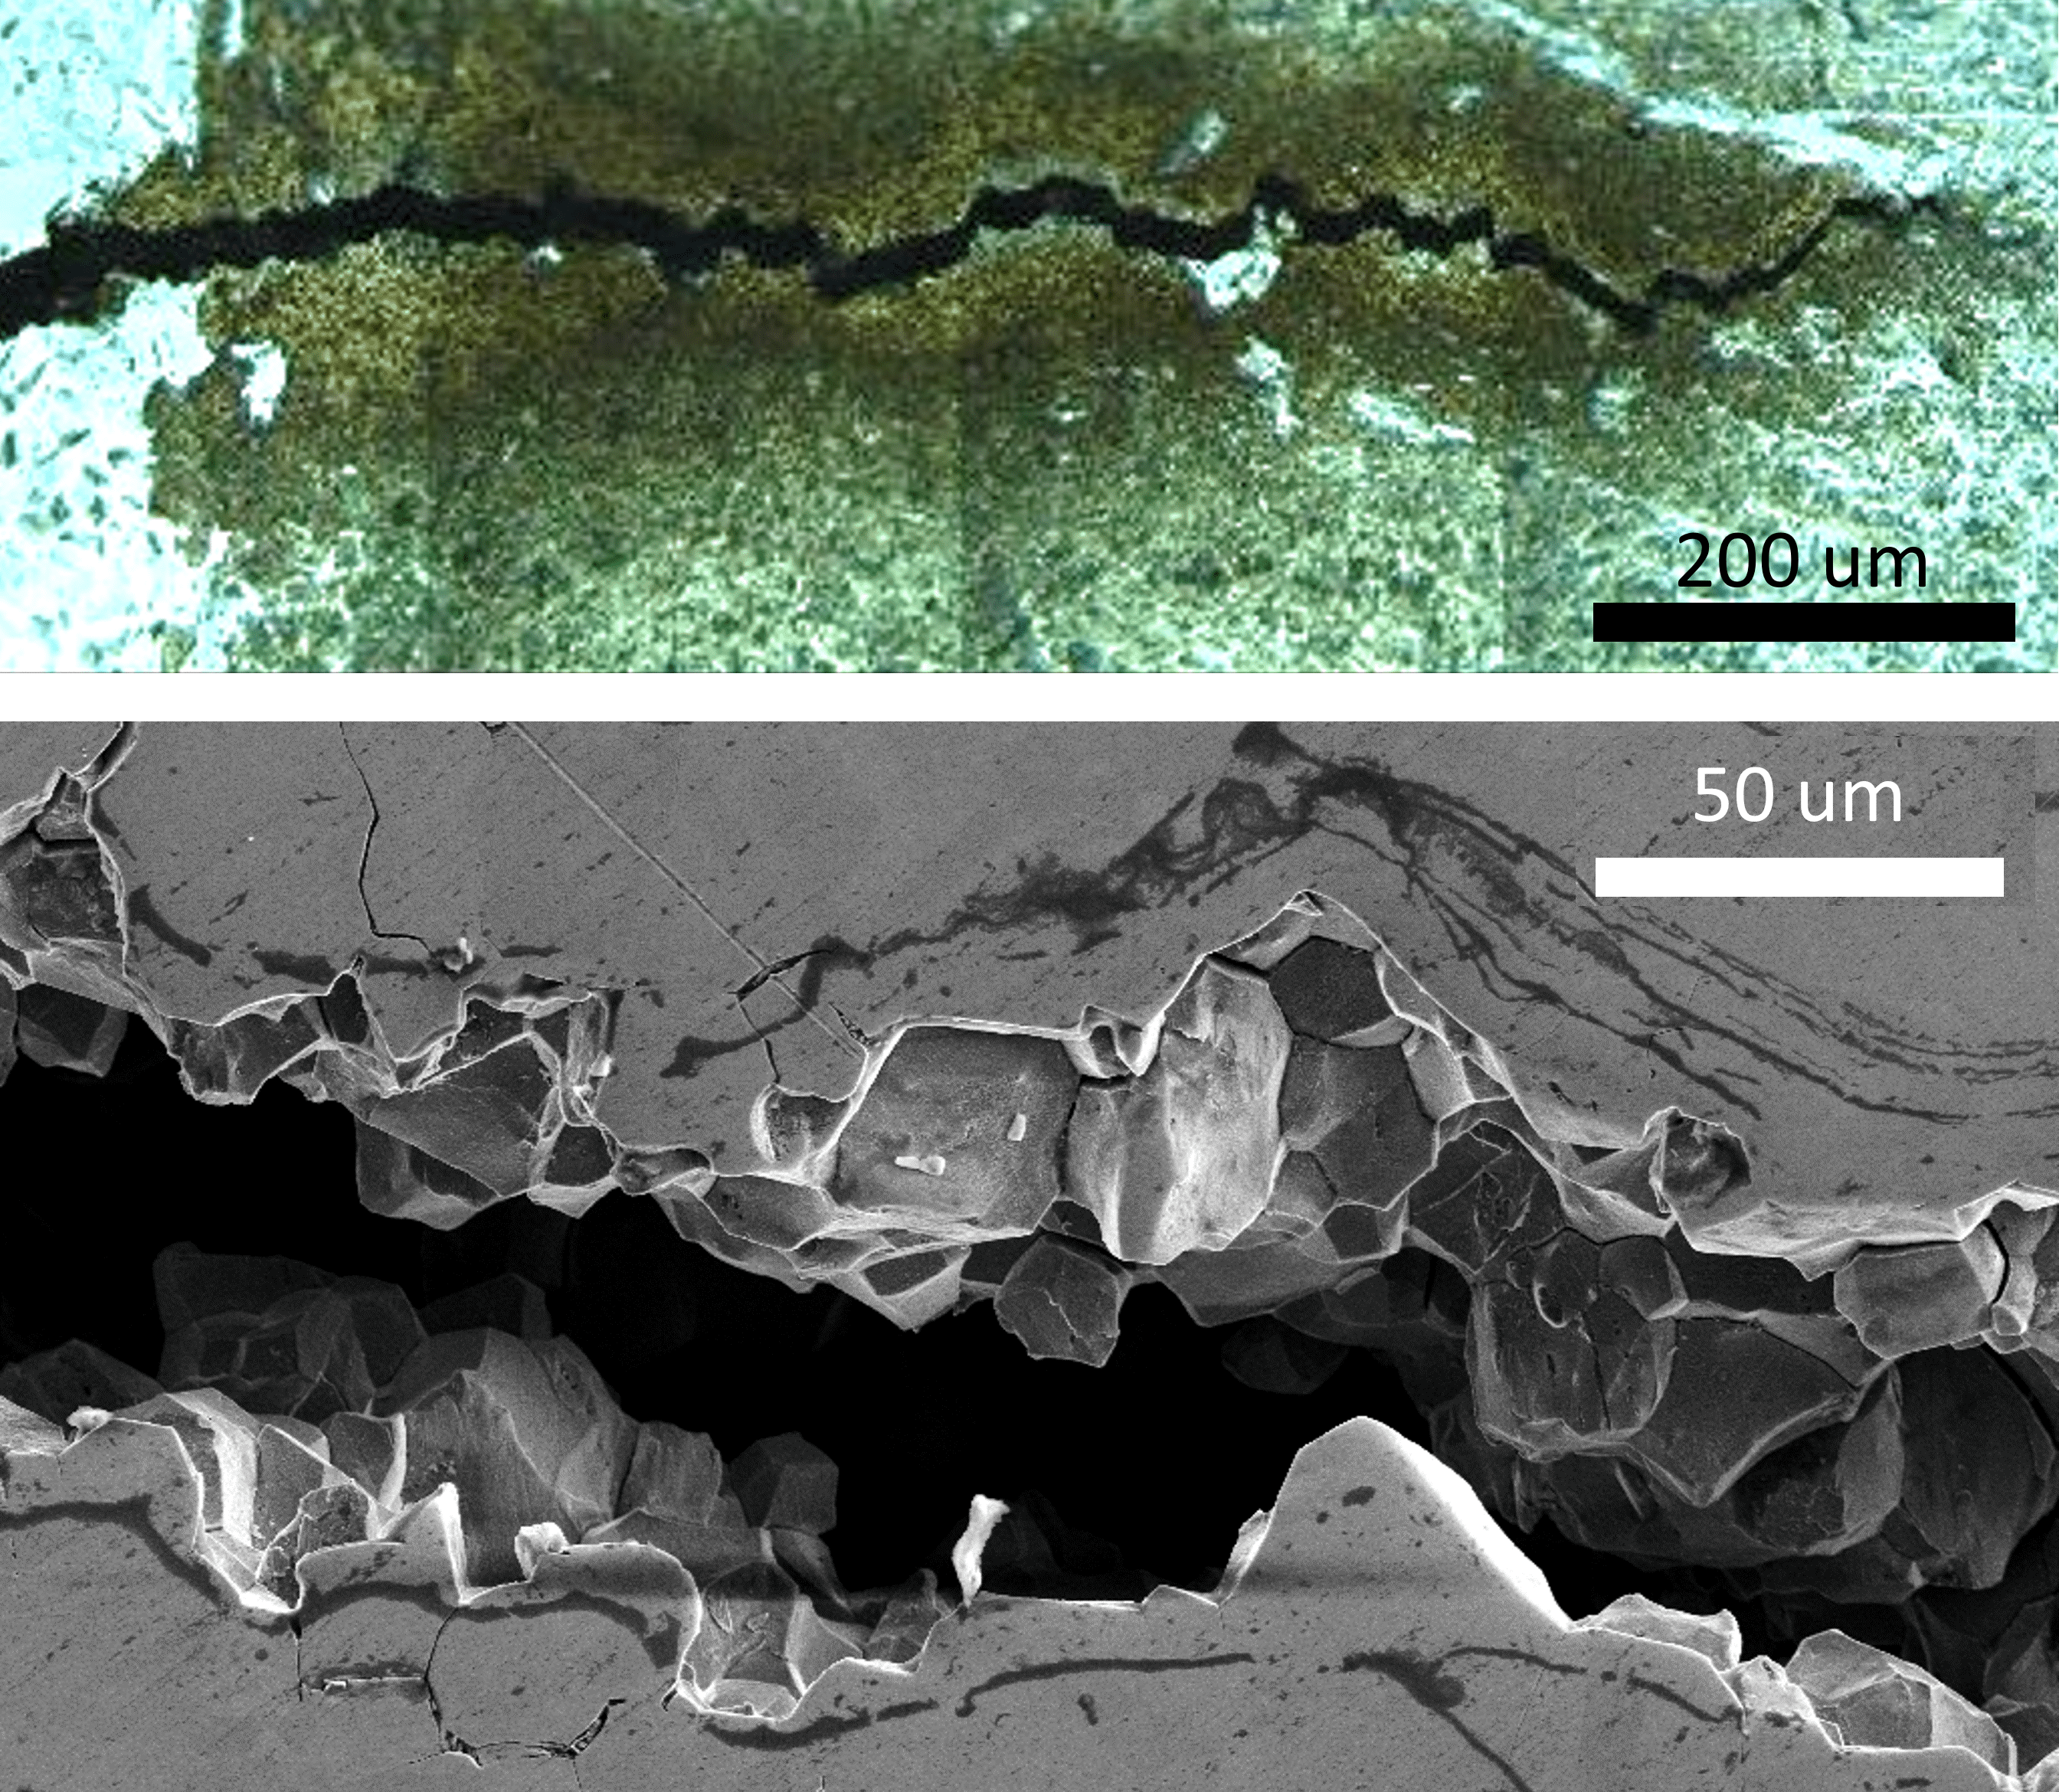
Stress corrosion cracks in steel

One particularly complex way in which materials degrade is “stress corrosion cracking” (SCC). It occurs in metals when a susceptible material experiences a high stress in a corrosive environment, with the combination of these three factors ultimately leading to sudden and unexpected cracking. SCC can happen at both high temperatures – for example, in aircraft engines, and coolant circuits in nuclear reactors – and low temperatures, such as with offshore wind or oil platforms. It is particularly prevalent where salt is present, putting materials out at sea especially at risk. The end result can be catastrophic failure – boats sink, engines fail, bridges collapse, and gas pipelines explode.

In order to fully understand this unique failure process, we need to work out how it starts. However, this is very difficult to do as the event occurs at random times, and if a crack has already begun, the origins of the process are probably hidden by the damage created.

To tackle the problem, our team at the University of Bristol is using multiple microscopy methods to watch cracks as they expand in real time. One method that’s turned out to be particularly useful for analysing small-scale variations in microstructural surface features is high-speed atomic force microscopy (HS-AFM) (see box).

High-speed atomic force microscopy (HS-AFM)

As with a conventional atomic force microscope (AFM), HS-AFM produces topographic images of a surface by monitoring the movement of a tiny (10 nm) sharp probe on the end of a cantilever beam as it traces its way over the sample. When this tip encounters bumps or pits, it is deflected upwards or downwards, respectively – much like the needle in a vinyl record player or a fingertip across braille. The detection system measures this motion and builds up a map of the surface pixel by pixel.

The key difference between HS-AFM and conventional AFM is that it’s much faster. An AFM can typically scan a 5 µm by 5 µm area in over the duration of a few minutes, while a HS-AFM can measure the same area in less than a second. This enhanced speed means entirely new experiments can be performed. For example, using HS-AFM you can analyse the spatial distribution of nanoscale features, such as precipitates, over millimetre, or even centimetre scales in a matter of hours – a feat that would take a standard AFM years to do. This type of characterization is key for understanding nanoscale variation because it is these small changes in structure or composition that lead to large-scale changes in material properties, such as strength, hardness, or ductility.

The HS-AFM can also image in liquid or gaseous environments, allowing for in situ, real-time analysis of the nanoscale changes occurring during processes such as corrosion. This combination of capabilities, alongside the instrument’s high throughput, is unique to HS-AFM, letting us carry out novel and exciting experiments into various nanoscale phenomena.

HS-AFM is ideal for studying SCC because experiments can take place in a liquid, and the degradation can be observed in real-time. Our team therefore designed a bending apparatus that can hold a sample under tensile stress within a corrosive liquid environment – and were able to conduct the first experiment of its kind (npj Materials Degradation 5 3).

The material we tested was a sample of stainless steel that had been heat treated to make the microstructure more susceptible to SCC – the heat changes the size of grains and presence of precipitates, and it also moves chemical elements around and makes the grain boundaries more vulnerable to chemical attack. Tensile stress, i.e. stress that acts to pull the sample apart, was applied to the steel via a three-point bend rig (figure 3). At the same time, the sample was held in a corrosive liquid environment of 395 ppm sodium thiosulfate, which is often found in oil and gas pipelines.

These conditions are particularly relevant within nuclear applications, and are known to induce intergranular SCC – where the crack forms along the grain boundaries rather than through the grain. Measurements by HS-AFM were therefore concentrated along the grain boundaries of the material, in order to observe the processes before and during SCC.

With some skill, some luck, and a whole lot of patience, we were able to perform in situ and real-time observations of SCC

Many attempts are often required to successfully image SCC, as there is little way of predicting which grain boundaries the crack will initiate at and which it will progress along. With some skill, some luck, and a whole lot of patience, we were able to perform in-situ and real-time observations of SCC as the crack progressed along a grain boundary, as shown in figure 3. This measurement gave new insight into cracking behaviour, revealing the way the grains parted. Rather than simply pulling apart in plane, the crack also caused one grain to lift as the crack progressed, producing a shearing motion. This behaviour was found to be the result of sub-surface crack propagation, causing movement of the grains at the sample surface.

3 Stress corrosion cracking in real time
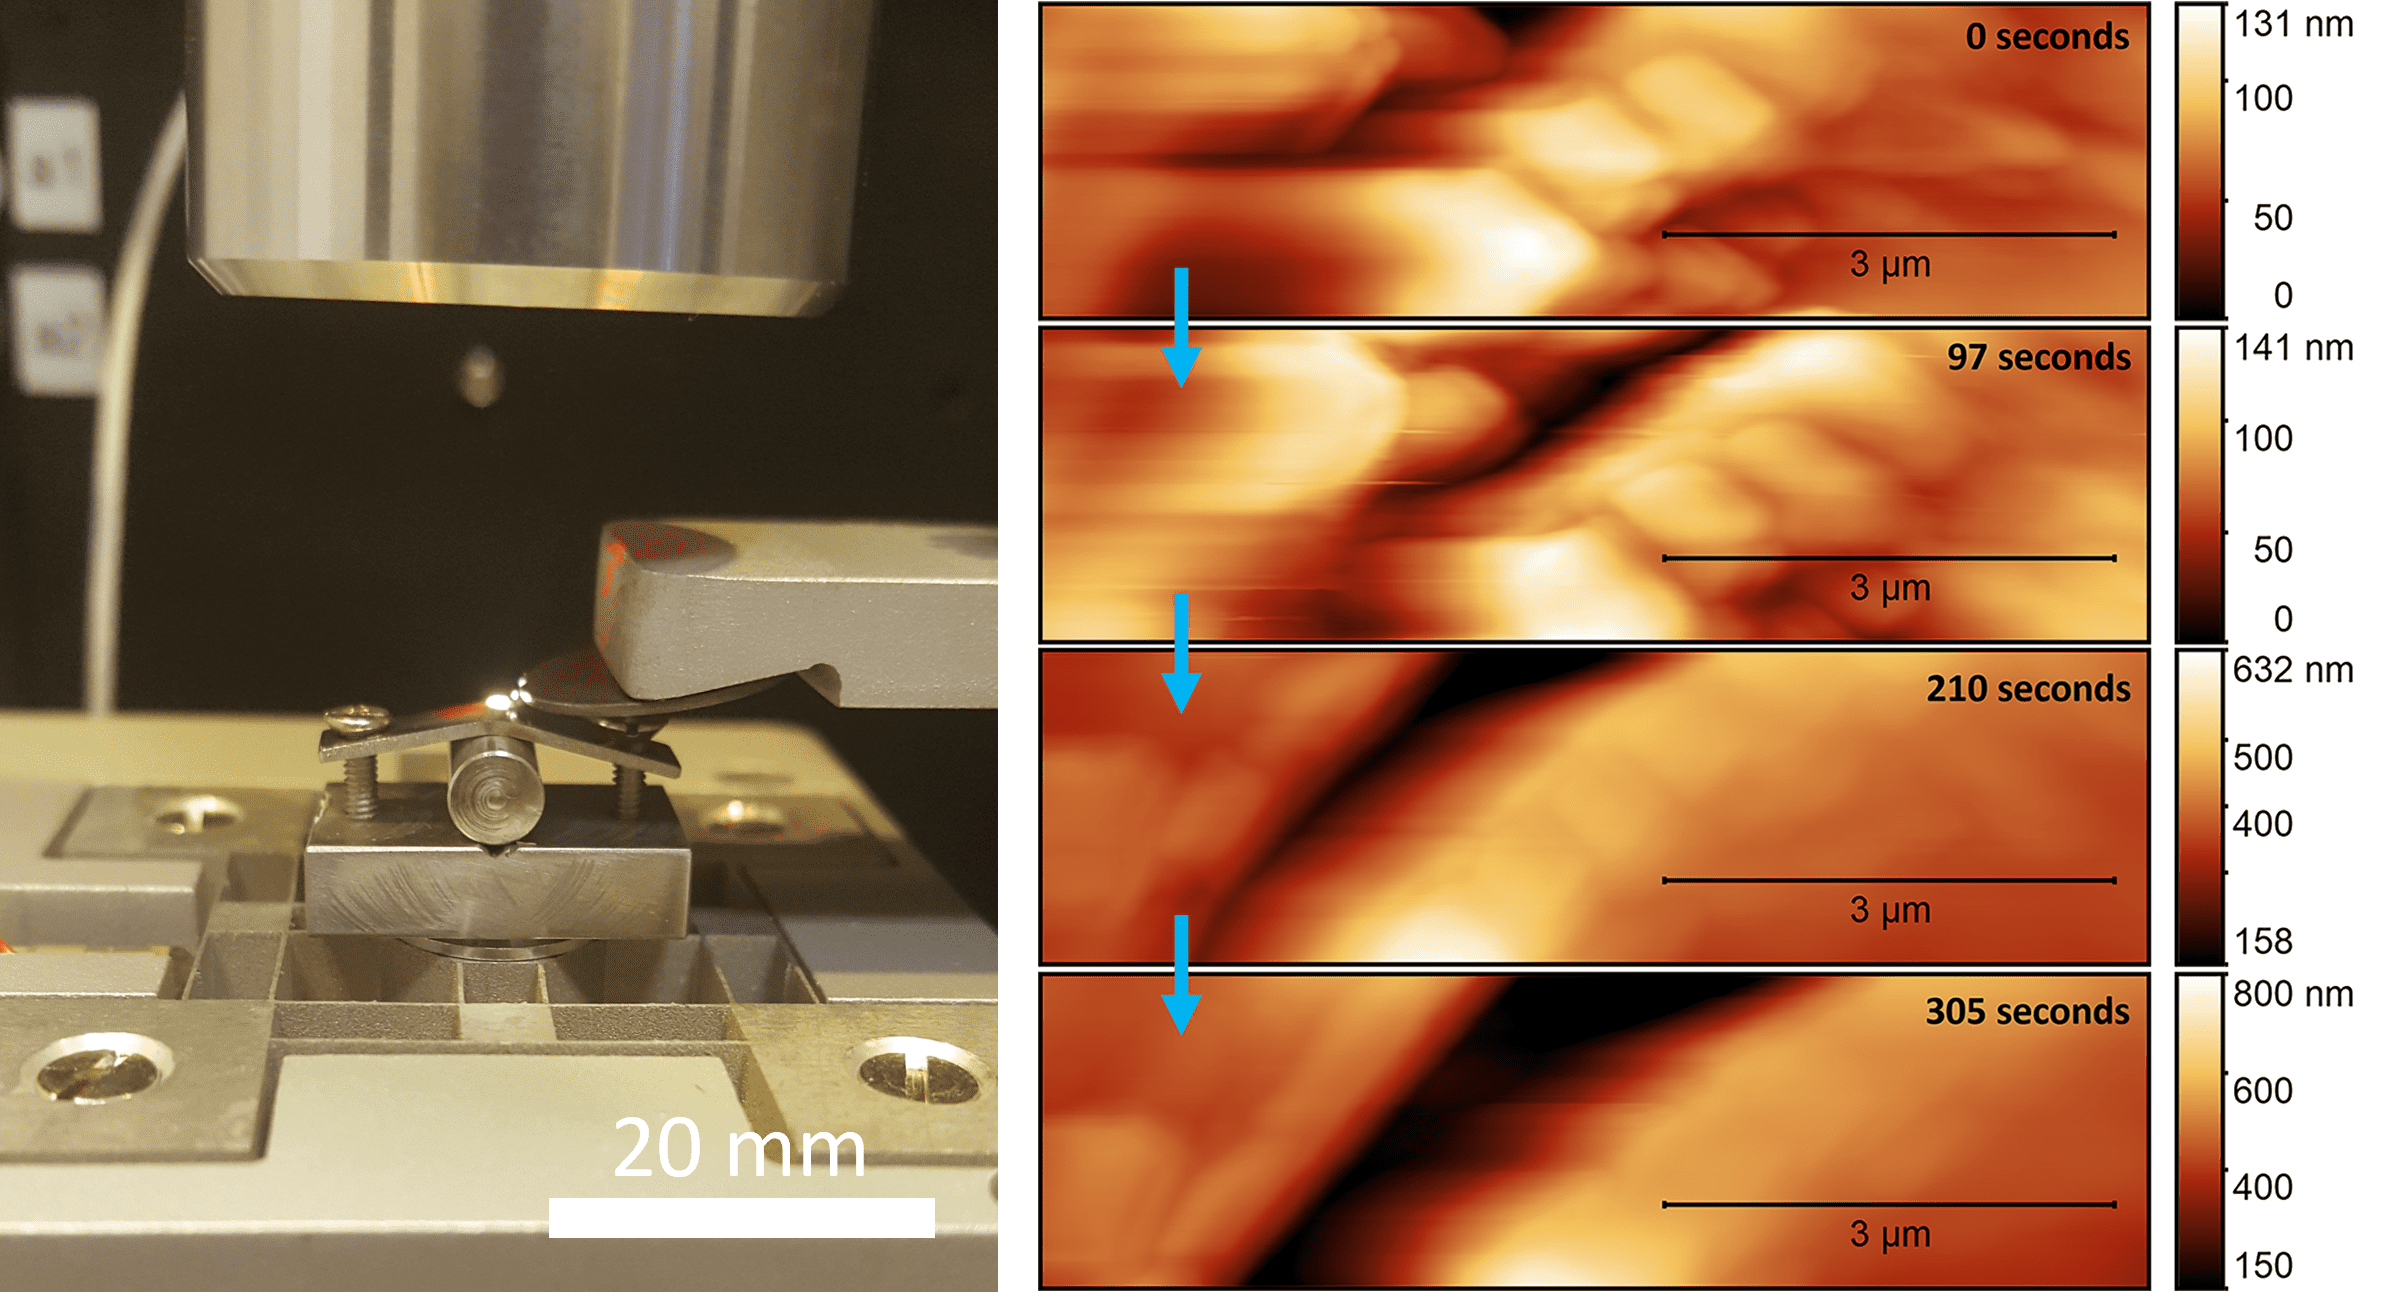
The ability to take high-resolution topographic images of the crack propagation is especially useful, as it helps improve computational models of SCC. This information is powerful – by knowing which part of the material’s structure is attacked by SCC, we can help to design coatings and new materials to protect against attack and make components last longer. However, the picture is incomplete, and often we need complementary techniques to conclude the story.

Complementary analysis

Corrosion processes, such as SCC, are complex systems consisting of both physical and electrochemical changes. New techniques, like HS-AFM, enable researchers to unlock additional insights into such mechanisms, but to gain full understanding of a material’s behaviour often one technique is not sufficient on its own. Multiple complementary techniques are required, allowing for measurement of surface and sub-surface processes, chemical changes, and electrical signals across different length and timescales.

4 Finding the right combination
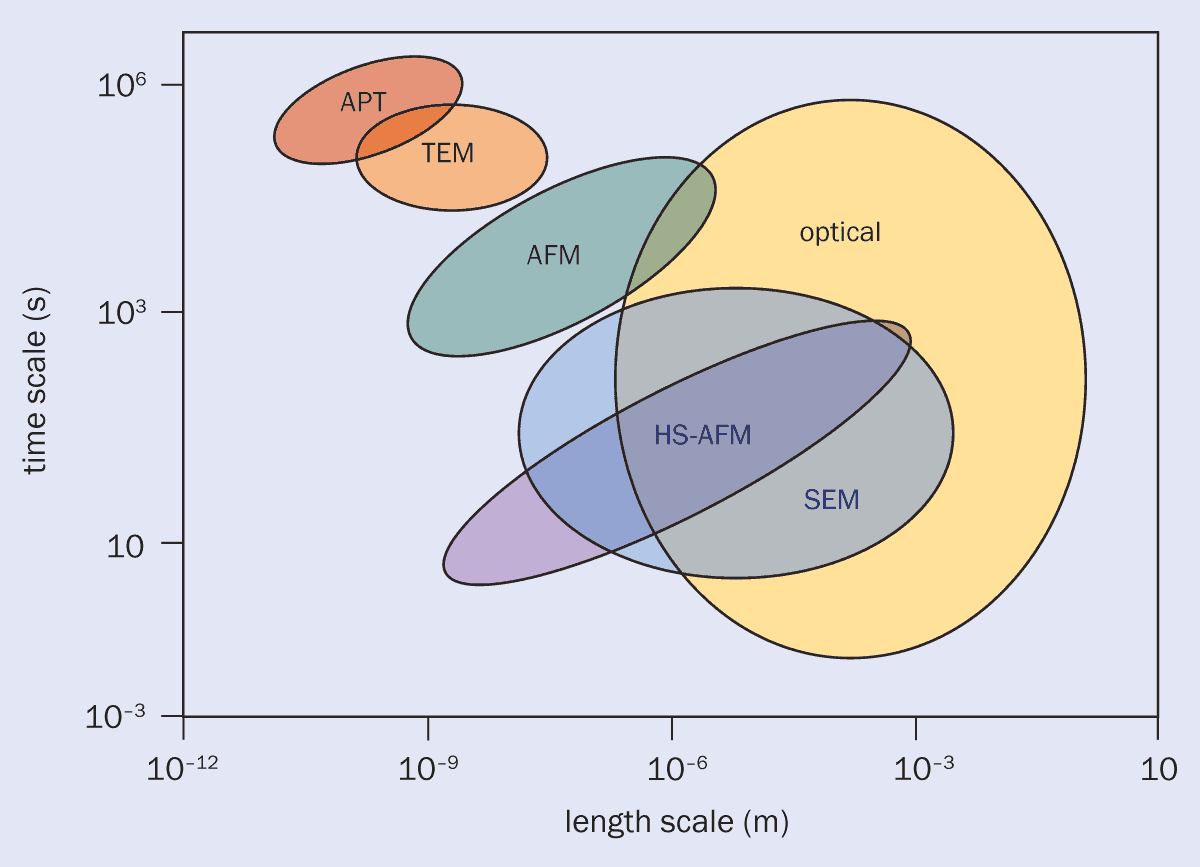
Graph of different analysis techniques

Table showing different analysis techniques

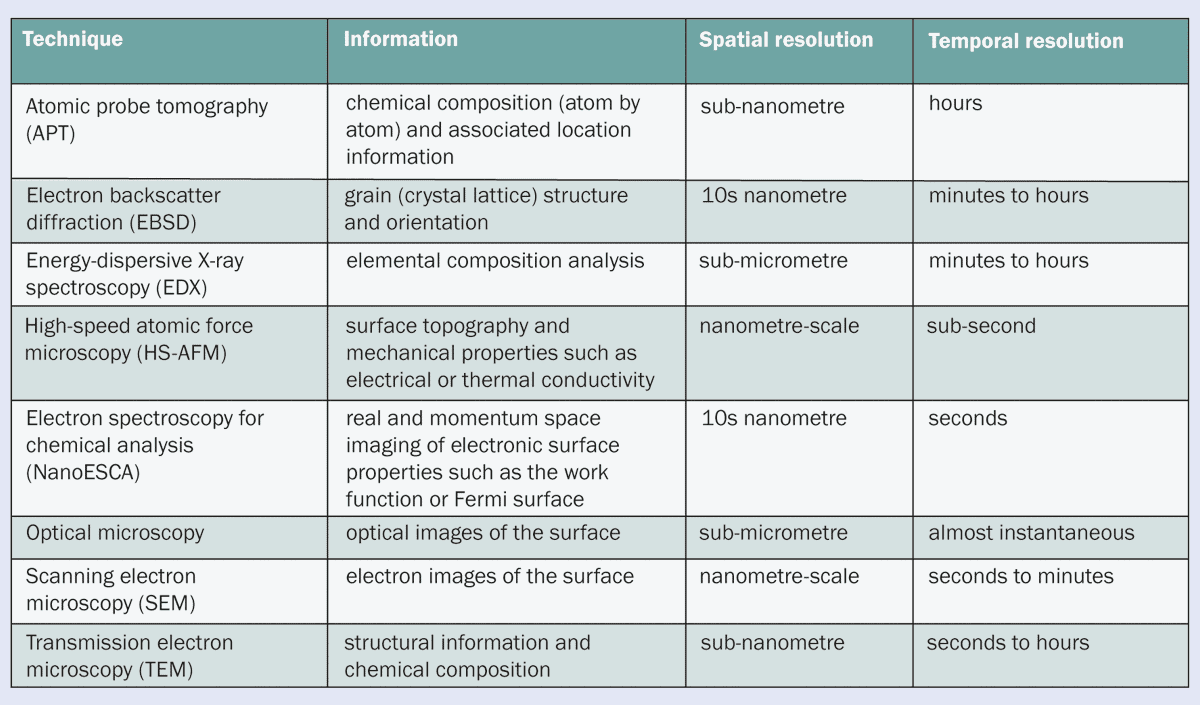
There are many techniques that can be used together to unlock different information about a material (figure 4). For example, electron backscatter diffraction (EBSD) in a scanning electron microscope (SEM) or diffraction in a transmission electron microscope (TEM) can tell us about the relative angles of the crystal lattice within different regions (or grains) of a material (figure 5). This gives insights into the local stresses at a crack, and why a particular region of a material may be vulnerable to attack first.

5 Grains of many colours
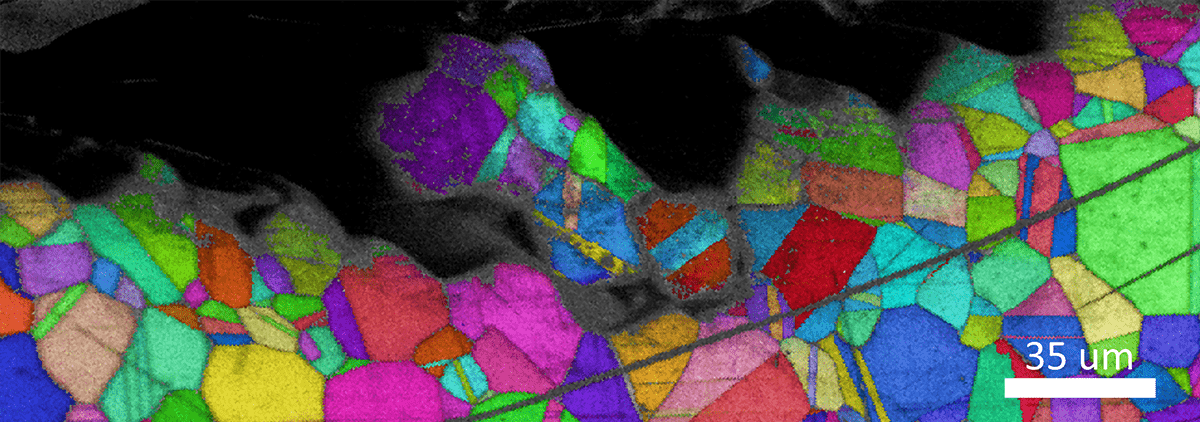
Electron backscatter diffraction (EBSD) of a crack edge

Techniques such as energy-dispersive X-ray spectroscopy (EDX) on both TEM and SEM, as well as atom probe tomography (APT) yield information about the elemental composition of a specimen, providing clues about the chemical changes that occur when corrosive reactions take place. X-ray and ultraviolet photoemission spectroscopy using an electron spectroscopy for chemical analysis (NanoESCA) instrument can give incredible information about the local electronic environment at a sample surface. It can tell us, for instance, about how likely different regions of a material are to lose an electron, and therefore why they might be more vulnerable to corrosion.

Each of these advanced microscopy techniques has its own strengths and can give information for different length scales of a material, from the scale of millimetres down to individual atoms. Using the right mix of techniques, scientists can bring together unparalleled insights into the structure, chemistry, local stress and chemical environment so that we can unpick the origins of failure at new levels of detail.

Ultrahigh-field MRI reveals brain changes in migraine sufferers

A research team headed up at Keck School of Medicine of USC is using ultrahigh-field MRI to investigate the relationship between migraine and microvascular changes in the brain. The researchers have identified, for the first time, that migraine sufferers exhibit enlarged perivascular spaces – fluid-filled spaces surrounding blood vessels – in their brains. Study co-author Wilson Xu reported their findings at this week’s RSNA 2022, the annual meeting of the Radiological Society of North America.

Migraine is a common condition characterized by a severe recurring headache, often accompanied by nausea, weakness and light sensitivity. Xu and colleagues used 7T MRI to study microvascular changes in the brain due to different types of migraine. They note that because ultrahigh-field MRI can create images with higher resolution and better quality than other types of MR scan, it can reveal brain tissue changes after a migraine in more detail.

“In people with chronic migraine and episodic migraine without aura, there are significant changes in the perivascular spaces of a brain region called the centrum semiovale. These changes have never been reported before,” explains Xu. “Perivascular spaces are part of a fluid clearance system in the brain. Studying how they contribute to migraine could help us better understand the complexities of how migraines occur.”

The researchers performed a series of 7T MRI exams – T1, T2, FLAIR and SWI/QSM sequences – on 10 participants with chronic migraine, 10 with episodic migraine without aura and five age-matched healthy controls. They used the MR data to calculate the size of perivascular spaces in the centrum semiovale (the central area of white matter) and basal ganglia (a group of structures primarily responsible for motor control) of the brain.

Preliminary statistical analysis revealed that the number of enlarged perivascular spaces in the centrum semiovale, but not in the basal ganglia, was significantly higher in patients with either type of migraine than in healthy controls.

The team also measured cerebral microbleeds and white matter hyperintensities – lesions in the brain that appear as areas of increased brightness on MRI. There were no significant differences in the frequency of microbleeds or hyperintensities between patients with or without migraine. Migraine patients, however, showed a significant correlation between the presence of enlarged perivascular spaces and the severity of white matter lesions.

The researchers plan to continue their study with larger populations and ongoing follow-up, with the aim of better understanding the relationship between structural changes and migraine development and type.

“The results of our study could help inspire future, larger-scale studies to continue investigating how changes in the brain’s microscopic vessels and blood supply contribute to different migraine types,” Xu says. “Eventually, this could help us develop new, personalized ways to diagnose and treat migraine.”

Möbius strip for light could give optical technologies a boost

A Möbius strip for light has been created by researchers in the US. Light moving around the ring-shaped microresonator only returns to its original configuration after doing two loops of the device. Described as a first, the device was designed and built by Xiyuan Lu at the National Institute of Standards and Technology in Maryland and colleagues – and it could be used to create new optical technologies.

The Möbius strip is a unique topological structure that can be created by putting a single twist into a strip of paper and then gluing both ends together to create a loop. Drawing a line along the surface of the strip involves going along both sides of the strip before arriving at the starting point – going twice around the centre of the loop.

In their study, Lu’s team have shown how the same topology can created for light waves travelling around tiny ring-shaped waveguides (called microresonators) that have whispering gallery modes (WGMs). A whispering gallery is circular or similar structure that reflects sound or light multiple times such that it travels around the gallery and returns to its place of origin. The name originates from the ring-shaped gallery under the dome of St Paul’s Cathedral in London, where a speaker can hear their own voice after it has reflected several times around a circular wall.

Integer values

When a WGM occurs in an optical microresonator, the phase of the electric field associated with the circulating light will complete an integer number of oscillations before returning to the same value when the light returns to the starting point. As a result, the light in the WGM has integer values of angular momentum.

In previous research, Lu and colleagues created a WGM microresonator with and even number of regular teeth-like indentations on the inner side of the ring. This created a photonic crystal, which had the effect of slowing the light’s progression around the ring by a factor of ten. This allowed the team to further manipulate the light.

Notched ring

In their latest study, the researchers created an odd number of notches to a similar ring. Made of silicon nitride, the ring itself was 50 micron in diameter and had 333 notches.  The result is that light circulating in the loop has half-integer values of angular momentum. The 333 notches meant that the angular momentum of the light existed in multiples of 333/2. Furthermore, the light must go around the loop twice before returning to its original electric-field phase. As it follows this path, the orientation of the light wave’s electric field traced out the topological structure of a Möbius strip made from paper.

Lu’s team were able to characterize the modes of light in their microresonator by observing light that scatters out of the ring. For the fundamental mode of the device, one bright spot was observed on the ring. Higher modes were also observed, characterized by odd numbers of spots: three, five, seven and nine. This is unlike their previous microresonator, which had an even number of teeth and had an even number of bright spots.

Describing their work in Physical Review Letters, the researchers say that light with fractional angular momentum generated by their device could find use in a range of applications including sensing and metrology, nonlinear optics, and cavity quantum electrodynamics.

COVID-19 lockdowns boosted astronomy publications but worsened the gender gap, finds study

Astronomers published more papers per year during the COVID-19 pandemic than they did beforehand – but men enjoyed a disproportionate share of the increase. The change, which has widened the gender gap in astronomy, has been revealed in a study carried out by two physicists (Nature Astronomy doi:10.1038/s41550-022-01830-9). They also found that lockdowns may have created barriers for new researchers entering the field.

The analysis was performed by Vanessa Böhm of the University of California, Berkeley, and Jia Liu from the Kavli Institute for the Physics and Mathematics of the Universe in Japan, who examined the public records of astronomy papers published between 1950 and 2022.

When Böhm and Liu focused on the period around the pandemic, analysing the data by gender, career stage and country, they found that astronomy publications increased by 13% since March 2020.

The researchers speculate that this increase in publications could be due to flexible-working and less time spent travelling, enabling scientists to do more focussed work.

Liu cautions, however, that a rise in publications does not necessarily mean a greater impact. “When I discussed our findings with colleagues, some brought up an interesting point – working from home is good for finishing up existing work, but bad for generating new ideas,” she told Physics World, “which I found quite convincing based on my personal experience.”

Unequal distribution

The study revealed that most countries experienced a drop in the number of first-time authors. And while existing researchers increased their yearly publications, the gain was not shared equally. Before the pandemic, women published 8.9 papers for every 10 published by men, but this dropped to 8.8 during COVID-19.

The percentage of women among first-time authors also decreased in 14 out of 25 countries. Indeed, there was no single country where women’s publications kept pace with men’s since 2020, even in places where they had previously been matching or outperforming them, such as Australia, the Netherlands and Switzerland.

This could be due to women shouldering more caring responsibilities during lockdowns, but Böhm warns that the effects might continue even  now that workplaces are re-opening. For example, hybrid workshops could exacerbate the gender gap if it is mostly young mothers choosing to present their work virtually instead of in person.

“The current academic career is designed for researchers who have experienced little discrimination, have minimal family duties, and have maximal flexibility in terms of work schedules and relocating,” Böhm explains. “In our society, these privileges are only enjoyed by a few, and they are usually male.”

To combat this problem, Böhm suggests that those making hiring decisions should identify and remove the barriers that prevent female candidates from applying, being selected or staying in departments. Liu adds that hiring multiple women to leadership positions could also be effective. “This would give women more voice, provide junior members with diverse role models, and form a support system to tackle any new challenges in a systematic way,” she says.

Quantum technology gathers pace

This month’s episode of the Physics World Stories podcast looks in depth at the science behind the 2022 Nobel Prize for Physics and the technologies that are emerging as a result. Alain Aspect, John Clauser and Anton Zeilinger shared this year’s award “for their experiments with entangled photons, establishing the violation of Bell’s inequalities and pioneering quantum information science”.

The first guest is Maksym Sich, co-founder and chief executive of Aegiq, a quantum-photonics spin-out company working on the development of secure quantum data communications and quantum photonics. Aegiq, which received a business start-up award from the Institute of Physics in 2021, has developed a high-performance source of indistinguishable single photons on demand.

“The one thing that is harder than actually doing quantum mechanics is describing it verbally,” says Sich. The quantum entrepreneur gives it a go anyway and neatly explains how quantum technologies emerging today relate to the pioneering experiments of Aspect, Clauser and Zeilinger. Their work helped to demonstrate that entanglement is indeed a quantum phenomenon rather than a classical one.

Later in the episode you will hear from Oscar Kennedy, a quantum engineer from Oxford Quantum Circuits (OQC), a start-up based in Reading, UK. OQC has developed a chip based on superconducting quantum bits “qubits”, which is billed as the UK’s most advanced quantum computer.

In addition to explaining his company’s technology innovations, Kennedy also speaks about what it’s like day-to-day working in quantum computing. Spoiler alert: he loves it. “OQC are hiring all sorts of roles that transcend quantum information because we’re building a world-class company. So if anyone wants to join the quantum revolution, we’re always looking,” he says.

You can discover much more about some of the themes in this episode by visiting the quantum section of the Physics World website, where you can also sign up to our Quantum bimonthly newsletter.

Lung cancer screening dramatically increases long-term survival

Lung cancer is the leading cause of cancer-related death, with a five-year survival rate of only 10–20% in most countries. Early diagnosis is key to improving survival rates, but only 16% of lung cancers are diagnosed at an early stage. New results from a large multicentre, multinational study show that early detection of lung cancer using low-dose CT screening dramatically improves long-term survival.

“While screening doesn’t prevent cancers from occurring, it is an important tool in identifying lung cancers in their early stage when they can be surgically removed,” explains lead author Claudia Henschke from the Icahn School of Medicine at Mount Sinai, who presented the findings this week at RSNA 2022, the annual meeting of the Radiological Society of North America. “Symptoms occur mainly in late-stage lung cancer. Thus, the best way to find early-stage lung cancer is by enrolling in an annual screening programme.”

The lung cancer screening study began back in 1992 with the creation of the International Early Lung Cancer Action Program (I-ELCAP), which has enrolled over 87,000 participants from over 80 institutions to date.

The researchers have now reported the 20-year follow-up data for participants in the screening programme who were later diagnosed with lung cancer and subsequently treated.

For the 1285 I-ELCAP participants diagnosed with early-stage lung cancer, the 20-year survival rate was 80%. For the 991 patients with solid nodules, the survival rate was 73%, while for those with non-solid cancerous lung nodules or partly solid nodules, it was 100%. For participants with clinical Stage IA lung tumours, the 20-year survival rate was 86%, regardless of consistency, and for those with Stage IA tumours measuring 10 mm or less, it was 92%.

The results show that after 20 years, patients diagnosed with lung cancer at an early stage have significantly better outcomes. The researchers note that their findings confirm previous 10-year estimates of lung cancer survival rates and provide evidence of the high curability of lung cancer diagnosed by screening.

“The key finding is that even after this long a time interval they are not dying of their lung cancer,” says Henschke. “And even if new lung cancers were found over time, as long as they continued with annual screening, they would be OK.”

Sugar offers a sweet solution for patterning curvy microelectronics

Refined sugar may be bad for our teeth and waistlines, but a researcher at NIST in the US has used the calorific foodstuff to create a biologically friendly process that could be used for making curved microelectronics. Using a technique that he discovered by accident, Gary Zabow encapsulated flat patterns of tiny particles within solid sugar and then transferred the patterns to curved surfaces.

Today’s microelectronics are made by integrating large numbers of devices within flat chips – a technique that has been perfected over many years and involves complex printing processes. However, there is a growing desire to create microelectronics with curved or flexible shapes that would be suitable for medical or biological applications. Printing patterns directly on curved surfaces is a tricky business, so researchers have developed ways of transferring patterns from flat to curved surfaces. However, these methods often involve the use of chemicals that are not appropriate for making biomedical devices. Other techniques involve floating patterns on water, but these come with different challenges.

Candied magnets

Working in Boulder, Colorado, Zabow came up with the idea of using sugar when he had to send tiny magnetic particles to colleagues in a biomedical lab. He encapsulated an array of the particles in solid sugar. He then melted one of the chunks at the bottom of a beaker and then dissolved the sugar away using water. He had expected the particles to leave the beaker with the sugar solution, but much to his delight, the pattern remained, stuck to the bottom of the beaker.

This led to the development of a new transfer technique that begins with dissolving sugar in water and corn syrup – the latter being important because it prevents the solid sugar from crystallizing, which is detrimental to the transfer process. The solution is poured over a pattern of tiny particles on a flat substrate and allowed to harden. The solid sugar and the pattern are then lifted and placed onto the target substrate. The sugar is heated gently, causing it to flow into the contours of the target substrate. Then the sugar is dissolved with water, leaving the pattern behind.

Zabow tested the process on a number of different target substrates including metal, plastic, semiconductor and several different biological surfaces. He even managed to transfer a pattern onto the sharp point of a pin. To honour the lab where the work was done, he also transferred “NIST” in gold lettering onto a strand of human hair (see figure).

The research is described in Science.

Red supergiant stars get dimmer before they explode

Massive stars in their “red supergiant” phase become around 100 times fainter in the visible part of the electromagnetic spectrum in the last few months before they collapse and explode as a supernova. This is the finding of researchers from Liverpool John Moores University in the UK and the University of Montpelier in France, who simulated what a massive star would look like just before it blows up and when it is nestled in its pre-explosion “cocoon”. The work could help astrophysicists figure out what causes these stars to explode, as well as enabling astronomers to catch the explosion in action.

Massive stars are defined as those that are eight to 20 times heavier than the Sun. In the last phase of their lives, such stars expand and cool to become red supergiants (RSGs). According to recent observations, most pre-RSG stars may be enshrouded in large amounts of circumstellar material (CSM), and this material may then be ejected by the star in the run-up to going supernova. It is unclear, however, over what timescale the CSM would accumulate. Would it form over several decades thanks to a so-called “superwind”? Or would it take less than a year via a brief outburst?

Simulating the visible spectra for pre-explosion RSGs

To shed light on this mystery, researchers led by Ben Davies of Liverpool John Moores simulated the visible spectra for RSGs just before they blow up and when they are surrounded by the pre-explosion CSM. They found that these stars should be barely visible shortly before they explode because the CSM absorbs virtually all light at visible wavelengths. “The dense CSM almost completely obscures the star, making it 100 times fainter in the visible part of the electromagnetic spectrum,” Davies explains. “This means that the day before the star explodes, it would be almost undetectable.”

Telescope archives are full of images that randomly contain massive stars that have since gone supernova, he adds. For example, researchers surveying a nearby galaxy for old stars could have accidentally imaged a RSG that then went on to explode a few years later. In these pre-explosion images, the soon-to-be-dead stars look big and bright, as massive stars always do, which means they cannot yet have built up the predicted circumstellar cocoon.

“This tells us that in the last years of the star’s life, it goes from being very bright to virtually invisible in a matter of months,” he tells Physics World. “This is the signature that the supernova is imminent and suggests that the cocoon is built up in less than a year, which is very fast.”

Superwind model can be excluded

The result also means that the superwind model can be excluded, he says, since in this case, RSGs would be obscured for decades before they explode.

The new work, which is detailed in Monthly Notices of the Royal Astronomical Society, could help optimize how future facilities like the Vera Rubin Observatory, which is due to come online in the next few years, search for massive stars. “Such programmes will survey a huge fraction of the sky every few nights and so monitor billions of stars, including thousands of RSGs,” Davies explains. “If one of these RSGs starts to dramatically dim, we could trigger an alert to start observing the star more carefully. This will be the first step in figuring out what causes these pre-explosion outbursts.”

Physics Advent calendar, singing the praises of a student association, low-cost triboelectric generator

For most Christians, Sunday the 27th of November marks the first day of Advent – which runs until Christmas Eve. Although many traditions have been linked to Advent through the ages, one that has endured into the 21st century is the Advent calendar. Today, this is essentially a daily dispenser of treats such as chocolates, whisky miniatures or cosmetic samples that are hidden behind doors that are usually labelled from 1–24 December.

If you consider physics a treat, then Germany’s University of Göttingen has just the Advent calendar for you. For 10 years now, physicists there have been celebrating Physics in Advent, which delivers a daily video that describes a physics experiment that can be carried out using household materials.

If you sign-up to be sent the videos, you will be invited to answer a question about the experiment. The answer will be revealed the next day and participants will gain points for giving correct answers. Those with the highest scores will be entered into a draw for prizes such as a ride in a hot air balloon; a flight in a glider; or a trip to Dallas, Texas to see an NBA basketball game.

Fun for all ages

You can enter as an individual, a school class or an entire school. While the programme is aimed at children age 11–18, everyone is welcome to have a go. English and German versions of the calendar are available, as are French, Italian and Ukrainian subtitles.

You can register for Physics in Advent here.

This year is the 35th anniversary of the International Association of Physics Students (IAPS). This represents physics students and student societies from around the world and includes more than 90,000 students.

IAPS organizes activities such as conferences, talks, workshops as well as social and outreach events. Next year, the association’s annual conference – the International Conference for Students of Physics – will be held in Baguio and Manila in the Philippines.

To mark the 35th anniversary, the association created a history of the IAPS group, which has recorded a celebration song. Performed in English, it features lines such as “We have grown to a standing of high renown, with ICPS as the jewel in our crown” and “Onwards, forwards into the years to come, international physicists joined as one”.  

The music and arrangement for the song was done by Aleksander Stojcheski and Alexia Beale with lyrics by Beale and Soe Gon Yee Thant, who also did the vocals. You can listen to it here.

Static season

It’s coming to winter here in the northern hemisphere, and for those living in cold, dry climates such as the Canadian prairies it is the season of static electricity. Many of us who have experienced a nasty shock touching a metal doorknob after walking on a carpet have probably wondered “could this seemingly unlimited energy source could be harnessed for good?”.

Well, it turns out that scientists have been working on this for decades, developing triboelectric nanogenerators (TENGs). These harvest static electricity that is created by rubbing two surfaces together.

TENGs are usually made using sophisticated equipment, but now Gang Wang and colleagues at the University of Alabama have created a triboelectric generator that is made from two low-cost materials: double-sided sticky tape; and aluminium-coated plastic film.

Described as uncomplicated and easy-to-fabricate, the device can power up to 400 LEDs. Indeed, its output of 169.6 watts per square metre is 47% higher than other devices, the researchers claim. It sounds like a great way to power your Christmas-tree lights if the electricity fails this winter.

The team describe their generator in ACS Omega.


Deep-learning system identifies difficult-to-detect brain metastases

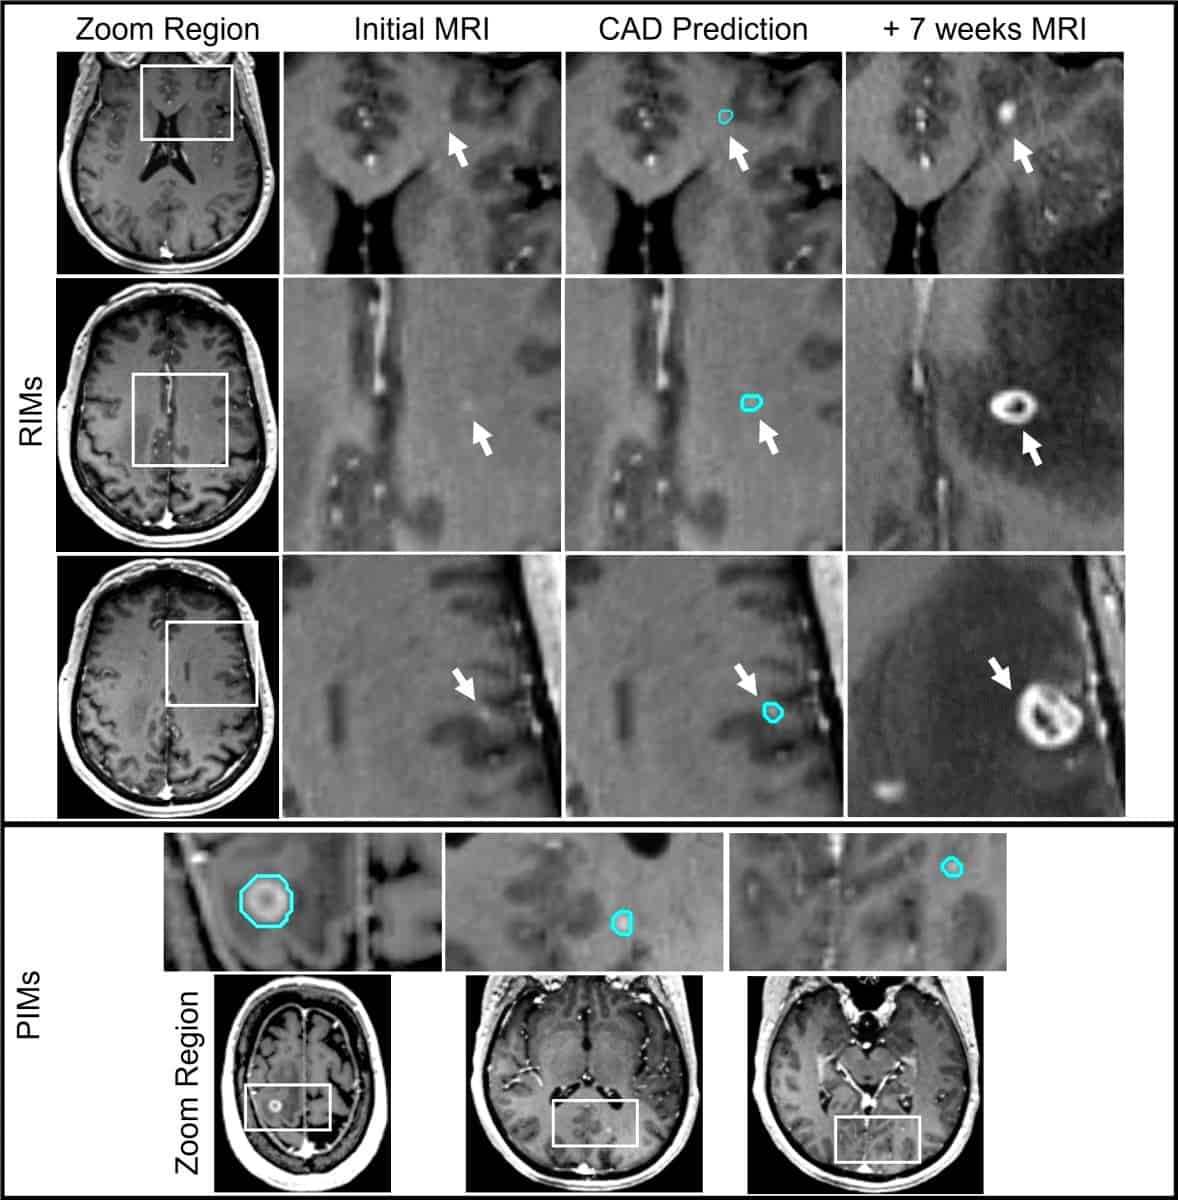
Computer-aided detection of brain metastases

Researchers at Duke University Medical Center have developed a deep-learning-based computer-aided detection (CAD) system to identify difficult-to-detect brain metastases on MR images. The algorithm exhibited excellent sensitivity and specificity, outperforming other CAD systems in development. The tool shows potential to enable earlier identification of emerging brain metastases, allowing them to be targeted with stereotactic radiosurgery (SRS) when they first appear and, for some patients, reducing the number of required treatments.

SRS, which uses precisely focused photon beams to deliver a high dose of radiation to targets in the brain in a single radiotherapy session, is evolving into the standard-of-care treatment for patients with a limited number of brain metastases. To target a metastasis, however, it must first be identified on an MR image. Unfortunately, approximately 10% are not, 30% for those less than 3 mm in size, even when reviewed by expert neuroradiologists.

When these undiscovered brain metastases – which the researchers refer to as retrospectively identified metastases (RIMs) – are identified on subsequent MRI scans, a second SRS treatment is usually needed. Such treatment is expensive, and can be uncomfortable and invasive, sometimes requiring head immobilization with a frame secured to the skull by pins.

At the recent ASTRO Annual Meeting, Devon Godfrey explained that the researchers designed the convolutional neural network (CNN)-based CAD system specifically to improve the detection and segmentation of hard-to-detect RIMs and very small prospectively identified metastases (PIMs). Godfrey and colleagues describe the testing and validation of this system in the International Journal of Radiation Oncology Biology Physics.

The team trained the CAD tool on MRI data (a contrast-enhanced spoiled gradient echo sequence) from 135 patients with 563 brain metastases. The images were acquired using 1.5 T and 3.0 T MRI scanners from different vendors at multiple Duke Health locations. In total, the data set included 491 PIMs with a median diameter of 6.7 mm, and 72 RIMs from 32 patients, with a median diameter of 2.7 mm.

To identify RIMs, the researchers reviewed each patient’s original MR images to search for signs of contrast enhancement in the exact location where a metastasis was later detected. After review, they classified each RIM as either having met imaging-based diagnostic criteria (+DC) or having insufficient visual information (-DC) to be identified as a metastasis.

The researchers randomized the data set of RIMs and PIMs into five groups, using four of these for model and algorithm development and one as a test group. “The inclusion of both +DC and -DC RIMs resulted in the highest sensitivities for every brain metastasis category and size, while also returning the lowest false-positive rate and the highest positive predictive value,” they report. “This shows a clear benefit of including an overweighted sampling of small challenging brain metastases to CAD training data.”

For PIMs and +DC RIMs – which have clear characteristics of metastases on MRI – the model achieved an overall sensitivity of 93%, ranging from 100% for lesions larger than 6 mm in diameter to 79% for those smaller than 3 mm. The false-positive rate was also impressively low, with a mean of 2.7 per person, compared with between eight and 35 in other CAD systems with comparable detection sensitivity for small lesions.

The CAD system was also able to detect some of the -DC RIMs in both the development and test sets. Identification of brain metastases at this earliest stage would be a great clinical advantage, as such lesions could then be more thoroughly monitored with imaging, prompting treatment if required.

The Duke team is now working to improve the CAD tool’s accuracy by utilizing multiple MR sequences. Godfrey explains that brain MRI studies almost always include multiple MR sequences that produce unique information about every voxel in the brain. “We believe that incorporating the additional information available from these other sequences ought to improve its accuracy,” he says.

Godfrey notes that the researchers are just weeks away from launching a simulated prospective clinical use study of the existing CAD system to investigate how the tool impacts clinical decision making by both radiologists and radiation oncologists.

“Multiple expert neuroradiologists and neuro-radiation oncologists who perform SRS will be presented with brain MR scans. They will be asked to find any lesion that might be a brain metastasis, rate their confidence level that it is, and state whether they would treat the lesion with SRS, based upon its appearance in the images,” he tells Physics World. “We will then present them with the CAD predictions and evaluate the impact of CAD on each physician’s clinical decisions.”

If this simulation study yields promising results, Godfrey anticipates deploying the CAD tool to help identify challenging brain metastases prospectively in new patients being treated in the Duke Radiation Oncology clinic under a research protocol, perhaps as soon as mid-year 2023.

Copyright © 2026 by IOP Publishing Ltd and individual contributors