Sound waves can make small objects hover in the air, but applying this acoustic levitation technique to an array of objects is difficult because the objects tend to clump together. Physicists at the Institute of Science and Technology Austria (ISTA) have now overcome this problem thanks to hybrid structures that emerge from the interplay between attractive acoustic forces and repulsive electrostatic ones. By proving that it is possible to levitate many particles while keeping them separated, the finding could pave the way for advances in acoustic-levitation-assisted 3D printing, mid-air chemical synthesis and micro-robotics.
In acoustic levitation, particles ranging in size from tens of microns to millimetres are drawn up into the air and confined by an acoustic force. The origins of this force lie in the momentum that the applied acoustic field transfers to a particle as sound waves scatter off its surface. While the technique works well for single particles, multiple particles tend to aggregate into a single dense object in mid-air because the acoustic forces they scatter can, collectively, create an attractive interaction between them.
Keeping particles separated
Led by Scott Waitukaitis, the ISTA researchers found a way to avoid this so-called “acoustic collapse” by using a tuneable repulsive electrostatic force to counteract the attractive acoustic one. They began by levitating a single silver-coated poly(methyl methacrylate) (PMMA) microsphere 250‒300 µm in diameter above a reflector plate coated with a transparent and conductive layer of indium tin oxide (ITO). They then imbued the particle with a precisely controlled amount of electrical charge by letting it rest on the ITO plate with the acoustic field off, but with a high-voltage DC potential applied between the plate and a transducer. This produces a capacitive build-up of charge on the particle, and the amount of charge can be estimated from Maxwell’s solutions for two contacting conductive spheres (assuming, in the calculations, that the lower plate acts like a sphere with infinite radius).
The next step in the process is to switch on the acoustic field and, after just 10 ms, add the electric field to it. During the short period in which both fields are on, and provided the electric field is strong enough, either field is capable of launching the particle towards the centre of the levitation setup. The electric fields is then switched off. A few seconds later, the particle levitates stably in the trap, with a charge given, in principle, by Maxwell’s approximations.
A visually mesmerizing dance of particles
This charging method works equally well for multiple particles, allowing the researchers to load particles into the trap with high efficiency and virtually any charge they want, limited only by the breakdown voltage of the surrounding air. Indeed, the physicists found they could tune the charge to levitate particles separately or collapse them into a single, dense object. They could even create hybrid states that mix separated and collapsed particles.
And that wasn’t all. According to team member Sue Shi, a PhD student at ISTA and the lead author of a paper in PNAS about the research, the most exciting moment came when they saw the compact parts of the hybrid structures spontaneously begin to rotate, while the expanded parts remained in one place while oscillating in response to the rotation. The result was “a visually mesmerizing dance,” Shi says, adding that “this is the first time that such acoustically and electrostatically coupled interactions have been observed in an acoustically levitated system.”
As well as having applications in areas such as materials science and micro-robotics, Shi says the technique developed in this work could be used to study non-reciprocal effects that lead to the particles rotating or oscillating. “This would pave the way for understanding more elusive and complex non-reciprocal forces and many-body interactions that likely influence the behaviours of our system,” Shi tells Physics World.
Heat travels across a metal by the movement of electrons. However, in an insulator there are no free charge carriers; instead, vibrations in the atoms (phonons) move the heat from hot regions to cool regions in a straight path. In some materials, when a magnetic field is applied, the phonons begin to move sideways, this is known as the Phonon Hall Effect. Quantised collective excitations of the spin structure, called magnons, can also do this via the Magnon Hall Effect. A combined effect occurs when magnons and phonons strongly interact and traverse sideways in the Magnon–Polaron Hall Effect.
Scientists understand the quantum mechanical property known as Berry curvature that causes this transverse heat flow. Yet in some materials, the effect is greater than what Berry curvature alone can explain. In this research, an exceptionally large thermal Hall effect is recorded in MnPS₃, an insulating antiferromagnetic material with strong magnetoelastic coupling and a spin-flop transition. The thermal Hall angle remains large down to 4 K and cannot be accounted for by standard Berry curvature-based models.
This work provides an in-depth analysis of the role of the spin-flop transition in MnPS₃’s thermal properties and highlights the need for new theoretical approaches to understand magnon–phonon coupling and scattering. Materials with large thermal Hall effects could be used to control heat in nanoscale devices such as thermal diodes and transistors.
Topological insulators are materials that are insulating in the bulk within the bandgap, yet exhibit conductive states on their surface at frequencies within that same bandgap. These surface states are topologically protected, meaning they cannot be easily disrupted by local perturbations. In general, a material of n‑dimensions can host n‑1-dimensional topological boundary states. If the symmetry protecting these states is further broken, a bandgap can open between the n-1-dimensional states, enabling the emergence of n-2-dimensional topological states. For example, a 3D material can host 2D protected surface states, and breaking additional symmetry can create a bandgap between these surface states, allowing for protected 1D edge states. A material undergoing such a process is said to exhibit a phenomenon known as a higher-order topological insulator. In general, higher-order topological states appear in dimensions one lower than the parent topological phase due to the further unit-cell symmetry reduction. This requires at least a 2D lattice for second-order states, with the maximal order in 3D systems being three.
The researchers here introduce a new method for repeatedly opening the bandgap between topological states and generating new states within those gaps in an unbounded manner – without breaking symmetries or reducing dimensions. Their approach creates hierarchical topological insulators by repositioning domain walls between different topological regions. This process opens bandgaps between original topological states while preserving symmetry, enabling the formation of new hierarchical states within the gaps. Using one‑ and two‑dimensional Su–Schrieffer–Heeger models, they show that this procedure can be repeated to generate multiple, even infinite, hierarchical levels of topological states, exhibiting fractal-like behavior reminiscent of a Matryoshka doll. These higher-level states are characterized by a generalized winding number that extends conventional topological classification and maintains bulk-edge correspondence across hierarchies.
The researchers confirm the existence of second‑ and third-level domain‑wall and edge states and demonstrate that these states remain robust against perturbations. Their approach is scalable to higher dimensions and applicable not only to quantum systems but also to classical waves such as phononics. This broadens the definition of topological insulators and provides a flexible way to design complex networks of protected states. Such networks could enable advances in electronics, photonics, and phonon‑based quantum information processing, as well as engineered structures for vibration control. The ability to design complex, robust, and tunable hierarchical topological states could lead to new types of waveguides, sensors, and quantum devices that are more fault-tolerant and programmable.
The boundary between a substance’s liquid and solid phases may not be as clear-cut as previously believed. A new state of matter that is a hybrid of both has emerged in research by scientists at the University of Nottingham, UK and the University of Ulm, Germany, and they say the discovery could have applications in catalysis and other thermally-activated processes.
In liquids, atoms move rapidly, sliding over and around each other in a random fashion. In solids, they are fixed in place. The transition between the two states, solidification, occurs when random atomic motion transitions to an ordered crystalline structure.
At least, that’s what we thought. Thanks to a specialist microscopy technique, researchers led by Nottingham’s Andrei Khlobystov found that this simple picture isn’t entirely accurate. In fact, liquid metal nanoparticles can contain stationary atoms – and as the liquid cools, their number and position play a significant role in solidification.
Some atoms remain stationary
The team used a method called spherical and chromatic aberration-corrected high-resolution transmission electron microscopy (Cc/Cs-corrected HRTEM) at the low-voltage SALVE instrument at Ulm to study melted metal nanoparticles (such as platinum, gold and palladium) deposited on an atomically thin layer of graphene. This carbon-based material acted a sort of “hob” for heating the particles, says team member Christopher Leist, who was in charge of the HRTEM experiments. “As they melted, the atoms in the nanoparticles began to move rapidly, as expected,” Leist says. “To our surprise, however, we found that some atoms remained stationary.”
At high temperatures, these static atoms bind strongly to point defects in the graphene support. When the researchers used the electron beam from the transmission microscope to increase the number of these defects, the number of stationary atoms within the liquid increased, too. Khlobystov says that this had a knock-on effect on how the liquid solidified: when the stationary atoms are few in number, a crystal forms directly from the liquid and continues to grow until the entire particle has solidified. When their numbers increase, the crystallization process cannot take place and no crystals form.
“The effect is particularly striking when stationary atoms create a ring (corral) that surrounds and confines the liquid,” he says. “In this unique state, the atoms within the liquid droplet are in motion, while the atoms forming the corral remain motionless, even at temperatures well below the freezing point of the liquid.”
Unprecedented level of detail
The researchers chose to use Cc/Cs-corrected HRTEM in their study because minimizing spherical and chromatic aberrations through specialized hardware installed on the microscope enabled them to resolve single atoms in their images.
“Additionally, we can control both the energy of the electron beam and the sample temperature (the latter using MEMS-heated chip technology),” Khlobystov explains. “As a result, we can study metal samples at temperatures of up to 800 °C, even in a molten state, without sacrificing atomic resolution. We can therefore observe atomic behaviour during crystallization while actively manipulating the environment around the metal particles using the electron beam or by cooling the particles. This level of detail under such extreme conditions is unprecedented.”
Effect could be harnessed for catalysis
The Nottingham-Ulm researchers, who report their work in ACS Nano, say they obtained their results by chance while working on an EPSRC-funded project on 1-2 nm metal particles for catalysis applications. “Our approach involves assembling catalysts from individual metal atoms, utilizing on-surface phenomena to control their assembly and dynamics,” explains Khlobystov. “To gain this control, we needed to investigate the behaviour of metal atoms at varying temperatures and within different local environments on a support material.
“We suspected that the interplay between vacancy defects in the support and the sample temperature creates a powerful mechanism for controlling the size and structure of the metal particles,” he tells Physics World. “Indeed, this study revealed the fundamental mechanisms behind this process with atomic precision.”
The experiments were far from easy, he recalls, with one of the key challenges being to identify a thin, robust and thermally conductive support material for the metal. Happily, graphene meets all these criteria.
“Another significant hurdle to overcome was to be able to control the number of defect sites surrounding each particle,” he adds. “We successfully accomplished this by using the TEM’s electron beam not just as an imaging tool, but also as a means to modify the environment around the particles by creating defects.”
The researchers say they would now like to explore whether the effect can be harnessed for catalysis. To do this, Khlobystov says it will be essential to improve control over defect production and its scale. “We also want to image the corralled particles in a gas environment to understand how the phenomenon is influenced by reaction conditions, since our present measurements were conducted in a vacuum,” he adds.
Rob Farr is a theorist and computer modeller whose career has taken him down an unconventional path. He studied physics at the University of Cambridge, UK, from 1991 to 1994, staying on to do a PhD in statistical physics. But while many of his contemporaries then went into traditional research fields – such as quantum science, high-energy physics and photonic technologies – Farr got a taste for the food and drink manufacturing industry. It’s a multidisciplinary field in which Farr has worked for more than 25 years.
After leaving academia in 1998, first stop was Unilever’s €13bn foods division. For two decades, latterly as a senior scientist, Farr guided R&D teams working across diverse lines of enquiry – “doing the science, doing the modelling”, as he puts it. Along the way, Farr worked on all manner of consumer products including ice-cream, margarine and non-dairy spreads, as well as “dry” goods such as bouillon cubes. There was also the occasional foray into cosmetics, skin creams and other non-food products.
As a theoretical physicist working in industrial-scale food production, Farr’s focus has always been on the materials science of the end-product and how it gets processed. “Put simply,” says Farr, “that means making production as efficient as possible – regarding both energy and materials use – while developing ‘new customer experiences’ in terms of food taste, texture and appearance.”
Ice-cream physics
One tasty multiphysics problem that preoccupied Farr for a good chunk of his time at Unilever is ice cream. It is a hugely complex material that Farr likens to a high-temperature ceramic, in the sense that the crystalline part of it is stored very near to the melting point of ice. “Equally, the non-ice phase contains fats,” he says, “so there’s all sorts of emulsion physics and surface science to take into consideration.”
Ice cream also has polymers in the mix, so theoretical modelling needs to incorporate the complex physics of polymer–polymer phase separation as well as polymer flow, or “rheology”, which contributes to the product’s texture and material properties. “Air is another significant component of ice cream,” adds Farr, “which means it’s a foam as well as an emulsion.”
As well as trying to understand how all these subcomponents interact, there’s also the thorny issue of storage. After it’s produced, ice cream is typically kept at low temperatures of about –25 °C – first in the factory, then in transit and finally in a supermarket freezer. But once that tub of salted-caramel or mint choc chip reaches a consumer’s home, it’s likely to be popped in the ice compartment of a fridge freezer at a much milder –6 or –7 °C.
Manufacturers therefore need to control how those temperature transitions affect the recrystallization of ice. This unwanted outcome can lead to phenomena like “sintering” (which makes a harder product) and “ripening” (which can lead to big ice crystals that can be detected in the mouth and detract from the creamy texture).
“Basically, the whole panoply of soft-matter physics comes into play across the production, transport and storage of ice cream,” says Farr. “Figuring out what sort of materials systems will lead to better storage stability or a more consistent product texture are non-trivial questions given that the global market for ice cream is worth in excess of €100bn annually.”
A shot of coffee?
After almost 20 years working at Unilever, in 2017 Farr took up a role as coffee science expert at JDE Peet’s, the Dutch multinational coffee and tea company. Switching from the chilly depths of ice cream science to the dark arts of coffee production and brewing might seem like a steep career phase change, but the physics of the former provides a solid bridge to the latter.
The overlap is evident, for example, in how instant coffee gets freeze-dried – a low-temperature dehydration process that manufacturers use to extend the shelf-life of perishable materials and make them easier to transport. In the case of coffee, freeze drying (or lyophilization, as it’s commonly known) also helps to retain flavour and aromas.
If you want to study a parameter space that’s not been explored before, the only way to do that is to simulate the core processes using fundamental physics
After roasting and grinding the raw coffee beans, manufacturers extract a coffee concentrate using high pressure and water. This extract is then frozen, ground up and placed in a vacuum well below 0 °C. A small amount of heat is applied to sublime the ice away and remove the remaining water from the non-ice phase.
The quality of the resulting freeze-dried instant coffee is better than ordinary instant coffee. However, freeze-drying is also a complex and expensive process, which manufacturers seek to fine-tune by implementing statistical methods to optimize, for example, the amount of energy consumed during production.
Such approaches involve interpolating the gaps between existing experimental data sets, which is where a physics mind-set comes in. “If you want to study a parameter space that’s not been explored before,” says Farr, “the only way to do that is to simulate the core processes using fundamental physics.”
Beyond the production line, Farr has also sought to make coffee more stable when it’s stored at home. Sustainability is the big driver here: JDE Peet’s has committed to make all its packaging compostable, recyclable or reusable by 2030. “Shelf-life prediction has been a big part of this R&D initiative,” he explains. “The work entails using materials science and the physics of mass transfer to develop next-generation packaging and container systems.”
Line of sight
After eight years unpacking the secrets of coffee physics at JDE Peet’s, Farr was given the option to relocate to the Netherlands in mid-2025 as part of a wider reorganization of the manufacturer’s corporate R&D function. However, he decided to stay put in Oxford and is now deciding between another role in the food manufacturing sector, or moving into a new area of research, such as nuclear energy, or even education.
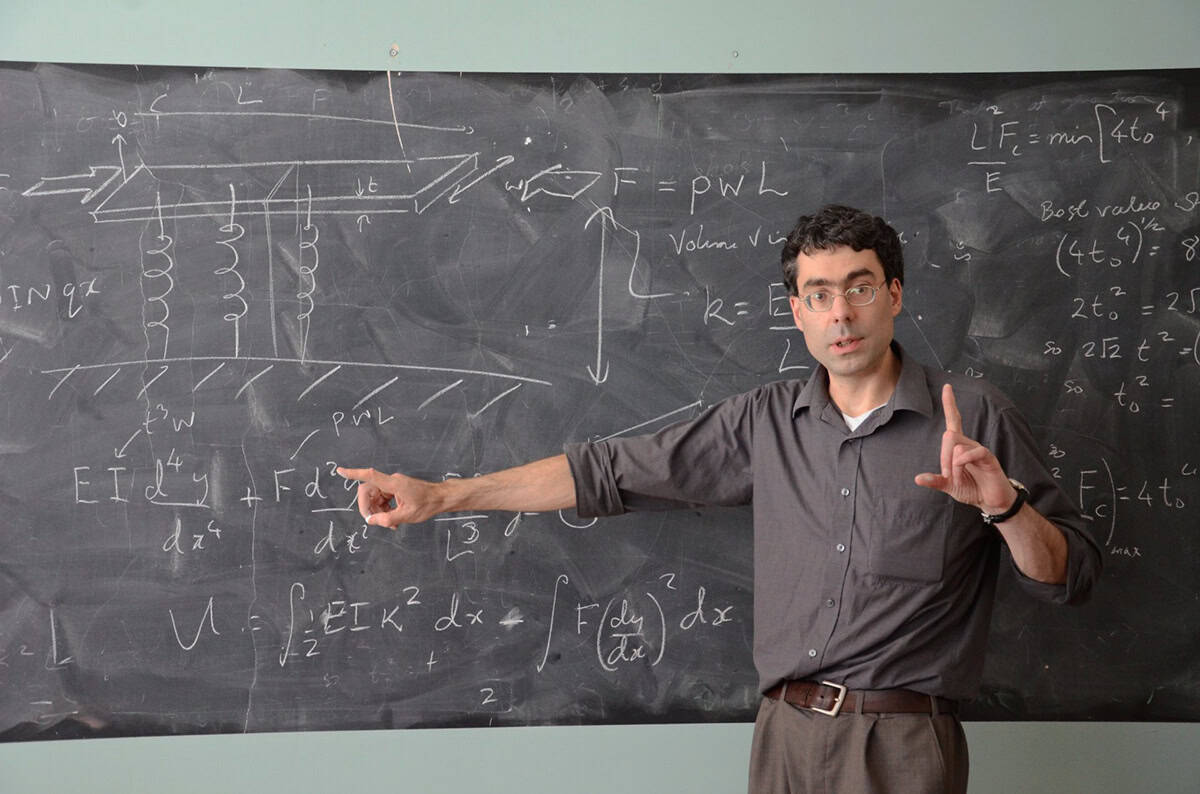
Cool science “The whole panoply of soft-matter physics comes into play across the production, transport and storage of ice-cream,” says industrial physicist Rob Farr. (Courtesy: London Institute for Mathematical Sciences)
Farr believes he gained a lot from his time at JDE Peet’s. As well as studying a wide range of physics problems, he also benefited from the company’s rigorous approach to R&D, whereby projects are regularly assessed for profitability and quickly killed off if they don’t make the cut. Such prioritization avoids wasted effort and investment, but it also demands agility from staff scientists, who have to build long-term research strategies against a project landscape in constant flux.
A senior scientist needs to be someone who colleagues come to informally to discuss their technical challenges
To thrive in that setting, Farr says collaboration and an open mind are essential. “A senior scientist needs to be someone who colleagues come to informally to discuss their technical challenges,” he says. “You can then find the scientific question which underpins seemingly disparate problems and work with colleagues to deliver commercially useful solutions.” For Farr, it’s a self-reinforcing dynamic. “As more people come to you, the more helpful you become – and I love that way of working.”
What Farr calls “line-of-sight” is another unique feature of industrial R&D in food materials. “Maybe you’re only building one span of a really long bridge,” he notes, “but when you can see the process end-to-end, as well as your part in it, that is a fantastic motivator.” Indeed, Farr believes that for physicists who want a job doing something useful, the physics of food materials makes a great career. “There are,” he concludes, “no end of intriguing and challenging research questions.”
Physicists in the UK have succeeded in routing and teleporting entangled states of light between two four-user quantum networks – an important milestone in the development of scalable quantum communications. Led by Mehul Malik and Natalia Herrera Valencia of Heriot-Watt University in Edinburgh, Scotland, the team achieved this milestone thanks to a new method that uses light-scattering processes in an ordinary optical fibre to program a circuit. This approach, which is radically different from conventional methods based on photonic chips, allows the circuit to function as a programmable entanglement router that can implement several different network configurations on demand.
The team performed the experiments using commercially-available optical fibres, which are multi-mode structures that scatter light via random linear optical processes. In simple terms, Herrera Valencia explains that this means the light tends to ricochet chaotically through the fibres along hundreds of internal pathways. While this effect can scramble entanglement, researchers at the Institut Langevin in Paris, France had previously found that the scrambling can be calculated by analysing how the fibre transmits light. What is more, the light-scattering processes in such a medium can be harnessed to make programmable optical circuits – which is exactly what Malik, Herrera Valencia and colleagues did.
“Top-down” approach
The researchers explain that this “top-down” approach simplifies the circuit’s architecture because it separates the layer where the light is controlled from the layer in which it is mixed. Using waveguides for transporting and manipulating the quantum states of light also reduces optical losses. The result is a reconfigurable multi-port device that can distribute quantum entanglement between many users simultaneously in multiple patterns, switching between different channels (local connections, global connections or both) as required.
A further benefit is that the channels can be multiplexed, allowing many quantum processors to access the system at the same time. The researchers say this is similar to multiplexing in classical telecommunications networks, which makes it possible to send huge amounts of data through a single optical fibre using different wavelengths of light.
Access to a large number of modes
Although controlling and distributing entangled states of light is key for quantum networks, Malik says it comes with several challenges. One of these is that conventional methods based on photonics chips cannot be scaled up easily. They are also very sensitive to imperfections in how they’re made. In contrast, the waveguide-based approach developed by the Heriot-Watt team “opens up access to a large number of modes, providing significant improvements in terms of achievable circuit size, quality and loss,” Malik tells Physics World, adding that the approach also fits naturally with existing optical fibre infrastructures.
Gaining control over the complex scattering process inside a waveguide was not easy, though. “The main challenge was the learning curve and understanding how to control quantum states of light inside such a complex medium,” Herrera Valencia recalls. “It took time and iteration, but we now have the precise and reconfigurable control required for reliable entanglement distribution, and even more so for entanglement swapping, which is essential for scalable networks.”
While the Heriot-Watt team used the technique to demonstrate flexible quantum networking, Malik and Herrera Valencia say it might also be used for implementing large-scale photonic circuits. Such circuits could have many applications, ranging from machine learning to quantum computing and networking, they add.
Looking ahead, the researchers, who report their work in Nature Photonics, say they are now aiming to explore larger-scale circuits that can operate on more photons and light modes. “We would also like to take some of our network technology out of the laboratory and into the real world,” says Malik, adding that Herrera Valencia is leading a commercialization effort in that direction.
Multimodal monitoring Pressure and strain sensors on a clinical trial volunteer undergoing an ultrasound scan (left). Snapshot image of the ultrasound video recording (right). (Courtesy: Yap et al., Sci. Adv. 11 eady2661)
The ability to continuously monitor and interpret foetal movement patterns in the third trimester of a pregnancy could help detect any potential complications and improve foetal wellbeing. Currently, however, such assessment of foetal movement is performed only periodically, with an ultrasound exam at a hospital or clinic.
A lightweight, easily wearable, adhesive patch-based sensor developed by engineers and obstetricians at Monash University in Australia may change this. The patches, two of which are worn on the abdomen, can detect foetal movements such as kicking, waving, hiccups, breathing, twitching, and head and trunk motion.
Reduced foetal movement can be associated with potential impairment in the central nervous system and musculoskeletal system, and is a common feature observed in pregnancies that end in foetal death and stillbirth. A foetus compromised in utero may reduce movements as a compensatory strategy to lower oxygen consumption and conserve energy.
To help identify foetuses at risk of complications, the Monash team developed an artificial intelligence (AI)-powered wearable pressure–strain combo sensor system that continuously and accurately detects foetal movement-induced motion in the mother’s abdominal skin. As reported in Science Advances, the “band-aid”-like sensors can discriminate between foetal and non-foetal movement with over 90% accuracy.
The system comprises two soft, thin and flexible patches designed to conform to the abdomen of a pregnant woman. One patch incorporates an octagonal gold nanowire-based strain sensor (the “Octa” sensor), the other is an interdigitated electrode-based pressure sensor.
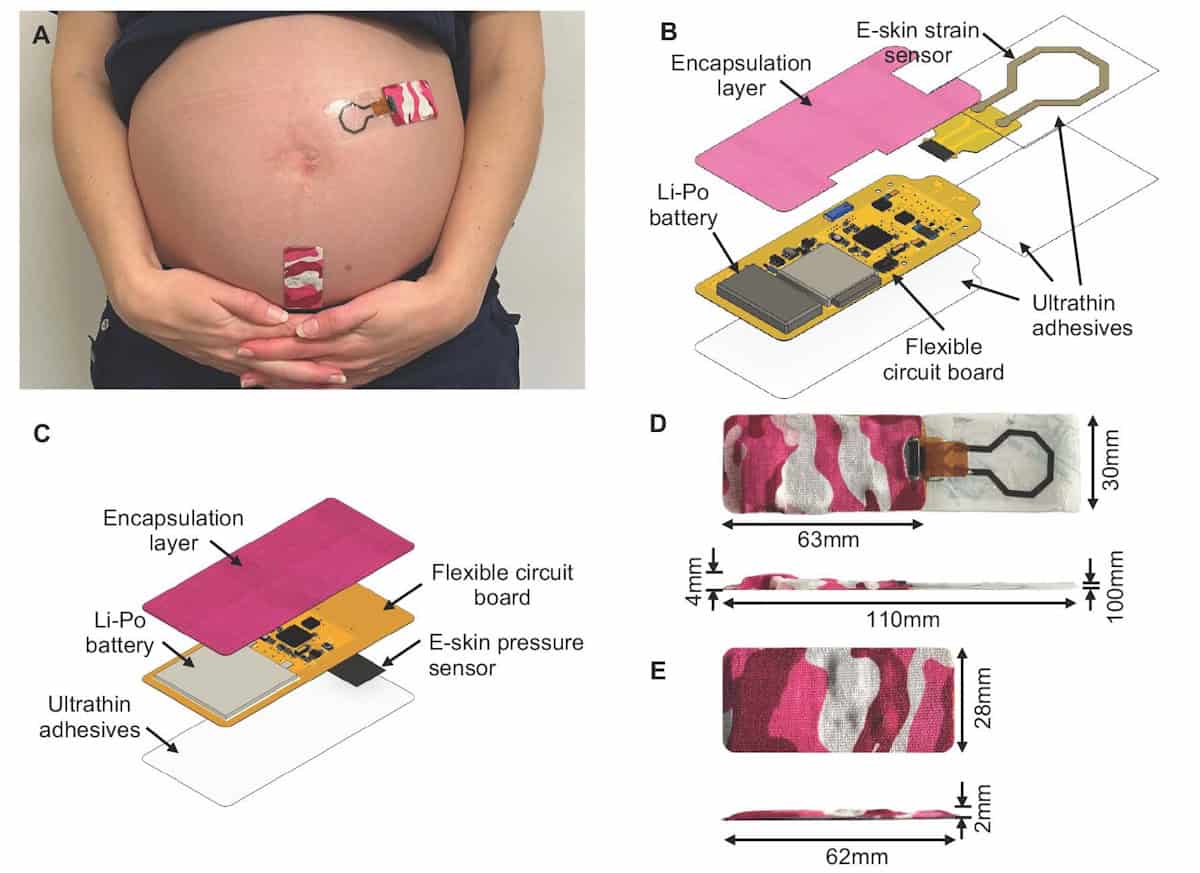
Pressure and strain combo Photograph of the sensors on a pregnant mother (A). Exploded illustration of the foetal kicks strain sensor (B) and the pressure sensor (C). Dimensions of the strain (D) and pressure (E) sensors. (Courtesy: Yap et al., Sci. Adv. 11 eady2661)
The patches feature a soft polyimide-based flexible printed circuit (FPC) that integrates a thin lithium polymer battery and various integrated circuit chips, including a Bluetooth radiofrequency system for reading the sensor’s electrical resistance, storing data and communicating with a smartphone app. Each patch is encapsulated with kinesiology tape and sticks to the abdomen using a medical double-sided silicone adhesive.
The Octa sensor is attached to a separate FPC connector attached to the primary device, enabling easy replacement after each study. The pressure sensor is mounted on the silicone adhesive, to connect with the interdigitated electrode beneath the primary device. The Octa and pressure sensor patches are lightweight (about 3 g) and compact, measuring 63 x 30 x 4 mm and 62 x 28 x 2 mm, respectively.
Trialling the device
The researchers validated their foetal movement monitoring system via comparison with simultaneous ultrasound exams, examining 59 healthy pregnant women at Monash Health. Each participant had the pressure sensor attached to the area of their abdomen where they felt the most vigorous foetal movements, typically in the lower quadrant, while the strain sensor was attached to the region closest to foetal limbs. An accelerometer placed on the participant’s chest captured non-foetal movement data for signal denoising and training the machine-learning model.
Principal investigator Wenlong Cheng, now at the University of Sydney, and colleagues report that “the wearable strain sensor featured isotropic omnidirectional sensitivity, enabling detection of maternal abdominal [motion] over a large area, whereas the wearable pressure sensor offered high sensitivity with a small domain, advantageous for accurate localized foetal movement detection”.
The researchers note that the pressure sensor demonstrated higher sensitivity to movements directly beneath it compared with motion farther away, while the Octa sensor performed consistently across a wider sensing area. “The combination of both sensor types resulted in a substantial performance enhancement, yielding an overall AUROC [area under the receiver operating characteristic curve] accuracy of 92.18% in binary detection of foetal movement, illustrating the potential of combining diverse sensing modalities to achieve more accurate and reliable monitoring outcomes,” they write.
In a press statement, co-author Fae Marzbanrad explains that the device’s strength lies in a combination of soft sensing materials, intelligent signal processing and AI. “Different foetal movements create distinct strain patterns on the abdominal surface, and these are captured by the two sensors,” she says. “The machine-learning system uses the signals to detect when movement occurs while cancelling maternal movements.”
The lightweight and flexible device can be worn by pregnant women for long periods without disrupting daily life. “By integrating sensor data with AI, the system automatically captures a wider range of foetal movements than existing wearable concepts while staying compact and comfortable,” Marzbanrad adds.
The next steps towards commercialization of the sensors will include large-scale clinical studies in out-of-hospital settings, to evaluate foetal movements and investigate the relationship between movement patterns and pregnancy complications.
Since the beginning of radiation therapy, almost all treatments have been delivered with the patient lying on a table while the beam rotates around them. But a resurgence in upright patient positioning is changing that paradigm. Novel radiation accelerators such as proton therapy, VHEE, and FLASH therapy are often too large to rotate around the patient, making access limited. By instead rotating the patient, these previously hard-to-access beams could now become mainstream in the future.
Join leading clinicians and experts as they discuss how this shift in patient positioning is enabling exploration of new treatment geometries and supporting the development of advanced future cancer therapies.
L-R Serdar Charyyev, Eric Deutsch, Bill Loo, Rock Mackie
Novel beams covered and their representative speaker
Serdar Charyyev – Proton Therapy – Clinical Assistant Professor at Stanford University School of Medicine Eric Deutsch – VHEE FLASH – Head of Radiotherapy at Gustave Roussy Bill Loo – FLASH Photons – Professor of Radiation Oncology at Stanford Medicine Rock Mackie – Emeritus Professor at University of Wisconsin and Co-Founder and Chairman of Leo Cancer Care
Be curious As CTO of a quantum tech company, Andrew Lamb values evidence-based decision making and being surrounded by experts. (Courtesy: Delta.g)
What skills do you use every day in your job?
A quantum sensor is a combination of lots of different parts working together in harmony: a sensor head containing the atoms and isolating them from the environment; a laser system to probe the quantum structure and manipulate atomic states; electronics to drive the power and timing of a device; and software to control everything and interpret the data. As the person building, developing and maintaining these devices you need to have expertise across all these areas. In addition to these skills, as the CTO my role also requires me to set the company’s technical priorities, determine the focus of R&D activities and act as the top technical authority in the firm.
In a developing field like quantum metrology, evidence-based decision making is crucial as you critically assess information, disregarding what is irrelevant and making an informed choice – especially when the “right answer” may not be obvious for months or even years. Challenges arise that may never have been solved before, and the best way to do so is to dive deep into the “why and how” something happens. Once the root cause is identified a creative solution then needs to be found; whether it is something brand new, or implementing an approach from an entirely different discipline.
What do you like best and least about your job?
The best thing about my job is the way in which it enables me to grow my knowledge and understanding of a wide variety of fields, while also providing me opportunities for creative problem solving. When you surround yourself with people who are experts in their field, there is no end to the opportunities to learn. Before co-founding Delta.g I was a researcher at the University of Birmingham where I learnt my technical skills. Moving into a start-up, we built a multidisciplinary team to address the operational, regulatory and technical barriers to establish a disruptive product in the marketplace. The diversity created within our company has afforded a greater pool of experts to learn from.
As the CTO, my role sits at the intersection of the technical and the commercial within the business. That means it is my responsibility to translate commercial milestones into a scientific plan, while also explaining our progress to non-experts. This can be challenging and quite stressful at times – particularly when I need to describe our scientific achievements in a way that truly reflects our advances, while still being accessible.
What do you know today that you wish you knew when you were starting out in your career?
For a long time, I didn’t know what direction I wanted to take, and I used to worry that the lack of a clear purpose would hold me back. Today I know that it doesn’t. Instead of fixating on finding a perfect path early on, it’s far more valuable to focus on developing skills that open doors. Whether those skills are technical, managerial or commercial, no knowledge is ever wasted. I’m still surprised by how often something I learned as far back as GCSE ends up being useful in my work now.
I also wish I had understood just how important it is to stay open to new opportunities. Looking back, every pivotal point in my career – switching from civil engineering to a physics degree, choosing certain undergraduate modules, applying for unexpected roles, even co-founding Delta.g – came from being willing to make a shift when an opportunity appeared. Being flexible and curious matters far more than having everything mapped out from the beginning.
Despite not being close to the frontline of Russia’s military assault on Ukraine, life at the Ivano-Frankivsk National Technical University of Oil and Gas is far from peaceful. “While we continue teaching and research, we operate under constant uncertainty – air raid alerts, electricity outages – and the emotional toll on staff and students,” says Lidiia Davybida, an associate professor of geodesy and land management.
Last year, the university became a target of a Russian missile strike, causing extensive damage to buildings that still has not been fully repaired – although, fortunately, no casualties were reported. The university also continues to leak staff and students to the war effort – some of whom will tragically never return – while new student numbers dwindle as many school graduates leave Ukraine to study abroad.
Despite these major challenges, Davybida and her colleagues remain resolute. “We adapt – moving lectures online when needed, adjusting schedules, and finding ways to keep research going despite limited opportunities and reduced funding,” she says.
Resolute research
Davybida’s research focuses on environmental monitoring using geographic information systems (GIS), geospatial analysis and remote sensing. She has been using these techniques to monitor the devastating impact that the war is having on the environment and its significant contribution to climate change.
In 2023 she published results from using Sentinel-5P satellite data and Google Earth Engine to monitor the air quality impacts of war on Ukraine (IOP Conf. Ser.: Earth Environ. Sci. 1254 012112). As with the COVID-19 lockdowns worldwide, her results reveal that levels of common pollutants such as carbon monoxide, nitrogen dioxide and sulphur dioxide were, on average, down from pre-invasion levels. This reflects the temporary disruption to economic activity that war has brought on the country.
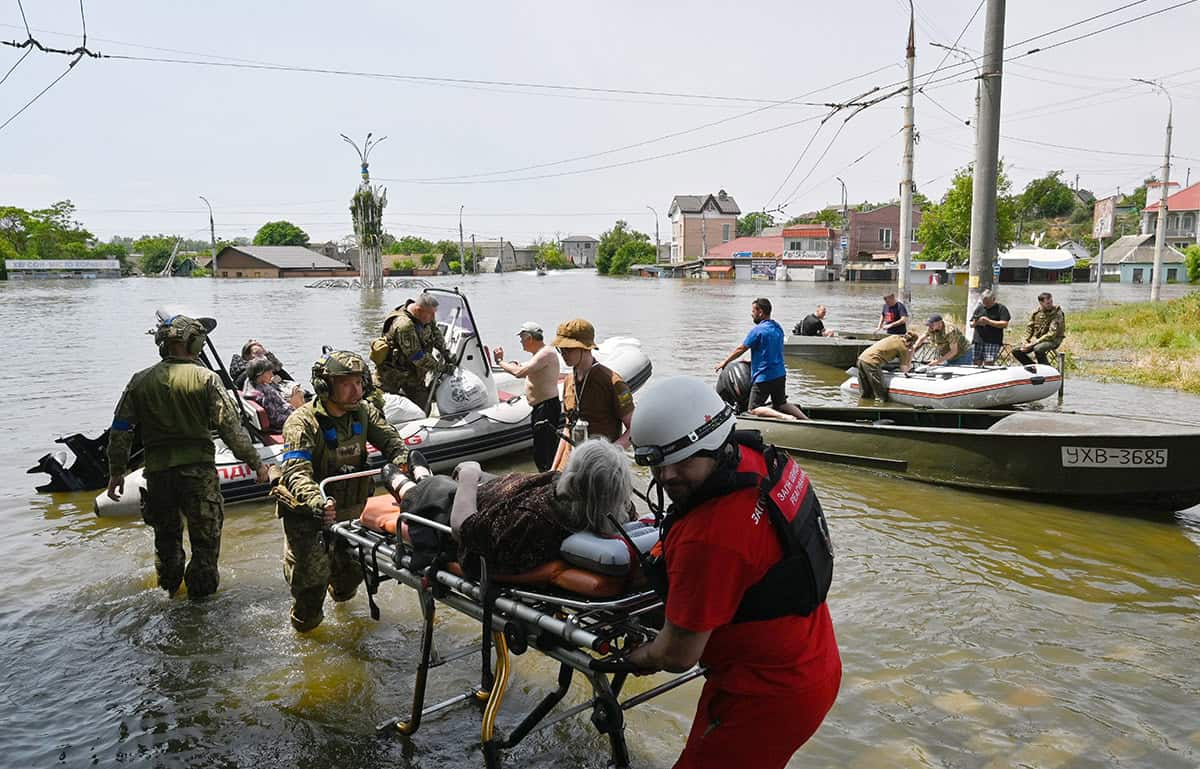
Wider consequences Ukrainian military, emergency services and volunteers work together to rescue people from a large flooded area in Kherson on 8 June 2023. Two days earlier, the Russian army blew up the dam of the Kakhovka hydroelectric power station, meaning about 80 settlements in the flood zone had to be evacuated. (Courtesy: Sergei Chuzavkov/SOPPA Images/Shutterstock)
More worrying, from an environment and climate perspective, were the huge concentrations of aerosols, smoke and dust in the atmosphere. “High ozone concentrations damage sensitive vegetation and crops,” Davybida explains. “Aerosols generated by explosions and fires may carry harmful substances such as heavy metals and toxic chemicals, further increasing environmental contamination.” She adds that these pollutants can alter sunlight absorption and scattering, potentially disrupting local climate and weather patterns, and contributing to long-term ecological imbalances.
A significant toll has been wrought by individual military events too. A prime example is Russia’s destruction of the Kakhovka Dam in southern Ukraine in June 2023. An international team – including Ukrainian researchers – recently attempted to quantify this damage by combining on-the-ground field surveys, remote-sensing data and hydrodynamic modelling; a tool they used for predicting water flow and pollutant dispersion.
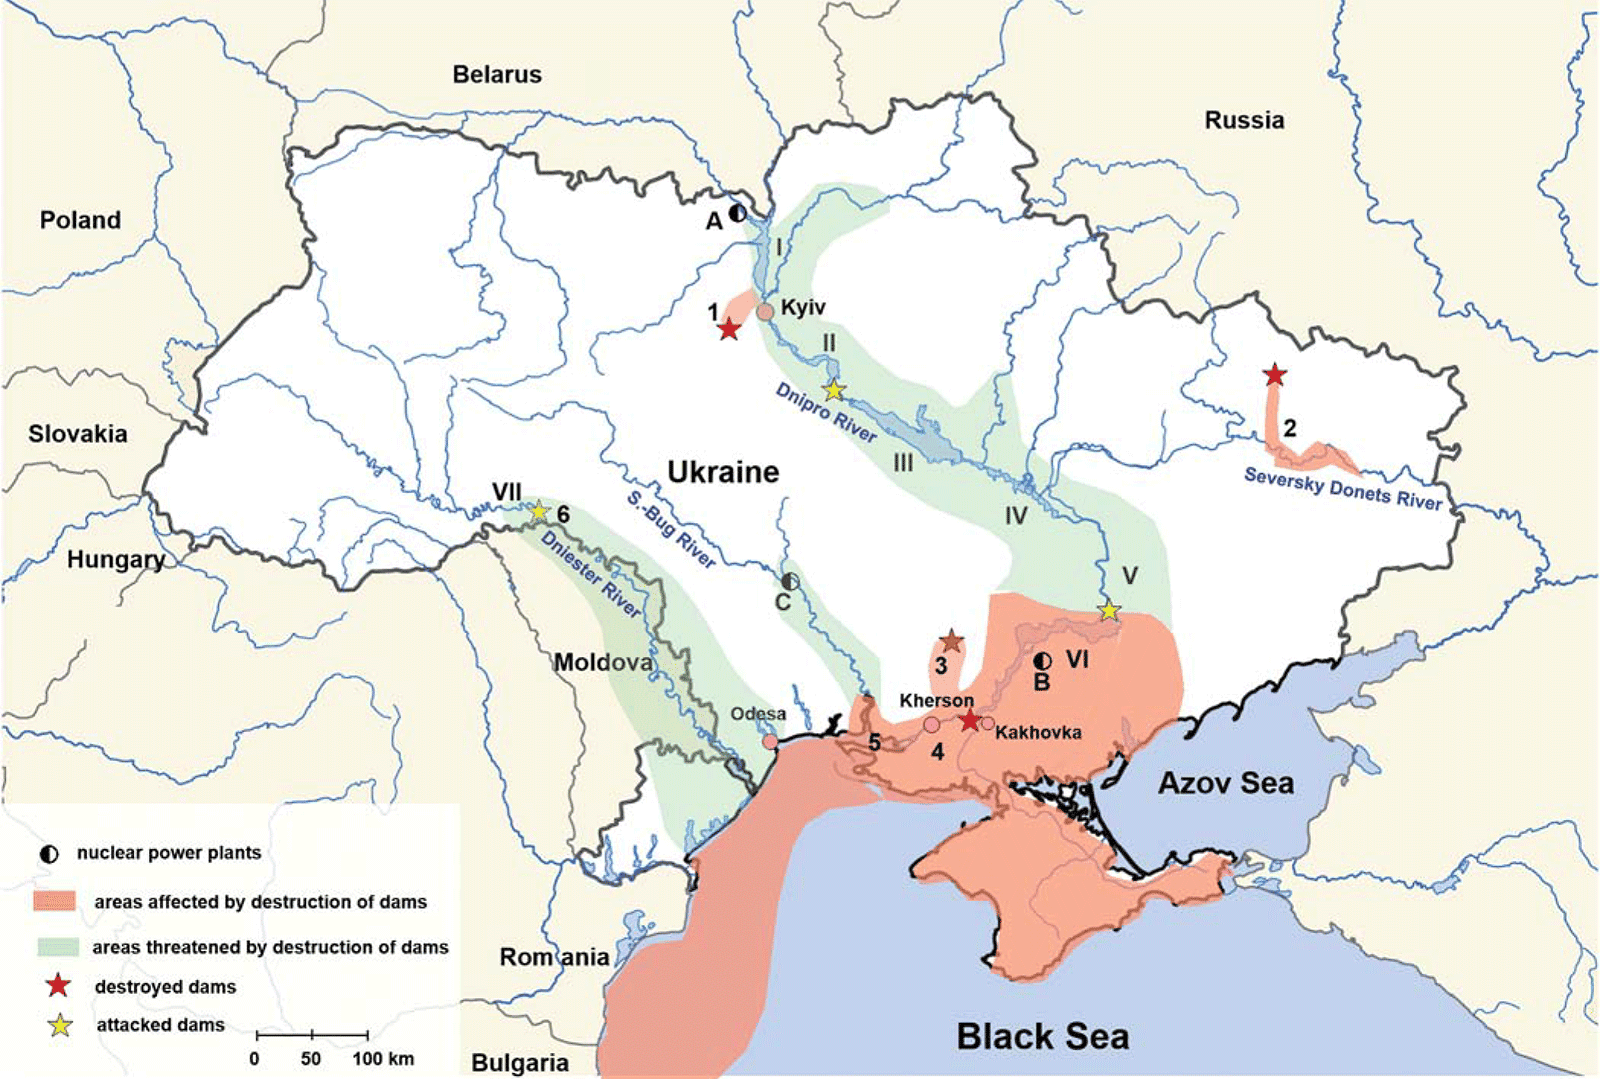
The results of this work are sobering (Science387 1181). Though 80% of the ecosystem is expected to re-establish itself within five years, the dam’s destruction released as much as 1.7 cubic kilometres of sediment contaminated by a host of persistent pollutants, including nitrogen, phosphorous and 83,000 tonnes of heavy metals. Discharging this toxic sludge across the land and waterways will have unknown long-term environmental consequences for the region, as the contaminants could be spread by future floods, the researchers concluded (figure 1).
This map shows areas of Ukraine affected or threatened by dam destruction in military operations. Arabic numbers 1 to 6 indicate rivers: Irpen, Oskil, Inhulets, Dnipro, Dnipro-Bug Estuary and Dniester, respectively. Roman numbers I to VII indicate large reservoir facilities: Kyiv, Kaniv, Kremenchuk, Kaminske, Dnipro, Kakhovka and Dniester, respectively. Letters A to C indicate nuclear power plants: Chornobyl, Zaporizhzhia and South Ukraine, respectively.
Dangerous data
A large part of the reason for the researchers’ uncertainty, and indeed more general uncertainty in environmental and climate impacts of war, stems from data scarcity. It is near-impossible for scientists to enter an active warzone to collect samples and conduct surveys and experiments. Environmental monitoring stations also get damaged and destroyed during conflict, explains Davybida – a wrong she is attempting to right in her current work. Many efforts to monitor, measure and hopefully mitigate the environmental and climate impact of the war in Ukraine are therefore less direct.
In 2022, for example, climate-policy researcher Mathijs Harmsen from the PBL Netherlands Environmental Assessment Agency and international collaborators decided to study the global energy crisis (which was sparked by Russia’s invasion of Ukraine) to look at how the war will alter climate policy (Environ. Res. Lett.19 124088).
They did this by plugging in the most recent energy price, trade and policy data (up to May 2023) into an integrated assessment model that simulates the environmental consequences of human activities worldwide. They then imposed different potential scenarios and outcomes and let it run to 2030 and 2050. Surprisingly, all scenarios led to a global reduction of 1–5% of carbon dioxide emissions by 2030, largely due to trade barriers increasing fossil fuel prices, which in turn would lead to increased uptake of renewables.
But even though the sophisticated model represents the global energy system in detail, some factors are hard to incorporate and some actions can transform the picture completely, argues Harmsen. “Despite our results, I think the net effect of this whole war is a negative one, because it doesn’t really build trust or add to any global collaboration, which is what we need to move to a more renewable world,” he says. “Also, the recent intensification of Ukraine’s ‘kinetic sanctions’ [attacks on refineries and other fossil fuel infrastructure] will likely have a larger effect than anything we explored in our paper.”
Elsewhere, Toru Kobayakawa was, until recently, working for the Japan International Cooperation Agency (JICA), leading the Ukraine support team. Kobayakawa used a non-standard method to more realistically estimate the carbon footprint of reconstructing Ukraine when the war ends (Environ. Res.: Infrastruct. Sustain.5 015015). The Intergovernmental Panel on Climate Change (IPCC) and other international bodies only account for carbon emissions within the territorial country. “The consumption-based model I use accounts for the concealed carbon dioxide from the production of construction materials like concrete and steel imported from outside of the country,” he says.
Using an open-source database Eora26 that tracks financial flows between countries’ major economic sectors in simple input–output tables, Kobayakawa calculated that Ukraine’s post-war reconstruction will amount to 741 million tonnes carbon dioxide equivalent over 10 years. This is 4.1 times Ukraine’s pre-war annual carbon-dioxide emissions, or the combined annual emissions of Germany and Austria.
However, as with most war-related findings, these figures come with a caveat. “Our input–output model doesn’t take into account the current situation,” notes Kobayakawa “It is the worst-case scenario.” Nevertheless, the research has provided useful insights, such as that the Ukrainian construction industry will account for 77% of total emissions.
“Their construction industry is notorious for inefficiency, needing frequent rework, which incurs additional costs, as well as additional carbon-dioxide emissions,” he says. “So, if they can improve efficiency by modernizing construction processes and implementing large-scale recycling of construction materials, that will contribute to reducing emissions during the reconstruction phase and ensure that they build back better.”
Military emissions gap
As the experiences of Davybida, Harmsen and Kobayakawa show, cobbling together relevant and reliable data in the midst of war is a significant challenge, from which only limited conclusions can be drawn. Researchers and policymakers need a fuller view of the environmental and climate cost of war if they are to improve matters once a conflict ends.
At present, reporting military emissions is voluntary, so data are often absent or incomplete – but gathering such data is vital. According to a 2022 estimate extrapolated from the small number of nations that do share their data, the total military carbon footprint is approximately 5.5% of global emissions. This would make the world’s militaries the fourth biggest carbon emitter if they were a nation.
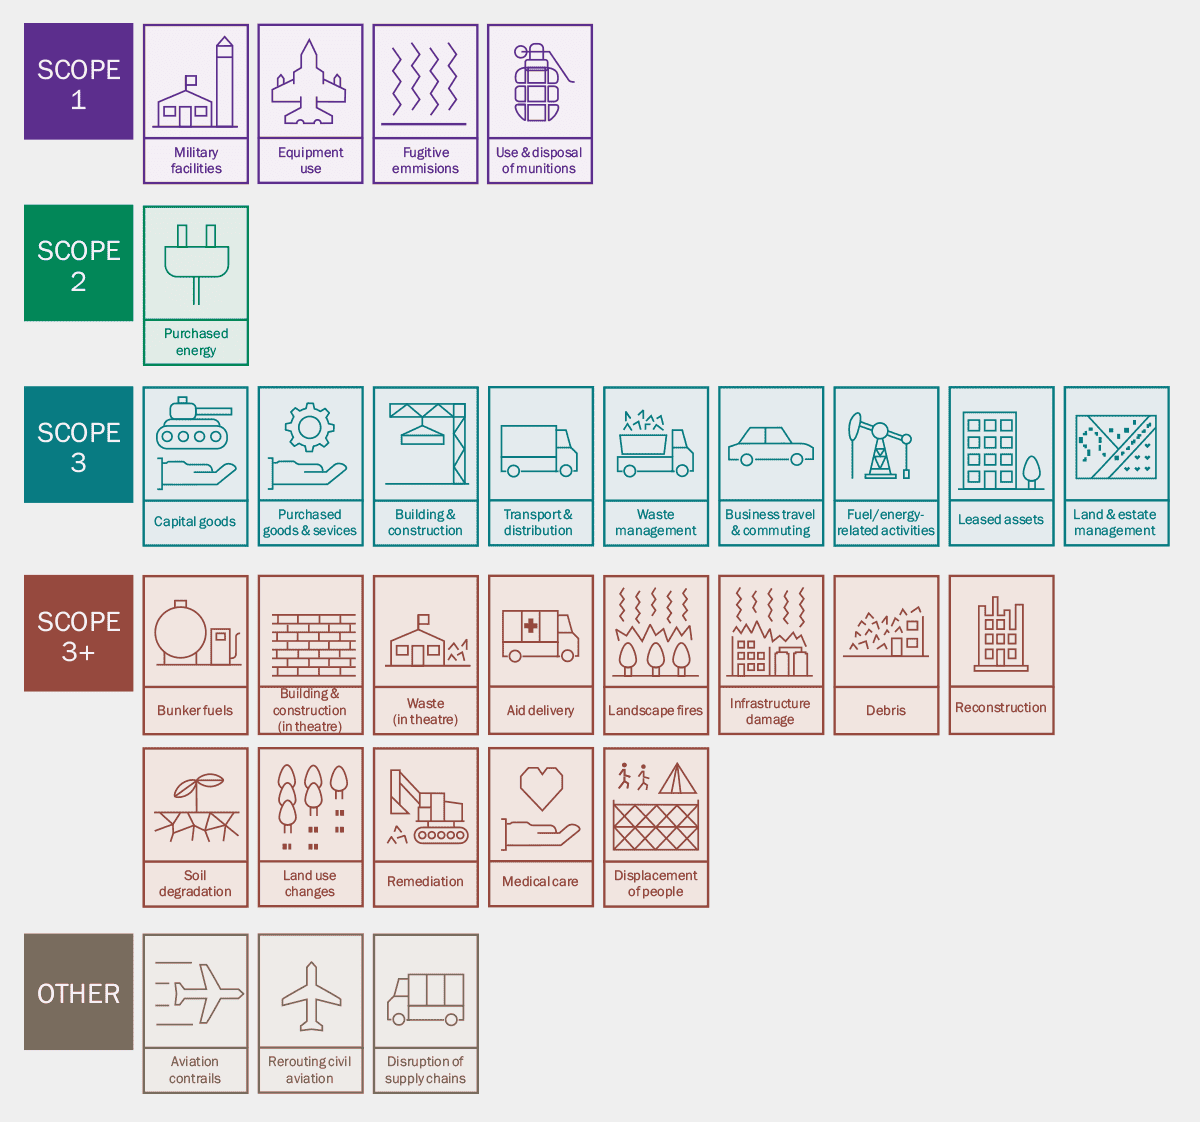
The website is an attempt to fill this gap. “We hope that the UNFCCC picks up on this and mandates transparent and visible reporting of military emissions,” Neimark says (figure 2).
2 Closing the data gap
(Reused with permission from Neimark et al. 2025 War on the Climate: A Multitemporal Study of Greenhouse Gas Emissions of the Israel–Gaza Conflict. Available at SSRN)
Current United Nations Framework Convention on Climate Change (UNFCCC) greenhouse-gas emissions reporting obligations do not include all the possible types of conflict emissions, and there is no commonly agreed methodology or scope on how different countries collect emissions data. In a recent publication War on the Climate: a Multitemporal Study of Greenhouse Gas Emissions of the Israel-Gaza Conflict, Benjamin Neimark et al. came up with this framework, using the UNFCCC’s existing protocols. These reporting categories cover militaries and armed conflicts, and hope to highlight previously “hidden” emissions.
Measuring the destruction
Beyond plugging the military emissions gap, Neimark is also involved in developing and testing methods that he and other researchers can use to estimate the overall climate impact of war. Building on foundational work from his collaborator, Dutch climate specialist Lennard de Klerk – who developed a methodology for identifying, classifying and providing ways of estimating the various sources of emissions associated with the Russia–Ukraine war – Neimark and colleagues are trying to estimate the greenhouse-gas emissions from the Israel–Gaza conflict.
Their studies encompass pre-conflict preparation, the conflict itself and post-conflict reconstruction. “We were working with colleagues who were doing similar work in Ukraine, but every war is different,” says Neimark. “In Ukraine, they don’t have large tunnel networks, or they didn’t, and they don’t have this intensive, incessant onslaught of air strikes from carbon-intensive F16 fighter aircraft.” Some of these factors, like the carbon impact of Hamas’ underground maze of tunnels under Gaza, seem unquantifiable, but Neimark has found a way.
“There’s some pretty good data for how big these are in terms of height, the amount of concrete, how far down they’re dug and how thick they are,” says Neimark. “It’s just the length we had to work out based on reported documentation.” Finding the total amount of concrete and steel used in these tunnels involved triangulating open-source information with media reports to finalize an estimate of the dimensions of these structures. Standard emission factors could then be applied to obtain the total carbon emissions. According to data from Neimark’s Confronting Military Greenhouse Gas Emissions report, the carbon emissions from construction of concrete infrastructure by both Israel and Hamas were more than the annual emissions of 33 individual countries and territories (figure 3).
3 Climate change and the Gaza war
(Reused with permission from Neimark et al. 2024 Confronting Military Greenhouse Gas Emissions, Interactive Policy Brief, London, UK. Available from QMUL.)
Data from Benjamin Neimark, Patrick Bigger, Frederick Otu-Larbi and Reuben Larbi’s Confronting Military Greenhouse Gas Emissions report estimates the carbon emissions of the war in Gaza for three distinct periods: direct war activities; large-scale war infrastructure; and future reconstruction.
The impact of Hamas’ tunnels and Israel’s “iron wall” border fence are just two of many pre-war activities that must be factored in to estimate the Israel–Gaza conflict’s climate impact. Then, the huge carbon cost of the conflict itself must be calculated, including, for example, bombing raids, reconnaissance flights, tanks and other vehicles, cargo flights and munitions production.
Gaza’s eventual reconstruction must also be included, which makes up a big proportion of the total impact of the war, as Kobayakawa’s Ukraine reconstruction calculations showed. The United Nations Environment Programme (UNEP) has been systematically studying and reporting on “Sustainable debris management in Gaza” as it tracks debris from damaged buildings and infrastructure in Gaza since the outbreak of the conflict in October 2023. Alongside estimating the amounts of debris, UNEP also models different management scenarios – ranging from disposal to recycling – to evaluate the time, resource needs and environmental impacts of each option.
Visa restrictions and the security situation have prevented UNEP staff from entering the Gaza strip to undertake environmental field assessments to date. “While remote sensing can provide a valuable overview of the situation … findings should be verified on the ground for greater accuracy, particularly for designing and implementing remedial interventions,” says a UNEP spokesperson. They add that when it comes to the issue of contamination, UNEP needs “confirmation through field sampling and laboratory analysis” and that UNEP “intends to undertake such field assessments once conditions allow”.
The main risk from hazardous debris – which is likely to make up about 10–20% of the total debris – arises when it is mixed with and contaminates the rest of the debris stock. “This underlines the importance of preventing such mixing and ensuring debris is systematically sorted at source,” adds the UNEP spokesperson.
The ultimate cost
With all these estimates, and adopting a Monte Carlo analysis to account for uncertainties, Neimark and colleagues concluded that, from the first 15 months of the Israel–Gaza conflict, total carbon emissions were 32 million tonnes, which is huge given that the territory has a total area of just 365 km². The number also continues to rise.
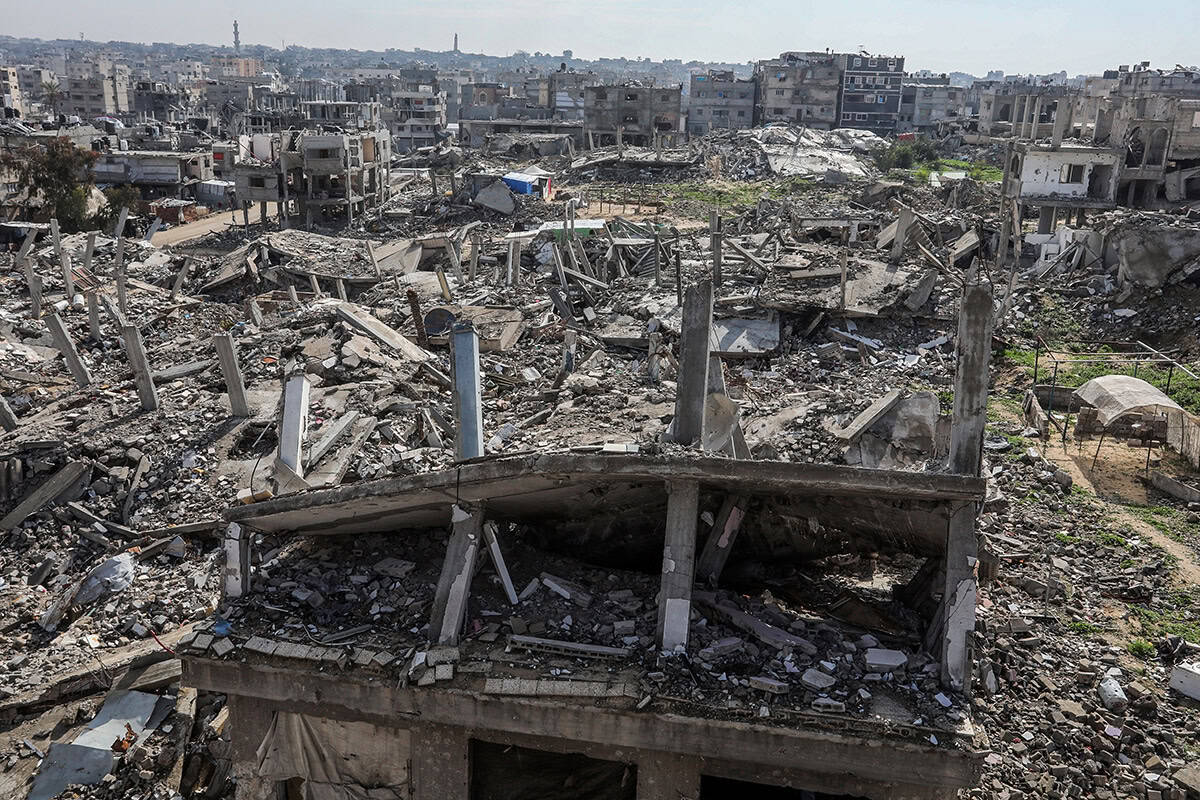
Rubble and ruins Khan Younis in the Gaza Strip on 11 February 2025, showing the widespread damage to buildings and infrastructure. (Courtesy: Shutterstock/Anas Mohammed)
Why does this number matter? When lives are being lost in Gaza, Ukraine, and across Sudan, Myanmar and other regions of the world, calculating the environmental and climate cost of war might seem like something only worth bothering about when the fighting stops.
But doing so even while conflicts are taking place can help protect important infrastructure and land, avoid environmentally disastrous events, and to ensure the long rebuild, wherever the conflict may be happening, is informed by science. The UNEP spokesperson says that it is important to “systematically integrate environmental considerations into humanitarian and early recovery planning from the outset” rather than treating the environment as an afterthought. They highlight that governments should “embed it within response plans – particularly in areas where it can directly impact life-saving activities, such as debris clearance and management”.
With Ukraine still in the midst of war, it seems right to leave the final word to Davybida. “Armed conflicts cause profound and often overlooked environmental damage that persists long after the fighting stops,” she says. “Recognizing and monitoring these impacts is vital to guide practical recovery efforts, protect public health, prevent irreversible harm to ecosystems and ensure a sustainable future.”


 Since the beginning of radiation therapy, almost all treatments have been delivered with the patient lying on a table while the beam rotates around them. But a resurgence in upright patient positioning is changing that paradigm. Novel radiation accelerators such as proton therapy, VHEE, and FLASH therapy are often too large to rotate around the patient, making access limited. By instead rotating the patient, these previously hard-to-access beams could now become mainstream in the future.