New images from NASA’s Parker Solar Probe offer a rare glimpse of the surface of Venus as the human eye might see it. Recorded as the probe flew past the fiery, cloud-shrouded planet on its mission to the Sun, the visible-light images of Venus’ plains and plateaus are the first to be taken from space, and the first to emerge from the Venusian surface since the early 1980s, when the last in a pioneering series of Soviet probes succumbed to the harsh environment within an hour of landing. By analysing the images, mission scientists hope to better understand how Venus formed, and why conditions on its surface are so different from those that prevail on the Earth and Mars.
Although the Parker Solar Probe was designed to study the solar wind, a series of scheduled Venus “flybys” – manoeuvres that use gravity to adjust a spacecraft’s trajectory without recourse to scarce onboard fuel – gave mission scientists a chance to do some bonus planetary exploration. During a flyby on 11 July 2020, a team led by Brian Wood of the US Naval Research Laboratory used the probe’s Wide-Field Imager (WISPR) to image Venus’ “nightside”. Because Venus takes 243 Earth days to complete a single rotation, weather conditions on its nightside are markedly different from those on the side receiving sunlight. Wood and his colleagues hoped they might be able to measure the speed of clouds in Venus’ thick atmosphere.
Instead of seeing clouds, though, WISPR unexpectedly saw through them, picking up the faint glow emanating from the planet’s surface. “The surface of Venus, even on the nightside, is about 860 degrees [Celsius],” Wood explains. “It’s so hot that the rocky surface of Venus is visibly glowing, like a piece of iron pulled from a forge.”
Observing at optical wavelengths
While some of the wavelengths WISPR recorded lie in the near-infrared region of the spectrum, and are thus invisible to humans, the instrument also picked up light at blue, green and red wavelengths ranging from 470 to 750 nm. During a later flyby on 20 February 2021, a more favourable alignment between spacecraft and planet enabled the team to image the entire nightside.
The resulting images reveal various surface features, including a plateau called Tellus Regio and a plain known as Aino Planitia. Because higher-altitude regions are cooler than lower areas, they show up as dark patches amidst the brighter plains. The WISPR team also recorded a luminous halo of oxygen surrounding the planet, which members describe as “somewhat analogous to auroral emissions observed at Earth”.
The Parker Solar Probe is scheduled to perform two additional Venus flybys before its mission ends in 2025. The last of these, in November 2024, will give the probe’s scientists a third and final shot at imaging Venus’ darkside. Looking further ahead, the ESA/NASA Solar Orbiter mission also plans to gather data on Venus during a series of flybys stretching into the 2030s.
Hakeem Oluseyi found his way into professional physics unlike anyone you have ever known. Born James Plummer Jr, an African American in the deep south of the US, he grew up in some of the scariest urban neighbourhoods, such as the Ninth Ward of New Orleans and Watts in Los Angeles. His parents separated when he was four years old; he lived with an itinerant mother who was either sad or angry and always had a job but couldn’t hold it. He was largely raised by his sister Bridgette, six years older.
Shipped out west at the age of 10 to stay with an aunt, he lived in nine different households in 16 months, few of which seemed to want or like him, and attended five different schools. Back in New Orleans, “bigger, meaner, harder”, he was smoking marijuana daily at the age of 13 and carried a gun for protection. In Oluseyi’s own words, he “lived like a feral animal”.
It was, and for far too many still is, a desperate world of dire poverty, drugs and crime that America has accepted and chosen to ignore.
How did Oluseyi manage this amazing transformation? In A Quantum Life: My Unlikely Journey from the Street to the Stars, co-written with science writer Joshua Horwitz, Oluseyi tells the story of his life using the analogy of quantum tunnelling: “My life has been an oscillatory pattern of passing through walls.” All lives are ultimately mysteries, but Oluseyi’s is as improbable as any.
And yet some clear peaks stand out in his struggle. Naturally curious, he was born to seemingly ordinary parents, yet was gifted, with an IQ of 162. He eased anxiety by counting – anything and everything. At age six he learned bridge and was taking apart household appliances, which earned him whippings from his mother. In 1976, at the age of nine, Oluseyi read the novel Roots by Alex Haley, and says he was studying the equations of special relativity from 11 years old. In high school he won first prize for physics at the Mississippi state science fair with the project “Programming the Effects of Special Relativity”, but he only learned algebra after high school, during a bout in the US Navy.
One of the joys of reading this book is tracking the progression in Oluseyi’s life as key people enter and he tunnels through another barrier
One of the joys of reading this book, besides the authors’ excellent storytelling, is tracking the progression in Oluseyi’s life as key people enter and he tunnels through another barrier. His sister Bridgette kept him fed and safe. In elementary school a friend two years older, Darin Brown, was an inspiration, intellectual companion, protector from bullies and “the person who made me feel good about being smart”. Occasionally going to live in “backwoods Mississippi” with aunts, uncles and cousins, Oluseyi learned work habits that he says served as a training ground for life as a research scientist. He excelled at the tuba.
But when he joined all-Black Tougaloo College in Mississippi, after leaving the navy, Oluseyi was underprepared for the work required. He sold pot on campus supplied by his dad, and spent days holed up in his dorm room smoking crack cocaine. He had a disabled son with a woman who ultimately rejected him, but later began a new relationship with a woman who is now his wife.
After dropping out and working as a janitor for some months, Oluseyi re-enrolled with a new attitude, improved his grades, double-majored in physics and mathematics, and was accepted to graduate school at Stanford University as a diversity admission. There, he was required to take two years of undergraduate physics before any graduate classes. Yet drugs still haunted Oluseyi on all-night ventures out with friends, and he ultimately failed his graduate school qualifying exams, twice. He was allowed to stay only because his research group adviser, the solar physicist Art Walker, wanted him to.
Finally, out again late one night, he was robbed and had a gun held to his head by a 14-year-old thug, but the chamber was apparently empty when the trigger was pulled. Terrified, Oluseyi confessed to Walker and to his wife, and finally changed his ways. He went on to become Walker’s senior research assistant, co-authoring several papers on solar physics and earning his PhD in his early 30s.
There’s no doubt Oluseyi’s life’s narrative is intriguing and even mesmerizing. I was readily pulled through this well-written book, with its short chapters, one per story. At many points I wanted to grab the young Oluseyi and shake him and point him in the right direction, so stark and shocking were his mistakes. I found myself invested in his character and, just when I’d get my hopes up, he’d disappoint with another drug binge or failed exam, only to come back ready to try again.
Like Oluseyi, this book succeeds in its arc: an exceptionally candid and gripping portrayal of a remarkable life.
2021 Ballantine Books, Penguin Random House $28hb 368pp
Materials scientists in China have used a novel electrically responsive fluid to create an adaptive liquid lens. The lens has a convex shape that changes its curvature when a voltage is applied, changing the lens’ focal length. The researchers say that this gives the lens eye-like functionality that could be used to create ultrathin lenses that can quickly adjust their focal point.
The human eye changes its focal length by changing the shape of the lens. The contraction and relaxation of ciliary muscles bends and changes the curvature of the lens. This allows you to rapidly switch from focusing on something close, like your phone, to something much further away, such as someone approaching from a distance. Inspired by this functionality, researchers at Hefei University of Technology used a new electrically responsive liquid, called dibutyl adipate, to create a liquid lens that can adapt and change its shape in a similar way. They describe the new lens in Optics Letters.
Dibutyl adipate has an electronegative molecular structure, meaning that it has a tendency to attract electrons. This means that if it is placed in an electrical circuit it will travel with the electrons towards the anode and accumulate on its surface. It is also transparent, making it ideal for use in a liquid lens.
To create the lens, Miao Xu and her colleagues filled an annular electrode with dibutyl adipate. The inside of the electrode was coated with a water-repelling layer that pushed the fluid away from the outer surface to form a convex, or dome, shape. When the researchers applied a direct current to the dibutyl adipate liquid, it moved with the charge towards the outer surface, the anode, causing the dome to drop and its shape and curvature to change. The shape of the convex surface is dependent on the voltage applied, and when the electric field is removed, the dibutyl adipate fluid returns to its original state and shape.
The researchers found that when they increased the voltage from 0 to 100 V, the focal length of the lens changed from 7.5 to 13.1 mm. Analysis showed that the resolution of the adaptive liquid lens can reach almost 29 lines/mm, which is higher than that of the human eye. This performance remained stable at temperatures ranging from room temperature to 100°C and the lens transmitted around 95% of visible light at wavelengths between 390 and 780 nm.
Its simple structure and excellent imaging properties make dibutyl adipate a promising candidate for fabricating novel adaptive liquid lenses, according to the researchers. As such lenses would be lightweight and compact, they could prove ideal for mobile phone cameras, endoscopes and machine vision applications.
“We developed an eye-like adaptive liquid lens that can be used to diverge or converge light by changing the shape of the dibutyl adipate liquid,” Xu says. “This type of adaptive liquid lens could one day replace conventional solid lens systems. This would enable a mobile phone camera that can rapidly change focal length while still being as thin as the phone itself.”
The researchers are now working to improve the performance of the lenses. Currently the response speed is a little slow, and they are also investigating ways to reduce the voltage needed to adjust the focal length of the liquid lens.
Glasses have long fascinated materials scientists because they are classed as extremely high-viscosity liquids, yet their macroscopic material properties mostly resemble solids. Now researchers in the US and China have studied how metallic glasses flow by measuring their shear stresses to strain rates over nine orders of magnitude. They found a universal scaling law, which applies to other glasses, foods, soils and even ant colonies.
Glasses are difficult to model because they appear to comprise flowing molecules that have suddenly lost the energy to flow and are locked into a disordered, non-equilibrium state. Scientists refer to this as a glass transition. However, unlike a change of state from liquid to solid – which is easily defined as the formation of an ordered atomic lattice – a glass transition is nebulous and very difficult to define in terms of changes in the ways a material can deform in response to stress.
It has been observed that the stained-glass windows in old churches are often thicker at the bottom than at the top. This has led to the controversial idea that this glass has been flowing downward very slowly over centuries. However, glasses tested on laboratory timescales do not do this, but instead behave like brittle solids that usually break before they bend.
Atoms, not molecules
Now, the materials scientist Mingwei Chen of Johns Hopkins University in the US and colleagues at Shanghai Jiao Tong University in China have investigated further by studying metallic glasses: “If you deal with silica glass or organic glass or polymer glass, you’re talking about molecules,” explains Chen; “and for molecules the vibrations and the dynamics are much more complicated. We started from metallic glass because you can just deal with single atoms.”
To produce low strains, they clamped a metallic glass cantilever at one end and pressed a diamond tip called a nano-indenter into the other. By measuring the rate at which the resulting stress decreased over time, they could infer the capacity of the atoms in the glass to flow in response to the applied stress. For higher stress measurements, this kind of technique would simply have broken the cantilever or flattened it completely. Instead the researchers pushed the tip of the nano-indenter into the centre of a wedge of glass, pressing it in a known distance and monitoring the change in stress over time.
To confirm that the two techniques gave the same results, they measured the stress response to intermediate strain rates using both techniques, finding perfect agreement. This allowed them to join their two graphs together, mapping out the relationship between stress and strain rates over nine orders of magnitude.
Liquid to solid
Their results suggest that, at low strain rates, the glass behaves as a Newtonian fluid, with stress proportional to applied strain. At intermediate strain rates, the material behaves as a non-Newtonian, viscous-elastic fluid. Finally, at high strain rates, the atoms become almost unable to relax any further because they lack the energy to rearrange quickly enough. The system therefore behaves like a solid.
The researchers compared these results with measurements made on a wide variety of other substances ranging from polybutadiene rubber to mayonnaise, soil, and aggregations of fire ants. They believe that all these “glasses” appear to follow a universal scaling law in which the transition from liquid-like to solid-like behaviour is regulated by a constant relationship between temperature, density, stress and strain rate.
Earthquake zones
The work has already found applications: “Two years ago, we used exactly this equation to produce a super-high melting temperature metallic glass – it can be used at over 1000 °C,” says Chen. Beyond this, understanding and potentially controlling the conditions that lead to soil liquefaction under stress could be very useful in earthquake zones.
Donald Stone, a materials scientist at the University of Wisconsin-Madison, describes the research as “kinda cool”. He adds, “You might expect that if you look at the properties of a glass…then something governs the stress scale and something governs the strain rate scale, so if you can normalize the two things for all different materials you get a universal behaviour. In retrospect it wouldn’t surprise me, but I think it’s fairly profound.”
However, he adds: “I’ve done experiments on metallic glasses whose properties can be changed by annealing [heating followed by slow cooling]. It’s not clear how this [research] applies because I could change the stress scale [without changing] the strain rate scale.”
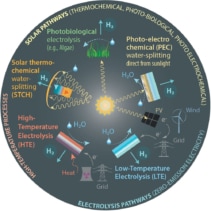
This webinar introduces a refined and updated view of the concept of the colours of hydrogen based on a survey of many recent reports and roadmaps on hydrogen. As a versatile, colourless molecular energy carrier with great potential to decarbonize multiple sectors and help reach net-zero emissions, there has been a renewed interest in improving and expanding hydrogen production with minimal or zero impact to the environment.
The conventional wisdom to categorize hydrogen production methods relies on colours that are associated with the technology pathways and their net carbon-emission impact. Despite some confusion arising from ill-defined associations, the concept of hydrogen colours has been gaining popularity due to the simplicity of such associations. This talk aims to de- mystify these colours by embodying an expanded palette that reflects both existing and emerging (advanced) pathways to contribute to the ongoing conversation, and efforts toward promoting and supporting the research, policy and regulations on realizing the clean hydrogen vision.
DrAhmet Kusoglu is a staff scientist at Lawrence Berkeley National Laboratory (LBNL), working on polymeric and functional materials for hydrogen and clean energy applications. His research focuses on the characterization of ion-conductive polymers and solid-electrolyte interfaces for energy conversion and storage devices, and related electrochemical-mechanical phenomena. He received his PhD from the University of Delaware and did his postdoctoral research at LBNL on fuel-cell membranes. He has published more than 70 peer-reviewed journal papers and two book chapters, and given more than 30 invited talks and tutorials at international meetings, academic and industry forums. He is the recipient of the 2017–2018 ECS Toyota Young Investigator Fellowship and 2016 ECS Srinivasan Young Investigator Award. He participated in Department of Energy Consortia on Hydrogen including HydroGEN, FC-PAD, and H2NEW. Kusoglu served as the thrust co-ordinator in the Fuel Cell Performance and Durability Consortium, and is currently communications director of the Million Mile Fuel Cell Truck (M2FCT) Consortium. His interests include data-driven material design, decarbonization of transportation and data visualization.
The world’s first optical oscilloscope – an ultrafast device for measuring the electric field of light – has been constructed by researchers at the University of Central Florida (UCF), US. The new instrument works by converting light oscillations into electrical signals and could help advance communication technologies.
Measuring the electric field of light is difficult because of the high frequencies at which light waves oscillate. While today’s most advanced techniques can “read out” electric fields that oscillate at gigahertz frequencies (covering the radio and microwave regions of the electromagnetic spectrum), light waves oscillate much faster than this. As a result, current instruments can only resolve the average signal associated with a pulse of light, not the peaks and troughs that exist within a single pulse. This is an important shortcoming because it is exactly these peaks and troughs that are used to carry data, for example in optical waveforms sent down a fibre-optic cable.
Ultrafast gates
To characterize such optical waveforms completely, photonics experts need an ultrafast gate that operates within one half-cycle of whichever field oscillation they wish to measure. In most techniques – including electro-optic sampling (EOS) and attosecond streaking, to name but two – researchers achieve this by using few-cycle sampling pulses that have much shorter wavelengths than the field they are trying to characterize.
Recent studies, however, have revealed that other techniques, including tunnel ionization, higher-order harmonic generation or multiphoton excitations in solids, can be used to make a sub-cycle gate. In this nonlinear optics approach, the laser field itself becomes the measurement tool.
TIPTOE toward success
In the new work, which is described in Nature Photonics, the UCF team showed that the nonlinear photocurrent created in a silicon-based image sensor when intense mid-infrared pulses are shone onto its surface can also provide such an ultrafast gate. This experimental measurement is an extension of a technique known as TIPTOE, which stands for tunnelling ionization with a perturbation for the time-domain observation of an electric field. In this technique, the researchers use an intense “fundamental” pulse with a (central) wavelength of 3.4 microns to create packets of charge carriers (electrons) in the pixels of the silicon-based image sensor by exciting multiple photons. This is what produces the photocurrent.
According to the team, being able to resolve the electric-field waveform of a few-cycle light pulse in a single shot holds numerous possibilities for fundamental physics, where it could be used to resolve light–matter interactions that take place on a timescale of attoseconds. “Fibre-optic communications have taken advantage of light to make things faster, but we are still functionally limited by the speed of the oscilloscope,” team leader Michael Chini says. “Our optical oscilloscope may be able to increase that speed by a factor of about 10,000.”
The Joint European Torus (JET) nuclear-fusion experiment based in Oxfordshire, UK, has more than doubled the amount of fusion energy produced in a single “shot” – smashing a previous record that JET has held since 1997. Officials today announced that during an experiment in late 2021, JET achieved 59 megajoules (MJ) of fusion energy, beating the previous record of 22 MJ.
JET, which was built in 1983, is operated by the Culham Centre for Fusion Energy (CCFE) – the UK’s national fusion research laboratory. It is a fusion reactor that uses magnetic confinement to hold a hot plasma reaching temperatures of 150 million kelvin, 10 times hotter than the centre of the Sun.
Fusion, which powers stars, occurs when two light nuclei, such as hydrogen and its isotopes, fuse together to produce a heavier nucleus while releasing energy. Designed to study the conditions approaching those in a fusion power plant, JET is the only device currently operating that can use the deuterium–tritium fuel mix, of the kind that will be used for commercial fusion power.
Experiments on JET are funded by the EUROfusion consortium of 30 member institutes from across Europe including the UK, Switzerland and Ukraine. JET famously carried out the world’s first controlled release of deuterium–tritium fusion in 1991. Six years later it produced a five second shot that produced 22 MJ of total energy and a peak 16 MW of fusion power for about 0.15 seconds. As the pulse was driven by 25 MW of input power, this gave a ratio of fusion power to heating power as 0.64 – a world record that remains today.
Record breaking
Following that experiment, JET went back to using a deuterium plasma and much of JET’s work has been in preparation for the ITER experimental fusion reactor, which is currently under construction in Cadarache, France. This includes plasma-physics research, systems testing and materials investigations. A £60m upgrade to JET was completed in 2011 that involved replacing the carbon tiles from the inner reactor wall with beryllium and tungsten – to test the materials that ITER will use. ITER will begin deuterium–tritium experiments in December 2035.
Plasma shot in JET on 21 December 2021 that released a record 59 megajoules of fusion energy. (Courtesy: EUROfusion consortium)
Over the past few years, JET has been upgraded to begin operating with tritium again and on 21 December researchers at the facility created a deuterium–tritium fusion shot that produced an energy of 59 MJ over five seconds.
The 11 MW produced (with 40 MW of input power) is lower than that achieved in 1997, resulting in a ratio of fusion power to heating power of about 0.3. However, the power was sustained over a longer period of five seconds. Indeed, officials say that they now want to focus on producing “sustained” fusion energy rather than optimising a brief peak performance.
“These landmark results have taken us a huge step closer to conquering one of the biggest scientific and engineering challenges of them all,” says Ian Chapman, chief executive of UKAEA. “It’s clear we must make significant changes to address the effects of climate change, and fusion offers so much potential. Our world needs fusion energy.”
Future aims
When it begins using deuterium and tritium in 2035, ITER will seek to generate about 500 MW over 300 seconds using a plasma heating of 50 MW, and the results by JET agree with predictions and give confidence that ITER will work as planned.
“A sustained pulse of deuterium–tritium fusion at this power level – nearly industrial scale – delivers a resounding confirmation to all of those involved in the global fusion quest,” noted ITER director general Bernard Bigot. “For the ITER project, the JET results are a strong confidence builder that we are on the right track as we move forward toward demonstrating full fusion power.”
The CCFE says that the experience of operating with tritium is also helping to prepare to operate a new facility on the Culham campus – H3AT – that will be one of the largest R&D facilities for tritium in the world once opened in 2024. It will be required when the UK’s prototype fusion power plant – Spherical Tokamak for Energy Production (STEP) – comes online in the 2040s.
Warning: this article contains discussions of mental illness, depression and suicide.
This article is the result of the powerlessness I have felt within the mental-health system. Of my despair, hopelessness and rage. I have used these emotions as fuel to ignite every last neuronal connection that remains from a life devoted to learning. If you find any of what follows coherent – and perhaps even compelling – you should know that it was written by someone who is, after more than a decade, still mentally ill.
Delusion permeates my mind like a hall of mirrors. Even supposedly simple tasks, such as cooking a meal or brushing my teeth, take huge amounts of energy. Over the last two years I have not ventured further than two streets from my home. My chronic dial tone of background anxiety confines me within these walls – and this is the best I have felt in years.
I first started suffering from depression in 2010 and my situation slowly worsened until the start of the second year of my PhD in autumn 2015. It was then that my doctor prescribed me with the drug Sertraline, which was the first anti-depressant I had ever been given. On Halloween 2015, four days after starting the drug, I found myself in the foetal position, shaking uncontrollably, a sensation of liquid fear surging through my brain. Having never had any symptoms of anxiety before, I was now experiencing almost all of them, in their most severe form.
I stopped the Sertraline and took a break from my work, but the symptoms remained. Over the next eight months, using a number of therapies, including meditation and counselling, I managed to assemble a Frankenstein brain, capable of going back to my PhD. I cannot emphasize enough the sheer ridiculousness of what I was doing. I felt like I should have been locked in a padded cell or dead. Instead, I managed to finish my doctorate in September 2019, at which point I collapsed with exhaustion.
Like every counsellor I have ever had, I too thought my problem could be solved solely through talking. I was wrong. My mental illness did need to be treated with medication. After my PhD, there followed a long slog of treatments, each one thrown at me as if by a blindfolded darts player. Some at least nearly hit the dartboard. But although my recovery has slowly progressed, I cannot say that my experience of the mental-health system has been good. In fact, from my perspective as a physicist, the way it operates is bizarre, awful and completely unscientific.
Most articles criticising the mental-health system tend to be written by those who are no longer mentally ill or by professionals who have experience treating such people. This article, in contrast, was written by me, during my mental illness. It contains the emotion, the vitriol and the anger, of someone wronged. I cannot express how difficult this article has been to write. So to those of you taking the time to read these maddening lines of text, I appreciate it.
From my perspective as a physicist, the way the mental-health system operates is bizarre, awful and unscientific
How it all began
My interest in physics started as a child after growing up with an older sister who suffered from Rett syndrome. It’s a rare and severe disease that debilitates the individual with a host of neurological and physiological problems. In trying to find out more about the condition, I realized I had a deep thirst for answers about the nature of reality itself. In 2011 I therefore started an undergraduate degree in physics at a university in the UK, hoping afterwards to go into research.
Knowing how hard it would be to get a place on a PhD, I started studying long into the night, reading everything I could find. But despite giving it my all, I didn’t end up with better grades. Everything just got harder. I felt emptier and emptier as the colour of my emotions started evaporating from my life. At the first signs of depression, I went straight to my doctor. I talked to him like a typical teenager – as if how I was feeling was the worst thing a person could ever experience.
The doctor and I had a very long conversation, but I only remember one thing he said: “You don’t know what other people are going through – there are a lot of people suffering out there.” His intention, I suppose, was to provide some context for my obvious lack of awareness. And given that most other students in his surgery were in all likelihood worse off than me, I thought they were wise words. A decade later, however, and I am probably in a worse state than all of them (at least those who are still alive).
Indeed, my journey into mental illness has been littered with that same goddamn phrase: “You don’t know what other people are going through.” The last time it was said to me, I was literally on my knees, in pure agony. I desperately needed someone to listen and provide some relief, or at least the hope of relief. If it were not for the stubborn support of my family, and my own dogged resistance to despair, I would certainly by now be dead.
But my greatest fear is not death. It is leaving this world without sharing what I have learned. It is a burden I do not want to carry any longer. It has made fighting my illness twice as hard and I do not want my suffering to have been a waste. The loss of one’s voice – and not the suffering itself – is one of the most distressing things about going through severe mental illness.
Furthermore, I want help. I am not completely better yet and I still do not understand what happened to me after my severe reaction to Sertraline, which is statistically one of the safest anti-depressants on the planet. What’s more, why have none of the 10 psychological and psychiatric experts involved in my treatment ever shown the slightest interest in trying to figure it out? As a scientist, I find this egregious.
All talk, no data Despite seeing five separate psychiatric professionals during his struggles with mental illness, Alexander Mendelsohn is astonished that none of them has taken a single quantitative measurement or test on him. (Courtesy: iStock/turk_stock_photographer)
My PhD life
After graduating in 2014, I was lucky enough to be accepted onto a PhD in experimental physics in electron crystallography. It had always been my dream to do some “proper” research, but I quickly realized I was way out of my depth. Like many other new PhD students, I was taken aback by just how much rigour goes into experimental work.
“Did you check this?” my supervisor would ask. “Or what about that?” Knowing I hadn’t checked any of those things, I stood there with a feeling of dread, fully aware of what was about to transpire. “Well, we’ll have to redo the experiment then,” he’d say – knowing full well that by “we” he meant “me”. Fortunately, I had access to one of the most precise and accurate electron microscopes in the world. I made plenty of mistakes but at least they were good-quality mistakes and eventually I got data worthy of publication.
But far from finding it easy to interpret our observations and reveal new secrets about the world, my supervisor and I could make neither head nor tail of the results. Noise, complexity or just plain ignorance prevented us from seeing what was right in front of our eyes. Eventually, after plenty of wrong simulations, wrong hypotheses and wrong ideas, we got our answer. I was glad to get a publishable and, to me, interesting result.
In contrast to my rigorous physics experiments, however, what astonishes me is that absolutely no-one has ever taken a single measurement or test on me during my fight against my mental illness. In its place have been interviews, questionnaires, biases and opinions. I have been seen by five separate clinical psychiatric professionals, who in the space of half a decade have given me 10 different formal diagnoses (see box below).
I spent countless sessions with psychiatrists, using the flawed theories of Sigmund Freud. “So, tell me about your childhood,” they’d invariably begin, ignoring what I saw as a crucial and definitive piece of information (my severe reaction to Sertraline) before wandering along a path of relative obscurity. It was as if the professionals were asking these strange questions out of necessity rather than any specific purpose. Often, it seemed as though half of my assessment was irrelevant to the treatment the psychiatrist was going to suggest.
These questions about my personal life reminded me of another treatment I went through during my PhD. Called “psychodynamic therapy”, it is all about redefining “your story” (for lack of a better phrase). It’s an in-depth process requiring multiple one-hour sessions before a reasonable picture of an individual’s problems can be built up. And yet psychotropic drugs – the main tool psychiatrists seem to use to treat patients – are only given to treat symptoms rather than any underlying psychological traumas. Some psychiatrists I saw even used their assessment of my symptoms to concoct a condition as if out of thin air, before recommending a treatment based on that.
Diagnoses given to Alexander Mendelsohn
Previous serotonin syndrome on selective serotonin reuptake inhibitor (SSRI)
Recurrent depressive illness
Most probably on the bipolar spectrum
Current presentation does not meet criteria for affective disorder
Chronic nature of low mood since childhood
Possible features of autism spectrum disorder (ASD)
Mixed anxiety and depressive disorder
Traits of highly anxious personality with alexithymia
Severe depressive illness
History of repetitive transcranial magnetic stimulation (rTMS) induced hypomania
It has transpired that diagnoses 1, 2, 7 and 9 are likely to be associated with the author’s mental illness, while diagnoses 3, 4, 5, 6, 8 and 10 are unlikely to be linked.
Self-diagnosis
Given my lack of success with these traditional methods of diagnosis and, after years of explicitly telling clinicians about my symptoms of anxiety, I ended up diagnosing myself with what’s known as generalized anxiety disorder. It is a condition where you experience a collection of anxiety symptoms, which can range from a fast heartbeat to a background sensation of impending doom, unrelated to specific events. Having spent so many years trying treatments that either didn’t work or made me feel worse, I simply felt forced to take control. Quite frankly, the people who were supposed to help me were driving me towards death – and I didn’t want to die!
I have never received a formal diagnosis of generalized anxiety disorder, but it’s the one illness that my symptoms matched the best. I therefore looked up the guidelines from the UK’s National Institute for Health and Care Excellence (NICE) for how to treat the condition and, in May 2021, asked my psychiatrist to prescribe me Pregabalin. This medication has been the first treatment to have significantly lowered my background anxiety, which is the main symptom of my disease.
Drug treatment Alexander Mendelsohn’s mental-health problems could be treated with appropriate medication – but he felt that drugs were prescribed to him in an almost entirely haphazard way. (Courtesy: iStock/apomares)
I had been terrified at the notion of using my defective brain in a field I feel completely lost in. But when I – a mentally ill physicist with no medical training – appeared to be doing a better job than the professionals, I became pretty concerned about the state of treatment for mental illness. My exasperation is not, however, directed at any individual within the mental-health system. Instead, the question I have endlessly asked myself is “Why has no-one taken any measurements of my brain?”
I had something the clinical experts didn’t: a direct (though poor and subjective) measurement of the workings of my brain, formed through my own experience. Pretty much every clinical expert I have seen has told me their view of how my brain worked, and they were stupendously wrong. The contrast with physics is huge, where the more accurate, precise and direct a scientific instrument is, the greater the understanding that can be derived.
Electron crystallography, for example, started off as a mostly qualitative technique with physicists unable to tell where one blob of intensity in a diffraction pattern began and another ended. But by the time of my PhD, the technique had advanced so much that I could see all sorts of weird and wonderful features in the diffraction patterns. It was a quantitative science, allowing many more physical phenomena to be studied, simulated and modelled.
I was therefore greatly disturbed to discover that the nature of my mental-health treatment consisted entirely of generalizations and guesswork. Surely, I thought, neuroscientists would have realized how important it would be to develop technology that can – directly and non-invasively – detect action potentials in the human brain. Such a technique would revolutionize the field overnight. But the only project I am aware of that’s trying to develop new tools to improve our understanding of brain activity is the US National Institute of Health’s BRAIN initiative. And despite being a multi-million-dollar programme, the original paper on it has been cited fewer than 300 times in nearly 10 years.
How can it be that we can land a rover on Mars with a jet-pack, yet do not have a single quantitative measure of any mental illness?
Quantifying mental illness
How can it be that we can land a rover on Mars with a jet-pack, yet do not have a single quantitative measure of any mental illness? The effectiveness of treatments are currently measured by psychiatrists using questionnaires and rating scales, which seem pitifully inadequate. In the Hamilton Depression (HAM-D) rating scale, for example, patients are asked to answer a set of 17 multiple-choice questions on a scale of zero to four, with the total indicating the severity of their depression.
The HAM-D, which is one of many rating scales, is generally accepted as the “gold standard” for objective measurement of the severity of depression. But from my perspective as a mentally ill physicist, psychiatric research appears to be purely based on social science. Patterns are revealed, but no definitive conclusions are ever drawn. The best that can be hoped for is associations, with no way of proving causation.
That concerns me greatly, for two reasons. First, mental-health conditions are inherently complex. Second, and more importantly, they are all relative. In my own case, I cannot give an objective measurement of how severe my condition is – and certainly not with something as silly as the five-point HAM-D scale. All I know is the things I can no longer do and the symptoms I currently have.
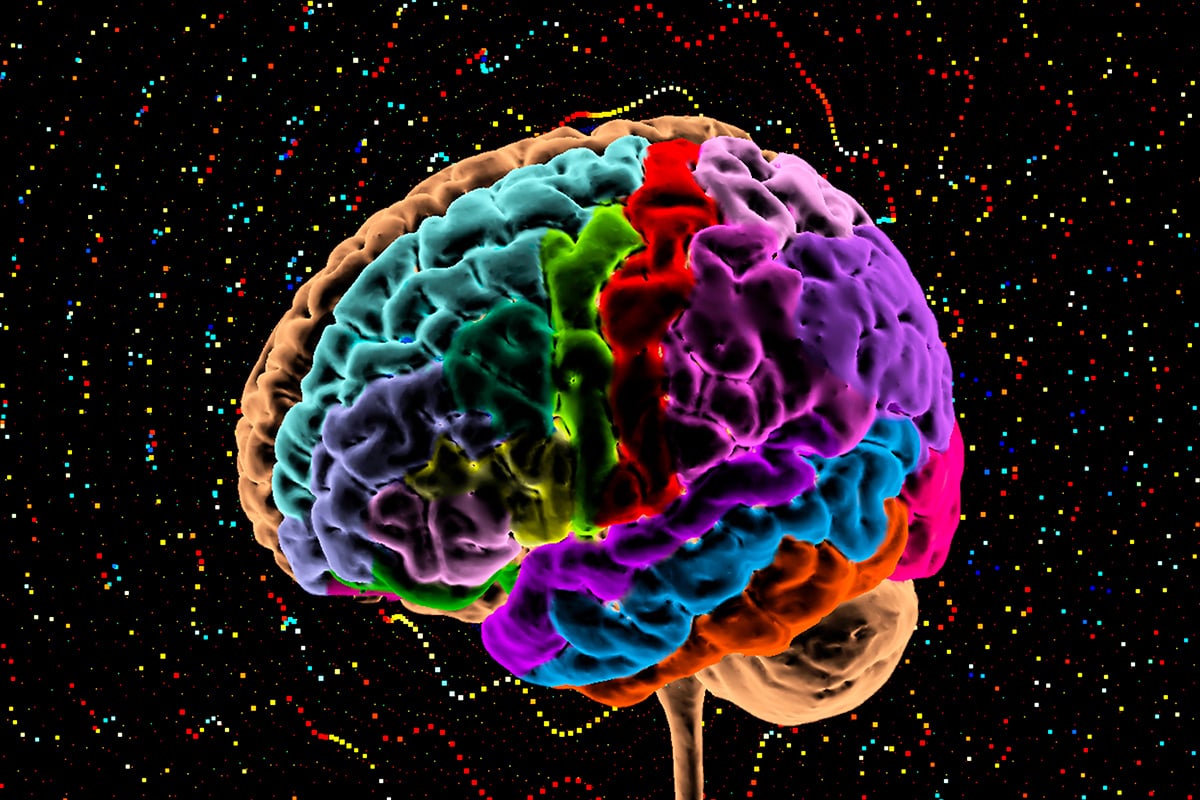
Brain power People with mental-health problems who suffer particularly extreme medical conditions are often dismissed as “outliers”, but could quantitative studies of them – for example through functional magnetic resonance imaging and other physics-based techniques – help us to get a better understanding of mental illness? (Courtesy: K H Fung/Science Photo Library)
Even sadder, I simply don’t know what remission feels like. I have learned that my mood is the ground that my internal reality is built upon. When my mood became corrupted, my reality changed with it, which is horrible. Spend a long enough time in a mental illness, and you believe that this is all there is and ever will be; it’s brainwashing from within. This is why I believe measurement is so important: a number, a scan, whatever it may be, showing that something is not right. A reminder that you are actually sick, in a world that doesn’t understand why.
It was only once my condition improved that I could gain some understanding of my personal reality and how it could shift. It’s the same in physics. Examining what appears to be an exception to the rule allows progress in defining the rule. Through these vast differences, the underlying laws that define nature are much clearer for physicists to see. Black holes, for instance, are extremely rare cosmic objects, but by taking measurements inside and just outside these unusual bodies, theories of quantum gravity can be tested as fully as possible.
I do not, however, see this contrast in most psychiatric treatment research trials. In fact, I see intentional blurring of contrast. This is the problem with statistics. While it may be possible to spot objective trends out of a group of trial participants, it cannot tell you anything about any one participant within that group. Surely the ultimate aim of psychiatric treatment is to ensure that when a specific patient is given a treatment (or combination of treatments) it achieves remission of all their symptoms?
Data, please
It seems to me that the best-case scenario resulting from current psychiatric methods is a solution that only partially works, for the greatest number of people. At least that is what it looks like from my ignorant position. It’s like the old joke about someone who’s dropped their keys in a dark underpass, then climbed up and started looking for them under a lamppost because the light there is better. Except in this case, the person has also used a torch just to make sure it is bright enough.
In the medical literature, there are thousands of case studies describing strange, extreme and weird conditions or medical reactions. But I have not yet read about a single measurement being taken after the clinicians have finished treating the patients in these studies. There seems to be a bias in clinical research to stop scientific inquiry once a patient is better. Why not ask them if they want to contribute to science? A DNA sample, EEG, an fMRI, anything!
My physics brain is telling me that these people – these extremely unfortunate yet wonderfully odd people – might hold the key to countless conditions. They provide the contrast not found in trial after trial of carefully selected patients with the “average” presentation of the condition in question. In my case, for example, why not examine the contrast between two people who have completely the opposite reactions to low doses of Sertraline (such as case studies 10895401 and 20661029 on the PubMed database).
There is an idea that the scientific method must always be carried out in a certain well-defined way. But this has not been my experience. Physicists are trained to think from the bottom up – to use our imaginations to question previous fundamental assumptions and methodologies. We are taught to “fail forward”; that is, to try something outside of the box in order to find where the walls lie. As Richard Feynman once put it: “The test of all knowledge is experiment. Experiment is the sole judge of scientific truth.”
Brain–machine interfaces provide a bridge between the human brain and external software or hardware. Such systems detect the brain’s electrical signals and translate them into commands for electronic systems such as a computer or robotic arm. The neural signals can be collected non-invasively using electroencephalography (EEG) electrodes attached to the scalp.
Recently, researchers have developed EEG sensors made from graphene, which offers excellent conductivity and biocompatibility. Graphene-based biosensors, however, often have low durability, corroding upon contact with sweat, and exhibit high skin-contact impedance that hampers the detection of signals from the brain. A novel graphene-based biosensor developed at the University of Technology Sydney aims to overcome these limitations, detecting EEG signals with high sensitivity and reliability – even in highly saline environments.
The sensor, described in the Journal of Neural Engineering, is made from epitaxial graphene (EG) grown on a silicon carbide (SiC)-on-silicon substrate. This structure unites graphene’s favourable properties with the physical robustness and chemical inertness of SiC.
“We’ve been able to combine the best of graphene, which is very biocompatible, very conductive, with the best of silicon technology, which makes our biosensor very resilient and robust to use,” says senior author Francesca Iacopi in a press statement.
Performance testing
To create the new biosensor, Iacopi and colleagues used highly doped silicon substrates coated with a roughly 500 nm-thick film of cubic SiC; they then deposited layers of EG directly onto the SiC surface. They fabricated five of the EG-based sensors and tested each more than 10 times.
The researchers first characterized SiC and the EG-on-SiC films in a three-electrode cell set-up, using 0.1 M salt solution (to mimic sweat) as the electrolyte. They used electrochemical impedance spectroscopy (EIS) to quantify the transfer impedance between the electrodes and the electrolyte. The EIS curves indicated an improved transfer impedance for EG after 100 cycles, compared with both the initial EG cycle and the reference SiC films.
To evaluate the EG sensor for on-skin applications, the team measured the skin-contact impedance, which has a crucial effect on the performance of EEG sensors. The sensor was mounted on a pin button connector and placed on a volunteer’s forearm in a three-electrode configuration. On-skin EIS measurements showed that the contact impedance between the graphene sensors and the skin reduced drastically after repeated testing.
While the EG sensors did not show particularly low skin-contact impedance in the first test, by the third sequential test this had reduced drastically, stabilizing at 130±10 kΩ at 50 Hz. The researchers note that this value is far lower than that of two commercial dry EEG sensors tested in the same configuration: a spring-loaded pin sensor and a conducting foam sensor, which exhibited skin-contact impedances of around 830 and 665 kΩ, respectively.
“With our sensor, the contact resistance improves when the sensor sits on the skin,” Iacopi explains. “Over time, we were able to achieve a reduction of more than 75% of the initial contact resistance. This means the electric signals being sent by the brain can be reliably collected and then significantly amplified, and that the sensors can also be used reliably in harsh conditions, thereby enhancing their potential for use in brain–machine interfaces.”
The researchers attribute this improvement after prolonged skin contact to the formation of oxygen functional groups on the graphene grain boundaries, which lead to the formation of a thin layer of physisorbed water covering the grains. They refer to this newly observed phenomenon as “surface conditioning”, noting that the effect is consistent and repeatable, countering the natural hydrophobicity of graphene to obtain a better contact with the skin.
Tests on EG sensors in contact with a saline-soaked cloth showed similar behaviour to those on skin, but stabilizing at far lower contact impedance values (6.5±0.5 kΩ at 50 Hz). The team suggests that the presence of saline at the interface between the graphene electrodes and their contacts (skin or cloth) is beneficial for lowering the overall contact impedance and primes the surface conditioning effect.
EEG sensors typically detect signals from the brain using electrodes placed over the head. To examine the suitability of EG sensors for EEG signal collection, the researchers placed an EG sensor on a volunteer’s forehead. The skin-contact impedance on the forehead was 90±5 kΩ at 50 Hz, lower than that measured on the forearm.
Using an elastic headband to hold the sensors tightly to the forehead reduced the skin-contact impedance further, to 44±4 kΩ at 50 Hz. The team attributes this to the tighter sensor–skin contact, the harder contact surface offered by the forehead and the sweat generated underneath the headband.
Finally, the researchers mounted the EG-based EEG sensors on a brain–interface helmet system containing eight channels connected to foam sensors, replacing two channels at the forehead with the EG sensors. The EG sensors showed a similar blinking signal to the commercial foam sensors, indicating the potential of their use in future brain-controlled applications.
Iacopi and colleagues conclude that EG fabricated on SiC-on-silicon substrates can create robust and reliable electrodes with low contact impedance for brain–machine interfaces. They note that the surface conditioning effect could be exploited to develop a pre-conditioning procedure that further optimizes the sensor performance.
Older parents: Artist’s impression of a protoplanetary disc that has just formed around a binary star (left). The image on the right shows a large cavity that has been removed from the disc by a large planet. (Courtesy: N Stecki)
Even as they are dying, ancient stars in some binary systems may be forming planets, an international team of astronomers has found. Through infrared observations of old binary pairs, researchers led by Jacques Kluska at KU Leuven in Belgium discovered 10 cases in which giant planets have likely carved out empty cavities in protoplanetary discs. If more evidence is found for such systems, it could result in a rethink of current ideas about how planets form.
By observing the huge protoplanetary discs of gas and dust surrounding nascent stars, astronomers have developed a good understanding of how planets form. The process begins with matter in the disc clumping together to eventually form dense regions, which carve out distinctive, ring-shaped cavities in the disc. This process gives rise to fully formed planets just a few million years after the formation of the host stars.
However, protoplanetary discs have also been discovered in some ancient binary systems that contain a white dwarf. These stars have blasted away much of their atmospheres, which then surrounds the binary system. The gravitational interplay between the two stars can then cause the ejected matter to form a “second generation” protoplanetary disc in which planets could form.
Infrared emissions
To look for signs of planet formation in these second-generation systems, Kluska’s team focused on infrared emissions from discs. Previous studies of young protoplanetary discs suggest that infrared emissions decline as planets carve out cavities.
The astronomers analysed the emissions of 85 ancient binary systems in the Milky Way. They discovered that 10 of these binaries have a disc emitting lower levels of infrared light. This provides promising evidence that giant planets have begun to form around these dying stars.
In addition, they discovered that the surfaces of the dying white dwarfs in these systems had low levels of stable refractory metals – which have very high melting and boiling points. This suggests that dust particles rich in heavy refractory elements have been captured by newly forming planets, rather than falling back onto the star.
In their future research, Kluska and colleagues aim to directly observe planet formation in these 10 systems using the powerful telescopes available at the European Southern Observatory (ESO) in Chile. If successful, these protoplanetary discs will provide a unique opportunity for studying second-generation planet formation.