Routine eye scans could provide cost-effective screening for heart disease

Retinal imaging is routinely performed by opticians to diagnose and monitor eye diseases and disorders. But retinal scans can reveal a lot more: retinal microvascular abnormalities may be indicative of broader vascular disease, including problems with the heart. An international, interdisciplinary research team headed up at the University of Leeds has now developed an artificial intelligence (AI) system that can automatically analyse these routine eye scans and identify individuals at risk of a future heart attack.

Cardiovascular disease is the leading cause of early death worldwide. Early identification and preventative treatment could help reduce its prevalence. Currently, a patient’s risk of cardiovascular disease is estimated using parameters including age, gender, smoking status and family history, along with medical imaging tests such as coronary CT, echocardiography and cardiovascular MRI. Such imaging procedures, however, are usually hospital-based and can be expensive, limiting their availability in countries with less well-resourced healthcare systems.

“This [AI-based] technique opens-up the possibility of revolutionizing the screening of cardiac disease,” explains senior author Alex Frangi in a press statement. “Retinal scans are comparatively cheap and routinely used in many optician practices. As a result of automated screening, patients who are at high risk of becoming ill could be referred to specialist cardiac services. The scans could also be used to track the early signs of heart disease.”

Retinal scan

First author Andres Diaz-Pinto and colleagues investigated whether their AI system could use retinal images to estimate the mass and pumping efficiency of the heart’s left ventricle. An enlarged ventricle is linked with an increased risk of heart disease and can be used to predict the likelihood of a future heart attack, or myocardial infarction (MI).

To achieve this, the researchers trained a multichannel variational autoencoder and a deep regression network to estimate the left ventricular end-diastolic volume (LVEDV) and left ventricular mass (LVM) directly from retinal images. They trained and validated the two networks in this AI system on data from 5663 and 71,515 participants, respectively, from the UK Biobank Imaging Study.

The first data set had cardiac MR images, high-quality retinal images and demographic data, while the latter had only high-quality retinal scans and demographic data. Comparison with ground-truth delineations of the cardiovascular MR images demonstrated that the retinal images could be used to quantify these cardiac parameters.

Next, the researchers used the estimated LVM/LVEDV combined with the demographic data, as well as the demographics alone, to predict whether a patient was at risk of a heart attack over the subsequent 12 months. For this comparison, they used data from UK biobank participants with retinal images that weren’t used for the AI training: 992 cases in which MI had occurred after the images were taken and 992 non-MI cases.

They found that adding the estimated LVM/LVEDV to the demographic data improved the AI system’s predictive performance. The system predicted future MI events from retinal images with a sensitivity and specificity of 0.74 and 0.72, respectively, with just age and gender as additional variables (as would be available in an opticians or eye clinic).

Finally, the team performed an external validation using retinal images and demographic data from an independent dataset – the NIH Age-Related Eye Disease Studies – containing 180 participants with MI events and 2830 without. They found that the algorithm’s ability to predict MI was impacted by the presence of age-related macular degeneration (AMD) in the retinal images.

The predictive performance of the AI system was highest in cases without AMD, where the sensitivity and specificity were 0.70 and 0.67, respectively, and decreased in individuals with AMD of increasing severity. The team notes that the presence of retinal disease such as AMD, particularly in its more severe forms, interferes with the algorithm’s ability to infer systemic circulation characteristics from the retinal circulation.

The researchers conclude that AI system can estimate cardiac parameters and predict future MI events using inexpensive and easy-to-obtain retinal photographs and demographic data. They suggest that their approach could be used in eye clinics and opticians to identify patients at risk of future MI events and refer them for in-depth cardiovascular investigation.

The study is described in Nature Machine Intelligence.

Quantum sensor shrinks dark matter’s parameter space

Physicists in Israel have extended the search for dark matter by using a new kind of quantum sensor to place stricter limits on so-called axion-like particles. They did so by monitoring the precession of xenon atoms and exploiting what are known as Floquet states to probe a greater mass range than was previously possible. They are now optimizing their experiment to further enhance sensitivities.

Dark matter is thought to make up around 85% of all the matter in the universe, but beyond its gravitational interactions scientists still have little idea about it composition. Having tried in vain to detect weakly interacting massive particles (WIMPs) for several decades, physicists are increasingly focusing their attention on axion-like particles (ALPs). These are a general type of dark matter that are inspired by the original axion, which was put forward in the 1970s as a means of solving a problem with the strong force. ALPs are spin-zero particles that could in principle possess any possible combination of mass and interaction strength.

Researchers have carried out numerous experiments looking for the signs of ALPs morphing into and out of photons – using what are known as haloscopes, helioscopes and “light shining through a wall” tests – to no avail. Others seek to detect ALPs’ effects on nuclei, including several groups that are trying to detect the oscillating magnetic fields that would be generated by the coupling between nuclei and extremely light ALPs.

Xenon and rubidium

In the latest work, Or Katz at the Weizmann Institute of Science in Rehovot, Israel and colleagues use a detector consisting of a magnetically shielded small glass cell filled with atoms of xenon-129 and rubidium-85. Two laser beams are directed at the cell – one a pump beam that polarizes the rubidium’s electron spin and with it the xenon’s nuclear spin, and the other a linearly-polarized probe beam that measures changes to the spins.

Going by the snappy name of Noble and Alkali Spin Detectors for Ultralight Coherent darK matter (NASDUCK), the experiment relies on the oscillating field of any passing axions rotating the collective xenon spin and thereby causing the nuclei to precess at the field’s oscillation frequency. That precession is measured thanks to the rubidium atoms imprinting their subsequent polarization on the probe beam, whose rotated polarization axis is picked up using a pair of photodiodes – in effect turning the rubidium into an optical magnetometer.

By exposing the atoms to a magnetic field along their initial spin axis, the precession of the xenon spins can be blocked for all but a very narrow oscillation frequency centred around the nuclear magnetic resonance (NMR) frequency of the applied field. Variations in the latter therefore allow the researchers to scan a range of oscillation frequencies – corresponding to a range of ALP masses – and measure the response of the rubidium atoms at each new setting.

Frequency mismatch

There is, however, a mismatch between the NMR frequency and the electron paramagnetic resonance (EPR) frequency – which determines the rubidium’s response. This discrepancy becomes more of a problem at higher ALP oscillation frequencies, and therefore at greater masses. It was to relieve this problem that the researchers employed a Floquet field – a strong magnetic field that also varies in time.

Floquet fields induce a temporary splitting of quantized energy levels and have been widely used to control material properties such as band structure and gyromagnetic ratios. In particular, Dmitry Budker of the University of Mainz in Germany and colleagues last year showed they could use this mechanism to convert a low-frequency magnetic field into a higher-frequency maser emission – and from the latter measure the former. Katz and colleagues have now applied a similar measurement scheme to their ALPs detector by using a Floquet field with a frequency about equal to the difference between the NMR and EPR frequencies to in effect close the gap between the two.

Nearly 3000 measurements

The researchers made nearly 3000 measurements over a period of five months, each time incrementing the NMR field by about 0.2 mG. This allowed them to make several scans of the dark-matter frequency band between 1–1000 Hz, corresponding to ALP masses between 4×10-15 eV and 4×10-12 eV. The search (unsurprisingly) yielded no signs of dark matter, but it did allow them to push down the upper limit on ALP-neutron coupling above 4×10-13 eV by about three orders of magnitude compared to previous terrestrial searches – thanks to the Floquet field.

Katz and colleagues point out that still better limits have been set by astrophysical observations, but they argue that these are not as reliable as those derived from experiments on the ground. Observations involving the rate at which supernovae remnants cool, for example, rely on currently unknown mechanisms of supernova collapse. As such, they say, the resulting limits “should be taken with a grain of salt”.

In any case, the researchers are confident that they can beat the bounds from astrophysics – by pushing their own limits down a further two orders of magnitude or more. Such high sensitivities, they say, could in part be achieved by using low-noise ferrite shields to block stray magnetism and by sending the probe beam through the glass cell multiple times.

The research is described in Science Advances.

Independent QA: catching, understanding and correcting errors before radiotherapy begins

Independence is everything. For Sun Nuclear Corporation, a US-based manufacturer of QA solutions for radiotherapy and diagnostic imaging practices, independence is also non-negotiable, informing a product development roadmap that’s focused on relentless improvement in pursuit of patient safety, treatment outcomes and workflow efficiencies in the radiation oncology clinic.

Fundamentally, independent QA products and services enable the essential – and granular – auditing of the always evolving radiotherapy delivery system. That could mean the commissioning of a new treatment machine or clinical workflow; daily, weekly or monthly machine QA checks; as well as all aspects of patient-specific QA. At the clinical sharp-end, meanwhile, independent QA gives the radiation oncology team confidence that treatment is being delivered to the tumour site as intended while minimizing collateral damage to healthy tissues and organs-at-risk (OARs).

“There will always be residual risk from unforeseen failure modes in today’s complex treatment systems,” explains Jeff Kapatoes, senior director for regulatory and research at Sun Nuclear. That risk, he argues, is best addressed through independent QA to avoid any conflict of interest associated with the equipment maker’s machine self-checks. “As such, our goal is to give medical physicists the QA tools they need to do their job better as the independent auditors of radiation treatment and patient safety.”

Independent measurement

If that’s the back-story from the QA vendor perspective, what of the clinical customer when it comes to identifying – and mitigating – system errors in an expanding universe of complex treatment variables? Chris Bowen is one such end-user, a solo medical physicist working at Mosaic Life Care, a busy community clinic with two linacs providing radiation therapy services to a metro area of around 100,000 people in St Joseph, Missouri, US.

Chris Bowen

“Our radiotherapy QA effort at Mosaic is sourced almost exclusively from Sun Nuclear through its SunCHECK Quality Management Platform,” explains Bowen. In this way, SunCHECK – a single interface and database offering a unified, yet independent, view of patient and machine QA – is key to streamlining Mosaic’s radiotherapy workflows while maximizing patient safety (and throughput). Furthermore, Bowen’s work schedule now incorporates a heavy stereotactic treatment load, with up to 90 patients a year assigned for stereotactic body radiotherapy (SBRT) and another 40 or so patients for cranial stereotactic radiosurgery (SRS) procedures.

As the clinic’s SRS/SBRT programme gathered pace, Bowen needed a QA solution that would allow him to perform his patient-specific QA accurately and efficiently. The answer he settled on is Sun Nuclear’s SRS MapCHECK, a high-density diode array for patient-specific QA and end-to-end testing that’s billed as an “efficient digital alternative to film for small-field dosimetry”. Designed to insert into the StereoPHAN phantom, the SRS MapCHECK comprises 1013 silicon diodes, each with an active area of only 0.23 mm2, in a 77×77 mm effective measurement area – an arrangement that enables absolute dose measurement of field sizes as small as 5 mm with the tight spatial resolution (2.47 mm centre-to-centre) needed for SRS/SBRT.

For the medical physicist, the main benefits of the SRS MapCHECK include film equivalence, the ability to measure in the true composite geometry (including vertex couch rotations), proven small-field absolute dose accuracy, as well as ease of use and enhanced workflow efficiency. Think patient QA in minutes rather than hours as per film QA (which in turn requires tight process control to get consistently accurate absolute dose measurements). “For stereotactic treatments,” notes Bowen, “SRS MapCHECK delivery is what we hang our hat on as far as confirming whether a plan has been successfully QA’d. The device enables you to verify your targeting and dose distribution accuracy.”

The heart of the matter

With hundreds of SRS MapCHECK QA sessions completed, Bowen was accustomed to pass rates of 97% or higher, even with a 2%/1 mm gamma criteria. Towards the end of last year, however, following an upgrade to the treatment planning system (TPS) for Mosaic’s twinned linacs, those results slipped dramatically. Post-upgrade, the very first SBRT lung QAs presented with passing rates only in the mid-80% range, with the first SRS cranial case in the low-90% range – both far lower than normal. His first inclination was to test the SRS MapCHECK to see if something had changed in the array, so he ran several previous QAs and achieved nearly identical results to his initial runs (97% or higher).

Knowing it wasn’t the array, Bowen reached out to the linac manufacturer’s physics team, who traced the root cause to an error introduced in the latest software update (such that the TPS did not employ the user-selected 1 mm dose grid for SRS plan calculations, instead reverting to the planning system’s default 2.5 mm grid). What’s more, with no indication to the end-user, the TPS functionality for air-cavity correction had also defaulted to “off” in the same TPS update. “It wasn’t just our cranial SRS cases where we were seeing dosimetric QA anomalies,” explains Bowen. “Our lung SBRT cases were also not hitting the usual passing rates versus our gamma criteria.”

It’s worth adding that although Bowen uses the linac-vendor-supplied portal dosimetry (EPID) system as a secondary QA method, the machine’s EPID self-checks failed to pick up the TPS errors. In any case, after implementing manual workarounds to ensure the correct optimization, calculation preferences and grid sizes, Bowen’s SRS MapCHECK results reverted to their previous excellent passing rate. “The whole affair is a badge of honour for the SRS MapCHECK,” he notes. “Situations like this are why I have always used, and will continue to strongly support, QA systems that are independent of the manufacturer of our TPS and treatment delivery systems.”

This isn’t the first time that the SRS MapCHECK has picked up errors that may otherwise have gone unnoticed in the clinic. During the commissioning and twinning of Mosaic’s two linacs, the array also identified a 0.4 mm difference in the vendor-set physical leaf-gap settings of the respective multileaf collimators. “The SRS MapCHECK has become my QA gold standard,” concludes Bowen. “For starters, it’s an excellent patient surrogate, but it also offers a level of detail and precision that significantly enhance the fine-tuning of our treatment machines.”

Independent calculations

Like Mosaic Life Care, the team at the Nancy N and J C Lewis Cancer & Research Pavilion at St Joseph’s/Candler (Georgia, US) has implemented Sun Nuclear’s SunCHECK Quality Management Platform for machine and patient-specific QA. A key building block within the latter is DoseCHECK, a Collapsed-Cone Convolution Superposition algorithm for 3D analysis and MU/dose comparisons to identify clinically relevant deviations within the entire dose volume.

Last year, when performing a second check on an SRS plan with DoseCHECK, St Joseph’s/Candler medical physicist Joey Spring noted that the 2.5 mm dose grid in the DoseCHECK report did not match the 1 mm dose grid in the TPS. Spring initially reached out to the Sun Nuclear support team in an effort to shed light on the discrepancy, with subsequent investigations reviewing the plan information sent over from the TPS and the 3D RT-Dose file.

The conclusion: while the TPS reported a 1 mm dose grid being used, the actual plan was calculated at 2.5 mm. It turns out that St Joseph’s/Candler physicists had also recently upgraded their TPS and, thanks to independent QA via DoseCHECK, they had stumbled upon the same issue as Chris Bowen at Mosaic Life Care. To confirm the finding, Spring used the SRS MapCHECK to carry out pre-treatment dose measurements, with the same reduced passing rates reported by Mosaic Life Care.

Ultracold atoms move closer to simulating the early universe

Physicists could soon be able to do simulations of the quantum phase transition that is believed to have occurred in the early universe, thanks to ultracold atom experiments done by Bo Song and colleagues at the University of Cambridge. By shaking an optical lattice of atoms, the team created metastable states associated with discontinuous phase transitions and a process called false vacuum decay.

Familiar phase transitions like the boiling and freezing of water are driven by thermal fluctuations in a system. In contrast, quantum phase transitions occur at close to absolute zero temperature and are driven by quantum fluctuations – which are a result of Heisenberg’s uncertainly principle.

So far, most studies have focussed on “continuous” quantum phase transitions, in which systems transform smoothly from one phase into another. However, some quantum systems will undergo abrupt or “discontinuous” phase transitions where the system can remain frozen in a metastable state before undergoing a transition. This process is like a ball rolling down a slope and getting caught in a shallow dip on the hillside before the transition occurs. Moving beyond the dip is called a false vacuum decay and some physicists believe that such an event set off the period of cosmic inflation just after the Big Bang.

Insulator to superfluid

Quantum phase transitions have been studied using optical lattices, which trap ultracold atoms within standing waves of laser light. Song and colleagues use an optical lattice to create a Mott insulator, where the movement of atoms between lattice sites is suppressed by strong atom-atom interactions. The system can also exist in a higher-energy superfluid state in which the atoms can hop freely between lattice sites. Previously, physicists could observe continuous phase transitions in such systems with strong interactions, but not discontinuous transitions – which had only been seen in systems with weak interactions.

In their experiment Song’s team drove the phase transition by shaking (modulating the position of) the optical lattice. This causes the lowest band of the lattice – corresponding to its Mott insulator phase – to mix with first excited band – which hosts its superfluid phase.

Depending on the shaking parameters, the system either underwent a continuous or discontinuous phase transition between the Mott insulator and superfluid phases. In the case of continuous transitions, the mixing between the bands is strong so the Mott insulator phase and the superfluid phase can coexist. However, when the mixing between bands is weak, the two phases cannot easily coexist, and the system must choose one or the other in a discontinuous transition. Also, the system can get trapped in a metastable state and then undergo false vacuum decay.

Song’s team hope that their approach will open new opportunities to explore the role of quantum fluctuations in discontinuous phase transitions, and the quantum decay of metastable states. These investigations could include quantum simulations of false-vacuum decay in the early universe.

The research is described in Nature Physics.

Gaming on your phone could help cure cancer, Drake equation for finding love

Solving scientific problems by turning them into games is a popular strategy of citizen science projects, which use the brains of the public to do research in areas as diverse as astronomy and genetics.

The latest scientific task to be gamified is the creation of genomic reference maps for cancer cells. These maps allow researchers to pinpoint areas of a cancer-cell genome that could be targeted for therapy or are potential mutation sites.

Marc Marti-Renom and colleagues at the Centre for Genomic Regulation in Barcelona have developed a to create genomic reference maps by visualizing the genome in 3D space. Doing this, however, requires large amounts of time and resources to train artificial intelligence as well as vast amounts of computational power.

Solving puzzles

To allow the public to help, the researchers joined forces with game developers to create GENIGMA, which can be downloaded as an iOS or Android app. Players solve puzzles involving a string of blocks of different colours and shapes. Each string represents a genetic sequence in the cancer cell line, and the way that the user tries to solve the puzzle provides the researchers with a potential solution to the location of genes.

The first genome to be targeted is the T-47D breast cancer cell line, which is widely used in cancer research. The game launched last week for a three-month campaign and Marti-Renom’s team reckon that it will take 30,000 players solving an average of 50 games each to create the reference map of the 20,000 genes in T-47D. They are off to a good start because in the first week of operation, GENIGMA attracted over 10,000 new players.

You may remember in late 2020 when physicist Steven Wooding created an online resource to prove that the Earth is a sphere and not flat. Some of the experiments included how to see a second sunset, how to hide an object behind the curvature of the Earth and how to use shadows to measure the radius of the Earth.

In time for Valentine’s Day

Well, Wooding is back with a new project that is all about finding love. No doubt timed for Valentine’s Day, the Drake Equation for Love Calculator applies the famous Drake equation, which is used to calculate the number of alien civilizations in our galaxy with whom we could communicate, to estimate your chance of finding “the one”. The calculator – created with the help of data scientist Rijk de Wet – considers your location, social skills and attractiveness as well as the age range of potential partners you are looking for and whether they are university educated. It then compares the output to the possibility of an alien civilization existing within 1000 light-years away from Earth.

Wooding told Physics World that his odds of finding love are 2.1 times better than the possibility of alien life. It sounds like he might be being a tad picky.

In vitro platform enables realistic studies of neurological disorders

Pre-clinical research into neurological disorders is limited by the complexity of the brain, as well as the lack of adequate models to assess potential drugs, as demonstrated by the discouraging failure of drug candidates in late stages of clinical trials. Two-dimensional cell cultures can mimic some aspects of neuronal dysfunction, but lack complex morphology. Animal models, meanwhile, are often not sufficiently relevant for studying the human brain.

Three-dimensional cell models, so-called microphysiological systems (MPS), can more accurately mimic the structure and function of neural tissue. However, recording the electrical activity of individual neurons – the most relevant measure of neuronal function – remains challenging in 3D neuronal structures.

“A neuro-relevant in vitro 3D system capable of assessing the efficacy or toxicity of substances by measuring neuronal activity is still missing,” explains Paolo Cesare from the NMI Natural and Medical Sciences Institute in Reutlingen. “This is mainly because of the technical challenge of integrating a direct readout of electrical activity with millisecond resolution and high sensitivity.”

To fill this gap, Cesare and colleagues have developed a novel neuro-MPS that provides continuous, non-invasive electrophysiological readout of 3D neuronal networks.

Device design

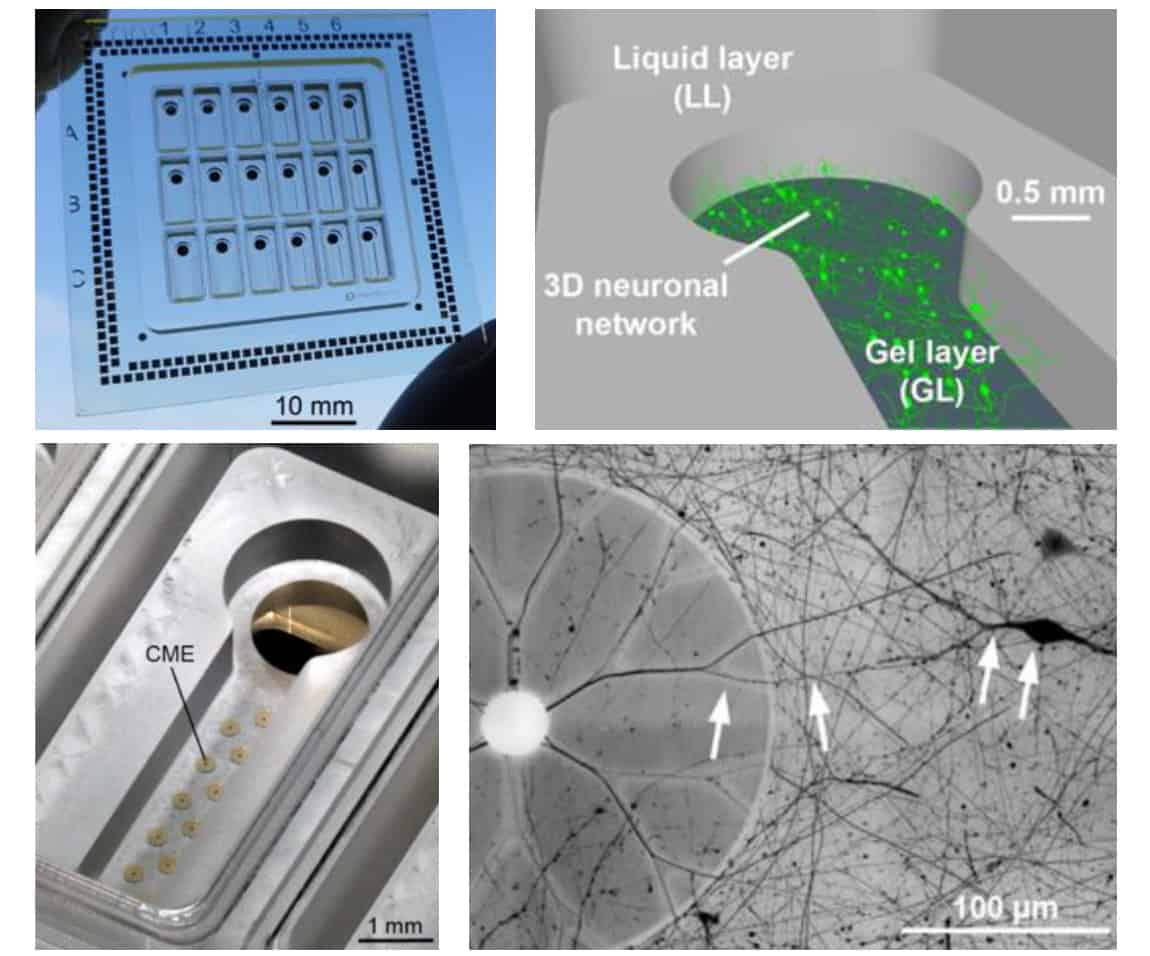
The neuro-MPS, described in Biofabrication, is based on a multiwell glass microfluidic device. Each well contains a 3D hydrogel layer, into which dissociated brain cells are dispersed, covered by a liquid layer containing culture medium. Microelectrodes integrated into the base of each well record the electrical activity from the neurons in the hydrogel.

The key innovation, say the researchers, is the introduction of capped microelectrodes (CMEs), which are insulated with a thin cap containing 5 µm-wide tunnels. As the embedded neurons mature, they extend projections called neurites (axons or dendrites) in all directions, including into the CME tunnels. When the neurons fire, electrical signals travel along these neurites and into the caps, generating action potentials of up to hundreds of microvolts.

Culturing 3D brain cells in a neuro-MPS

“The core technology is inspired by nature, in particular by the biological process of nerve sheathing through myelin, a thin membrane that electrically isolates axons and contributes to the rapid transmission of electrical signals in the nervous system,” says Cesare. “This process has been replicated at NMI by using different technologies, processes and materials to produce insulated microelectrodes that are able to measure the tiny electrical signals that propagate along the axons in 3D neuronal cultures.”

The researchers used various CME configurations to record the electrical activity of 3D-cultured primary mouse hippocampal neurons. They found that having more tunnels in each cap increased ease of access for neurites and thus the mean firing rate, but decreased the signal-to-noise ratio. Open electrodes with no cap detected negligible action potentials, showing their unsuitability for recording from neurons in a 3D hydrogel.

For the neuro-MPS to provide representative in vitro studies, it’s important that the individual neurons form a functional 3D network. The synchronized action potentials recorded by the CMEs suggest that the neurons are synaptically connected. But to confirm that the substrate-integrated CMEs aren’t preferentially recording from neurons near the bottom of the well, the researchers performed electrical recordings simultaneously with calcium imaging to identify active neurons. Calcium imaging measured activity at least 500 µm above the electrodes and the CMEs recorded concurrent activity, indicating that they are recording from throughout the entire 3D neuronal network.

Next, the team quantified the response to picrotoxin (PTX) and tetrodotoxin (TTX), which increase and reduce neuronal network activity, respectively. Low PTX concentrations significantly affected network activity, increasing the mean firing rate and the mean firing rate in network bursts, and decreasing the network burst frequency. TTX at higher concentrations significantly reduced neuronal activity.

The researchers also investigated optogenetic stimulation in the neuro-MPS, using neurons that react to pulsed 470 nm light. They illuminated a region in the 3D culture with light pulses and recorded the electrical activity of the entire neuronal network. Optical activation of neurons in the illuminated area triggered synchronized network bursts across the entire well, which were measured by individual CMEs. The team suggest that such optogenetic stimulation could provide a new approach for studying learning and memory in vitro.

Multimodal analysis

Another feature of the neuro-MPS is its ability to combine functional and structural analysis, as its transparent glass base enables confocal microscopy of the 3D neuronal structures. The team demonstrated this by examining the effects of rotenone – a pesticide that creates alterations associated with Parkinson’s disease – on mature neuronal cultures.

The CMEs recorded changes in neuronal activity just 10 min after exposure to 0.05 µM rotenone. Morphological changes assessed via live-cell imaging, however, appeared only 6 and 24 h after doses of 5 and 0.5 µM, respectively. This demonstrates that electrophysiological assessment can supplement structural studies and provide a more sensitive way to study the effects of neuroactive and toxic compounds.

“Mimicking cell composition and structure of the nervous system, while providing a high throughput platform for non-invasive acquisition of structural and electrophysiological data from 3D neural networks, represents a major leap forward towards a more physiological and brain relevant preclinical research platform,” Cesare tells Physics World.

Cesare and colleagues are now modifying the technology to create a new MPS that measures electrical activity in self-aggregated brain tissues, such as 3D brain organoids. They also hope to expand application of the MPS to the peripheral nervous system, creating devices to study 3D innervation of different target tissues.

Magic-angle graphene switches from superconductor to ferromagnet

Magnetism and superconductivity are usually at opposite ends of the spectrum in condensed-matter physics. For them to appear in the same material is exceedingly rare. Yet that is exactly what Jia Li and colleagues at Brown University in the US found when they interfaced so-called “magic-angle” graphene with a second two-dimensional material, tungsten diselenide. Thanks to a complex interaction between the two materials, the researchers succeeded in transforming graphene from a superconductor into a powerful ferromagnet – an achievement that could give physicists a new way to study the interplay between these two usually separate phenomena.

Graphene is a 2D crystal of carbon just one atom thick. Even on its own, this “wonder material” boasts many exceptional properties, including high electrical conductivity as charge carriers (electrons and holes) zoom through the carbon lattice at very high speeds. When two such sheets are placed on top of each other with a small angle misalignment, things become even more interesting. In this configuration, the sheets form a structure known as a Moiré superlattice, and when the twist angle between them reaches 1.08°, the material begins to show properties such as superconductivity at low temperatures. At this so-called magic angle, the way in which electrons move in the two coupled sheets changes because they are now forced to organize themselves at the same energy. This leads to “flat” electronic bands, in which electron states have exactly the same energy despite having different velocities.

This flat band structure makes electrons dispersionless – that is, their kinetic energy becomes completely suppressed and they cannot move in the Moiré lattice. The result is that the particles slow almost to a halt and become localized at specific positions along the coupled sheets. This enables them to interact strongly with one another, forming the pairs that are a hallmark of superconductivity.

Not normally present in magic-angle graphene

To transform magic-angle graphene from a superconductor into a ferromagnet, the Brown University team threw a further effect into the rich mix of behaviours already exhibited by twisted bilayer magic-angle graphene. In certain materials, the spin of each electron can start to interact with the electron’s orbit around the atomic nucleus. As team member Jiang-Xiazi Lin explains, the presence of this spin-orbit coupling is associated with a wide range of quantum phenomena, but it is not normally present in magic-angle graphene. It is, however, present in tungsten diselenide. When Li, Lin and colleagues interfaced this second material with graphene, they found that strong electron correlations within the Moiré flat band in graphene allowed the material to form correlated insulating states, turning it into a ferromagnet.

The researchers’ measurements revealed that an electric current flowing in one direction across the twisted bilayer graphene sheets produces a voltage in the direction perpendicular to the current in the presence of an external magnetic field. This phenomenon is known as the Hall effect and is evidence of an intrinsic magnetic field in the material. The Brown researchers also found they could control the magnetic state of the graphene using an external magnetic field oriented either in or out of the plane of the carbon sheet. This is not possible with magnetic materials that lack spin-orbit coupling; in such materials, the intrinsic magnetism can only be controlled if the external magnetic field is aligned along the direction of the magnetism.

New experimental knob

According to team member Erin Morissette, the unique influence of spin-orbit coupling gives scientists “a new experimental knob” to turn in their efforts to understand the behaviour of magic-angle graphene. The team’s findings could also have applications in quantum computing, as the interface between a ferromagnet and a superconductor has been proposed as a potential building block for making a quantum computer. Such an interface is difficult to create precisely because magnetism is usually so destructive to superconductivity. A material capable of both ferromagnetism and superconductivity could therefore provide a way to create this interface.

Looking ahead, the Brown scientists, who report their work in Science, say they plan to study how varying the spin-orbit coupling affects the stability of superconductivity and ferromagnetism. “This is the next step towards a better understanding of the interplay between these two phenomena in the 2D limit,” Li tells Physics World.

Electrical resistance standard could get a revised quantum definition

Researchers in Japan have proposed a new way of defining the standard unit of electrical resistance that would do away with the need for strong magnetic fields. The new proposal, which would create a standard based on the quantum anomalous Hall effect instead of the ordinary quantum Hall effect, would considerably simplify the experimental apparatus required to measure a single quantum of resistance.

Electrical resistance is a physical quantity that represents how much a material opposes the flow of electrical current. It is measured in ohms (Ω), and since 2019, when the base units of the International System of Units (SI) underwent their most recent revision, the ohm has been defined in terms of the von Klitzing constant h/e2, where h and e are the Planck constant and the charge on an electron, respectively.

To measure this resistance with high precision, scientists use the fact that the von Klitzing constant is related to the quantized change in the Hall resistance of a two-dimensional electron system (such as the one that forms in a semiconductor heterostructure) in the presence of a strong magnetic field. This quantized change in resistance is known as the quantum Hall effect (QHE), and in a material like GaAs or AlGaAs, it manifests at fields of around 10 Tesla. Generating such high fields typically requires a superconducting electromagnet, however, and the stray fields associated with such magnets make it challenging to integrate a QHE-based resistance standard with the voltage standard (which is based on a separate phenomenon known as the AC Josephson effect).

No superconducting magnet required

A team led by Yuma Okazaki of the National Institute of Advanced Industrial Science and Technology (AIST) in Tsukuba, together with Minoru Kawamura of RIKEN in Wako and colleagues at AIST, RIKEN, the University of Tokyo and Tohoku University in Sendai, has now demonstrated high-precision measurements of quantized resistance without using a superconducting magnet. The researchers did this by basing their measurement on the quantum anomalous Hall effect (QHAE), a variant of the QHE that arises from electron transport phenomena recently identified in a family of materials known as ferromagnetic topological insulators.

Because the QAHE manifests itself as a quantization of a material’s resistance even at weak (or indeed zero) magnetic fields thanks to spontaneous magnetization, the team was able to obtain high-precision measurements of the quantized change in resistance using just a small, commercially available permanent magnet. In a study published in Nature Physics, the researchers report that they measured the quantized Hall resistance to a precision of 10−8 Ω–1. This contrasts with previous reports in which the measurement uncertainty was more than a few parts in 107, which was not accurate enough for QAHE-based measurements to serve as a primary resistance standard.

An important milestone

“Our result constitutes an important milestone towards superconducting-electromagnet-free quantum resistance standard,” says Okazaki, the study’s lead author. The key to obtaining such high-precision measurements, he explains, is an increase in the critical current at which the QAHE breaks down. This current is the upper bound of the electric current needed to sustain the quantized resistance, and earlier studies of the QAHE revealed that it depended on the quality of the ferromagnetic topological insulator film. “To improve its quality, we optimized the various parameters relevant to the film quality, such as its chemical composition and the temperature at which it is grown,” Okazaki says. “As a result, we obtain a critical current of about 1 microamp, which is one or two orders of magnitude higher than the values previously reported.”

The researchers note that in their present device, they were only able to observe the QAHE at temperatures below 0.1 K. They acknowledge that this is far from ideal, since achieving such low operating temperatures requires an expensive cryogenic system like a 3He/4He dilution refrigerator. Increasing this value to above 0.3 K would be helpful, Okazaki says, as such temperatures can be obtained with a more compact and lower-cost 3He sorption refrigerator. Further optimization of the growth conditions of the ferromagnetic topological insulator film, as well as using other host materials, could make such a temperature increase possible, he says.

Physics buildings: the good, the bad and the ugly; breaking the silence on bullying and harassment

After enjoying a Twitter thread about the world’s most beautiful university campuses, the Canadian theoretical physicist Cliff Burgess was left wondering why physicists are often stuck working in ungainly buildings. He reached out to his Twitter followers to ask for nominations for the ugliest physics buildings and was overwhelmed by the response.

In this episode of the Physics World Weekly podcast, Burgess – who is based at McMaster University and the Perimeter Institute – chats with Physics World editors about what makes a good physics building and why some edifices don’t work at all.

We also speak with the physicist Marie Hemingway, who is co-founder and chief technology officer of Speak Out Revolution. The not-for-profit organization works to cancel the culture of silence on harassment and bullying in the workplace.

Hemingway talks about her recent article in Physics World (co-authored with Mark Geoghegan) that looks at how non-disclosure agreements are routinely used to silence people who have suffered bullying and harassment at work. She explains how people can document their experiences using the organization’s safe online platform and how this information is analysed to provide insights into how employers can better deal with bullying and harassment.

Hemingway and Geoghegan’s article is “Bullying and harassment in physics affects us all”.

Solitary stellar-mass black hole found wandering through the Milky Way

An international group of astronomers believe they have discovered the first “isolated” stellar-mass black hole wandering through interstellar space. The team used the Hubble Space Telescope to reveal the black hole, which lies roughly 5000 light-years away in the constellation Sagittarius.

Black holes with masses comparable to stars have been detected in our galaxy before, but their presence has always been inferred either by their interactions with a companion star, which create a glow at X-ray wavelengths, or from the gravitational waves that are produced when they collide. This new finding, however, is the first time that one has been clearly identified in isolation.

This kind of work is incredibly important in that it contributes towards a complete census of the black hole population

Vivienne Baldassare

The discovery was made using a technique known as “astrometric microlensing”, which uses the fact that a mass moving through space can act like a gravitational lens. This lens distorts both the brightness and, crucially, the apparent position of stars along the line of sight of the observer far beyond the mass itself.

For years astronomers have been carefully watching Milky Way “star fields” looking for these characteristic deflections and brightness changes. In 2011 such a warping of a distant star was caught by telescopes in New Zealand and Chile. That event was intriguing enough that it set in motion an extensive follow-up study, using Hubble, to examine how the background star’s light was being shifted and what might be causing it.

“We had to continue observing, once every six months to a year, for six years,” says Kailash Sahu from the Space Telescope Science Institute in Baltimore, US, who is lead author of the new study.

Hubble’s capabilities allowed Sahu and colleagues to measure the apparent tweaking of the star’s position with an extraordinary precision of roughly 0.2 milli-arcseconds. “[That is] about 10 million times smaller than the diameter of the full Moon,” explains Martin Dominik, one of the researchers involved with the study, who is based at the University of St Andrews, UK.

Getting a kick

The amount of deflection observed during the six-year study suggests that the object creating the gravitational lens has a mass about seven times that of the Sun. The scientists argue that this mass cannot be a regular star or a multiple star system because there would be radiation visible from those phenomena – and no such light has been detected. It’s also too hefty to be a stellar remnant known as a white dwarf.

“Moreover, the inferred mass is too large for the gravitational lens being a binary neutron star,” adds Dominik. This and other evidence, the team says, points to the object being a solitary stellar-mass black hole.

One intriguing quirk of the black hole is that its speed through the Milky Way is a staggering 162,000 kilometres per hour. That, according to Sahu, means it is outpacing “almost all” the stars in its surroundings. “Since none of the other stars are moving this fast, we think this must be because [the black hole] got a ‘kick’ during the supernova explosion that produced [it],” he says.

Vivienne Baldassare, a black-hole expert at Washington State University in the US, who was not involved in the new study says it is a “remarkable result” and an “impressive” feat of observational astronomy. “This kind of work is incredibly important in that it contributes towards a complete census of the black hole population and towards understanding the formation and evolution of stellar-mass black holes,” she says. “Future events should be discoverable with facilities like the Vera C Rubin Observatory, which will allow us to further constrain the number of stellar-mass black holes in our galaxy and their properties.”

Copyright © 2026 by IOP Publishing Ltd and individual contributors