Computer simulations by astronomers in the US have presented a new clue for researchers hunting a hypothesised planet hiding in the far reaches of the solar system. The modelling suggests that searching for “Trans-Neptunian Objects”, or TNOs, in certain orbits could shed light on whether a so-called “Planet Nine” exists beyond Neptune.
The possible presence of a ninth planet in our solar system was first proposed more than five years ago based on the orbital characteristics of certain objects travelling around the Sun at immense distances. Yet despite ongoing searches, no direct detection of the distant world has been made so far.
In their latest work, Kalee Anderson and Nathan Kaib, both at the University of Oklahoma in the US, modelled the evolution of the solar system – including the four giant planets as well as a million “particles” representing the disc of icy bodies in the Kuiper Belt beyond Neptune – over the course of four billion years, up to the present day.
One of their models simulated our familiar eight-planet solar system while the others contained a possible ninth planet with various orbital permutations. “As each simulation ran, the million particles ‘felt’ the gravitational effects of the planets as Neptune migrated through the disc,” Anderson told Physics World. “This process scattered this disc into a simulated present-day Kuiper Belt that we could compare to the actual observed Kuiper Belt and the other simulations.”
Observational test
In the models incorporating a ninth planet, the researchers found that a conspicuous collection of far-off bodies tend to congregate in orbits that have a relatively shallow incline to the plane of the solar system. These objects would be at huge distances from the Sun, never getting closer to our star than 40-50 times the Earth-Sun distance. Crucially, this gathering of TNOs did not materialise in low-inclination orbits in the simulation of an eight-planet solar system. The results therefore suggest that a search for real-life, low-inclination orbit TNOs in faraway regions might offer insights into the presence, or not, of the hypothetical Planet Nine.
These kinds of predictions are critical to testing proposed Planet Nine scenarios
Kat Volk
“This is a very nice study that produces observationally testable predictions for the consequences of an additional large unseen planet in the distant solar system,” says Kat Volk, a planetary scientist at the University of Arizona who works on the Outer Solar System Origins Survey (OSSOS) project, and who was not involved in the new research. “These kinds of predictions are critical to testing proposed Planet Nine scenarios,” she adds.
According to Volk, current surveys of the outer solar system can discover distant bodies with the kinds of orbits identified in the new study, but they face a challenge because of how faint those TNOs would be. And as today’s surveys usually strike a balance between how deep they peer into our planetary neighbourhood and how much of the sky they cover, they would also only find a small selection of the objects in question.
To test which of the new simulations is closest to reality, and therefore explore whether there really is a ninth planet in the solar system, researchers will need a larger sample to examine. That could come from the Vera C. Rubin Observatory’s Legacy Survey of Space and Time (LSST), which will begin observations in 2023.
“The observatory’s 10-year survey is going to be revolutionary because it should be able to detect TNOs almost as faint as dedicated small surveys, like OSSOS, but also cover a huge percentage of the sky,” adds Volk. “I think it is likely that LSST will give us the number of TNOs that Anderson and Kaib estimate that they need to distinguish between their models.”
Earlier this week the 2021 Nobel Prize for Physics was shared between Giorgio Parisi for his work on complex physical systems and Syukuro Manabe and Klaus Hasselmann for their work on modelling the Earth’s climate. In this episode of the Physics World Weekly podcast I chat with spin-glass expert Steven Thomson of the Free University of Berlin about Parisi’s research legacy and to climate physicist Tim Palmer of the University of Oxford about how Manabe and Hasselman influenced our understanding of climate change.
Also in this episode, Physics World’s Tami Freeman is in conversation with Suman Shrestha, who talks about his experience of moving to the US from his hometown of Kathmandu in Nepal to pursue his interest in medical physics. He also chats about what he plans to do when he completes his PhD at the University of Texas MD Anderson Cancer Center in Houston.
Physics World‘s Nobel prize coverage is supported by Oxford Instruments Nanoscience, a leading supplier of research tools for the development of quantum technologies, advanced materials and nanoscale devices. Visit nanoscience.oxinst.com to find out more.
Scientists in China have developed a technique for printing structural colours using a commercial inkjet printer. The researchers used a transparent polymer ink to print dome-shaped microstructures, with the height and diameter of the microdome controlling the wavelength of light reflected and the colour produced.
Most colour images are created by printing using inks based on dyes and pigments. These absorb some wavelengths of light and reflect others back, creating the colour that we perceive. But colour can also be produced using nanostructures that scatter and reflect different wavelengths of light in different ways – so-called structural colour.
Printing similar light-scattering structures using transparent polymers could offer advantages over standard colour printing techniques, particularly as the chemicals used to produce some dyes and pigments have caused serious health and pollution problems, says Yanlin Song, a chemist at the Chinese Academy of Sciences in Beijing.
“We wanted to print colour images with structural colour,” Song tells Physics World. “Compared with traditional pigments and dyes, structural colours can resist photobleaching and avoid the use of toxic materials. They are eco-friendly and fade-resistant.”
To print structural colours, the researchers used an inkjet printer to deposit droplets of a transparent polymer on a hydrophobic, transparent surface. After printing, surface tension causes the droplets to retract into microdomes with large curvature angles. Each microdome acts as a single pixel and when light enters the dome it undergoes total internal reflection. The team found that by controlling the ink volume they could precisely control the size and shape of each dome and the wavelength of light that it reflects, thus changing the pixel’s colour.
The technique, which the researchers named droplet-by-droplet printing, takes advantage of the way that inkjet printers work. By printing spatially distributed separated subpixels of different sizes and colours that form a larger composite pixel, inkjet printers can produce almost unlimited blends of colours. In a similar way, the scientists used the inkjet printer to print different sized microdome subpixels to create a range of larger composite pixels. Doing this, they found they were able to produce a palette of 36 structural colours covering a wide-range of colours and adjustable lightness.
To test their printing technique, the team printed colour images of various solid-coloured animals, including a green reptile and a yellow bird, as well as multicolour images such as a colourful peacock and butterflies. The researchers also printed elaborate portraits of famous figures including Isaac Newton, Audrey Hepburn and Marilyn Monroe. These portraits had a number of technically challenging elements, such as grayscale gradients, but the researchers found that they could still be produced with very high fidelity using their novel structural colour printing technique.
“With the advantages of simple manufacturing and widely available inks, we think this colour printing approach presents great potential in imaging, decoration, sensing and biocompatible photonics,” says Song.
Due to their structural nature, the colours also have other characteristics not normally present in printed inks. The printed structural colours can have angle-dependent characteristics, with changes in illumination or viewing conditions affecting the total internal reflection paths and interference rays, leading to the production of different colours.
The optical characteristics are also asymmetric. As the inks are printed on a transparent panel, this means that while they produce colour when viewed from one side, if they are turned over and viewed from the other side they are completely transparent. According to the researchers, these characteristics could have uses in applications ranging from smart windows to anti-counterfeiting technology.
“A fascinating property of the structural colour is its iridescent and dynamic feature, which can exhibit amazing colour change under different conditions,” Song explains. “Thus, decoration and anti-counterfeiting may be promising applications.” Song tells Physics World that the researchers now plan to experiment with printing with different materials, to try to “combine the inherent properties of polymer materials – such as shape memory and smart response – with the structural colours, to explore more interesting features and functions”.
Graphene nanoribbons (GNRs) have many possible uses in electronics and optoelectronics, but a lack of efficient methods to prepare these ultra-narrow strips of carbon has so far limited their applications. Researchers in China and the US have now found a novel solution. By squashing carbon nanotubes in a diamond anvil cell, the team produce sub-10-nm-wide semiconducting GNRs with atomically smooth closed edges and few defects, potentially paving the way to a more widespread adoption of the material.
In its standard form, graphene (a two-dimensional sheet of carbon) is a semimetal with no gap between its conducting bands. One way of transforming it into a semiconductor with a bandgap – a necessary step before devices made from it can be switched on and off – is to reduce its dimensionality still further by making it into GNRs. Indeed, studies have shown that GNRs less than 10 nm wide are all semiconducting. Better still, GNRs with a width of 5 nm or less have a bandgap big enough to meet the requirements of high-performance logic devices.
The catch is that the electron transport properties of GNRs depend strongly on the smoothness of their edges. Any slight roughness will make the electrons scatter, thereby lowering the nanoribbon’s electron mobility. And unfortunately, high-quality, ultra-narrow GNRs are hard to make, especially if their edges need to be smooth along the entire length of a long ribbon.
Top-down and bottom-up
Strategies for making GNRs less than 10 nm wide fall into two categories – top-down and bottom-up. Examples of top-down strategies include: using ultrasound to exfoliate expandable graphite; starting with wider GNRs and slimming them down with gas-phase etching; using a nanowire mask to create narrow, strip-like patterns in two-dimensional graphene; and lithography guided by a scanning tunnelling microscope.
The trouble with these methods, explains Changxin Chen, a researcher at China’s Shanghai Jiao Tong University who led the new study, is that they tend to produce GNRs with rough edges and lots of defects, which substantially reduces the structures’ electron mobilities. “The non-uniform edges between the GNRs also result in large variations in the GNRs’ electronic structure and properties,” he adds.
Bottom-up strategies, for their part, include synthesizing the nanoribbons from solution or using a technique called surface-assisted assembly. Unfortunately, nanostructures created using these strategies also suffer from low carrier mobility, and they are typically short, just dozens of nanometres long.
Smooth edge-closed nanoribbons narrower than 5 nm
In contrast, the new top-down technique developed by Chen and colleagues creates atomically-smooth, edge-closed nanoribbons as little as 1.4 nm wide – the narrowest so far reported in GNRs fabricated using a top-down approach. “The prepared nanoribbons also boast sizeable bandgaps and high carrier mobilities, making them ideal for fabricating high-performance electronic and optoelectronic devices such as field-effect transistors,” Chen tells Physics World.
To make their GNRs, the researchers subjected single- and double-walled carbon nanotubes (CNTs) to pressures of as high as 22.8 GPa in a diamond anvil cell. After loading the CNTs into a sample chamber at the centre of a pre-indented tungsten gasket, they compressed the gasket between two anvils, heating the ensemble up to 220 °C for the highest pressures. Using in-situ Raman spectroscopy through the (transparent) diamond window of the cell, they observed that the electronic structure of the CNTs changed before and after the high-pressure/thermal treatment.
The researchers found that this method has a relatively high yield, transforming up to 54% of the starting material into edge-closed nanoribbons. The same method can also be used to fabricate edge-opened nanoribbons using nitric acid as an oxidant to selectively etch the edges of the squashed nanotubes. The technique could even be extended in other ways – for example, to make nanoribbons from other nanotube-forming materials or to flatten other fullerene materials.
Scaling up GNR synthesis
To test the electronic properties of their GNRs, Chen and colleagues made a field-effect transistor from a 2.8-nm-wide edge-closed nanoribbon. They found that it had an on/off current ratio of more than 104 and a sizeable bandgap of around 494 eV. It also had a field-effect mobility as high as 2443 cm2/V/s and an on-state channel conductivity of 7.42 mS.
The researchers say they are now trying to decrease the pressure required to squash CNTs by adding a “deviatoric” stress component or by regulating the temperature at which the thermal treatment is carried out at the highest pressures. “By using lower pressures, and thanks to our method’s high yield, we will be able to scale up the synthesis of the GNRs by using a multi-anvil approach or a large-volume press,” Chen says.
The productivity of scientists working in a field that has recently won a high-profile award increases rapidly in the following decade. That is according to an analysis led by Brian Uzzi at Northwestern University in the US, which also finds that citations per person increase during that time as well. The ability to retain and attract scientists into the prize-winning field rises too.
The study was carried out using data from Wikipedia on 400 different scientific prizes – including the Nobel Prize, the Wolf Prize and the Turing Award – that were awarded 2900 times between 1970 and 2007. After cross-checking award information against prize webpages and news reports, the researchers assigned the prizes to scientific topics based on the winners’ previous work and data from Microsoft Academic Graph, which classifies scientific topics.
The researchers then matched each prize-winning field with five non-prize-winning areas that had identical growth patterns in the decade prior to the award. These links were made using criteria related to productivity and citations as well as the movements of scientists in and out of the fields of research. The work covered more than 11,000 scientific topics in 19 disciplines.
The analysis shows that the growth of prize-winning fields deviates significantly from non-prize-winning areas, which continue to grow as expected. “When a topic is associated with a prize, that topic grows in an unexpected and extraordinary way the year following the prize and for at least the next 10 years,” says Uzzi.
If the prize is given for recent research, it gives people a sense that there is going to be a boom of research around that topic
Brian Uzzi
A decade after the award, prize-winning fields produce 40% more papers and garner 33% more yearly citations than their matched non-prize-winning topics, the researchers found. Prize-winning topics also show an 8% increase in citations per person, per paper – compared with non-prize-winning areas. Meanwhile, the citation impact of leading scientists in the prize area is 25% greater than that of leading scientists in matched non-prize-winning fields – indicating that the rise in impact applies both to individual scientists and the prize-winning topic.
Alongside increases in productivity and impact, prize-winning fields retain 55% more scientists and gain 37% more new entrants. They also attract 47% more “star scientists” – the 5% most highly-cited researchers in a discipline – than matched non-prize-winning topics.
Opening doors
To assess whether funding impacts growth, the researchers looked at a subset of almost 3000 prize-winning topics that had received funding from the US National Institutes of Health (NIH). They found that prize-winning topics do not benefit from more NIH funding than matched topics – both before or after a prize is awarded. “We didn’t find evidence to support the widely-held belief that money drives science,” says Uzzi. “Rather, it is a prize that has that effect.”
According to Uzzi, scientists are always looking for areas where they think they can get the best returns. A prize increases the awareness of a scientific topic and creates “the perception that it is a growth area”. Indeed, Uzzi adds that their results show that the more recent the work the prize is given for, the greater the magnitude of extraordinary growth.
“If the prize is given for recent research, it gives people a sense that there is going to be a boom of research around that topic and a lot of opportunity,” he says. “But if you give it for something that was done 10 years earlier, scientists may perceive that the extraordinary opportunities have already taken place.”
Researchers in Finland have observed a plant-induced cooling effect in the atmosphere, which strengthens as temperatures increase. The team, led by Taina Yli-Juuti at the University of Eastern Finland, studied the negative feedback mechanism through both ground- and space-based observations of a Finnish forest. Their results could provide important guidance for climate models that include the influence of aerosols in the atmosphere.
Organic aerosols are tiny particles that include dust, ash and pollen. They cool Earth’s climate by reflecting sunlight back into space and by accelerating the formation of water droplets in clouds, which can also have a cooling effect. As climate scientists predict future global temperatures, it is crucial for their models to fully account for these cooling processes. However, the properties of aerosol particles are very diverse and so there is significant uncertainty about how they should be incorporated into climate models.
One proposed climate feedback mechanism involves organic aerosols emitted by plants at concentrations that are known to increase with temperature. The idea is that as the biosphere responds to a warming atmosphere, concentrations of these particles will increase, influencing the climate in turn.
Land and space observations
To study this effect, Yli-Juuti’s team took measurements from two different instruments. On the ground, they used the University of Helsinki’s Hyytiälä Forestry Field Station, which is in taiga (boreal forest) about 200 km north of Helsinki. Over a seven-year period, the station has monitored concentrations of organic aerosols while simultaneously taking temperature measurements. From space, they used the MODIS instrument, aboard NASA’s Aqua satellite, to monitor the properties of clouds forming above the forest over the same period.
The observations revealed a clear increase in organic aerosol concentrations in years with higher summer temperatures. These changes came hand in hand with increasing concentrations of cloud nucleation centres: particles which form through chemical reactions with organic aerosols, which provide surfaces on which vapour in the surrounding air can condense – allowing liquid cloud droplets to form far more readily. Both of these effects were strongly associated with an increase in cloud reflectivity above the forest, resulting in cooler temperatures on the ground.
Altogether, the team’s results provide the first observational evidence of this negative climate feedback mechanism. As global temperatures increase, Yli-Juuti and colleagues predict that the effect will become progressively prevalent in boreal forest environments. The researchers hope that, by incorporating the mechanism into their models, climate scientists will attain more accurate predictions of future changes to Earth’s climate.
Continuous improvement, patient safety, automation and workflow efficiency: these are the operational reference points that underpin a comprehensive portfolio of clinical services at The Clatterbridge Cancer Centre NHS Foundation Trust, one of the UK’s leading oncology programmes delivering non-surgical cancer care – radiation therapy, chemotherapy, immunotherapy and gene therapy – to approximately 30,000 patients every year in Liverpool and the wider metropolitan region across the north-west of England.
For its part, the Trust’s 40-strong medical physics team has put those reference points front-and-centre over the past five years, having successfully phased in a unified suite of 11 linacs from Varian Medical Systems across the Clatterbridge’s three specialist radiotherapy clinics. The resulting treatment systems comprise a mix of Edge, TrueBeam and Clinac iX machines, all of them using plans from Varian’s Eclipse treatment planning system.
Convergent thinking
That strategic move to consolidate and standardize the radiotherapy workflow was reinforced when the Clatterbridge team subsequently implemented a single-source radiotherapy QA programme in partnership with Sun Nuclear Corporation, the US-based manufacturer of independent QA solutions for radiotherapy facilities and diagnostic imaging providers. Put simply, the shared goal here is to support a unified framework for treatment planning, management and delivery by driving QA automation and best practice across the Clatterbridge radiotherapy programme.
“It’s fair to say that previously we had an overly complex QA environment,” explains Greg Martin, a radiotherapy physicist based at Clatterbridge Cancer Centre-Liverpool, the latest addition to the Trust’s network of clinics. “We’d created a whole new industry for ourselves, with technology fragmentation resulting in a significant training burden and maintenance overhead as a result of QA hardware and software tools being sourced from multiple equipment vendors.”
Conversely, the establishment and evolving implementation of Sun Nuclear’s SunCHECK Quality Management Platform – a single interface and database that provides a unified view of patient and machine QA – has enabled Clatterbridge to reimagine and declutter its QA programme, enhancing patient safety while baking in workflow efficiencies thanks to new-found opportunities for the automation of essential QA checks.
“Using a single QA vendor has helped us to streamline our staff training and ensure that specialist product knowledge is distributed consistently across the radiation therapy department,” adds Martin. That shared understanding is particularly important when running a medical physics service – like Clatterbridge does – across multiple sites and multiple teams. “What’s more,” notes Martin, “the synchronized approach to QA means patients will be treated using the same QA protocols regardless of location or the staff performing the QA. It also allows us to optimize our resource allocation collectively, with medical physics staff able to transfer more easily between Clatterbridge sites to provide cover as needed – a big plus throughout the COVID-19 pandemic.”
The QA engine-room
If that’s the back-story, what of the specifics? A key driver for Clatterbridge’s tie-up with Sun Nuclear is targeted improvement and innovation across the patient QA workflow, with automated first-fraction validation for every patient and automated in vivo monitoring of minor anatomical changes between fractions. On the machine side of the workflow, meanwhile, the ongoing priority is to remove subjectivity and manual analysis from image-based machine QA, driving efficiencies and standardization throughout the Clatterbridge radiotherapy network. Automating the machine QA workflow also yields significant time savings and simplification for daily, monthly and annual QA checks and compliance.
Greg Martin: “When it comes to patient QA, we simply couldn’t do manually what SunCHECK Patient does automatically.” (Courtesy: Clatterbridge Cancer Centre)
The SunCHECK Quality Management Platform provides what Clatterbridge needs through two core modules. SunCHECK Patient encompasses all aspects of patient QA, including secondary checks, phantomless pretreatment QA and automated in vivo monitoring. Meanwhile, SunCHECK Machine addresses critical machine QA needs, including template-driven daily, monthly and annual QA; automated imaging, multileaf collimator and volumetric modulated arc therapy (VMAT) checks; as well as long-term data trending and analysis.
Following implementation of the EPID-based SunCHECK Patient, the Clatterbridge medical physics team is now able to validate that the first fraction prescribed for its highest-risk patients matches the predicted transit dose, while automation of data processing in the background alleviates the need for user input. That’s especially important for patients receiving stereotactic body radiotherapy (SBRT), where there are only three to five higher-dose fractions and a higher degree of machine modulation versus standard treatment modalities – all of which means less room for error and, in turn, an additional layer of patient QA to maximize patient safety.
Another goal with SunCHECK Patient is to streamline workflows for the tracking of anatomical changes, especially patient weight loss, during a course of treatment. As part of a research study to road-test the software, Clatterbridge can now set its baseline as the first fraction or use SunCHECK Patient’s “predicted image” feature, tracking subsequent fractions against that baseline automatically. After some sensitivity testing, the Clatterbridge team has also defined a potential threshold that matches the current manually intensive help-desk triage system. Full clinical roll-out of the automated functionality is already under way, so that over time the team will review weight-loss issues only when a flag arises in SunCHECK Patient, enabling a more objective approach to identify critical cases for replanning.
“When it comes to patient QA, we simply couldn’t do manually what SunCHECK Patient does automatically,” notes Martin. The same goes for SunCHECK Machine and the automation of daily, monthly and annual QA tasks (versus the high levels of manual input required previously). “We have dramatically expanded the amount of patient and machine QA that we do,” he adds, “though it’s taking us much less time to do it because of the high degree of automation as well as the in-built accessibility that comes from a web-based software platform.”
It’s all about the numbers
What makes SunCHECK unique then is the ability to automate QA processes where the level of automation was previously non-existent. In a presentation at the recent ESTRO 2021 Annual Congress in Madrid, Spain, Martin and his colleagues quantified the efficiencies realized at the sharp-end of treatment delivery following the clinical roll-out of SunCHECK Machine at Clatterbridge (see table). Their study evaluated the automated QA software solution across nine linacs over a 12-month period, noting that automation of hitherto manually intensive QA measurements yielded significant aggregate time savings – 22 hours and 43 mins per linac per year – while an improvement in the analysis of visual tasks was immediately apparent as well.
Time saving: Clatterbridge’s comparison of time taken to complete QA measurements and analysis using legacy testing approach versus SunCHECK Machine. (Courtesy: Clatterbridge Cancer Centre)
“A lot of the analysis we used to do on things like CatPHAN phantoms, picket fences and VMAT QA was done manually – drawing on regions of interest and entering in results,” notes Martin. “Overhauling and automating that process with SunCHECK Machine resulted in huge time-savings and quality benefits from the start…while the simplification of the workflow means that technicians can now manage the machine QA rather than physicists.”
Looking longer term, Clatterbridge’s drive for continuous improvement across its QA workflows will track developments on the SunCHECK platform, with a sustained pipeline of new features being rolled out across three or four new software releases each year. “It really helps that Sun Nuclear is open and collaborative when it comes to the product roadmap,” concludes Martin. “As such, the team here is, and will continue to be, an active part of the SunCHECK requirements-gathering conversation.”
The sheer length and complexity of polymers – chains of molecules that make up both artificial materials such as plastics and the proteins that form the essential building blocks of life – make them formidable objects to study. Researchers in Italy have now tackled this problem in a new way, using quantum computers to make polymers slightly more approachable.
In a collaboration between the Scuola Internazionale Superiore di Studi Avanzati in Trieste and Trento University in Trento, Cristian Micheletti, Philipp Hauke and Pietro Faccioli used a specialist quantum computer called a quantum annealer to predict configurations of polymer chains. In doing so, Micheletti says they first had to “recast the basic models of polymer physics so that they can be used in a quantum computing framework”, anticipating that quantum technology will be the driving force behind scientific computing in the future.
Polymers’ twist and turns
Despite their ubiquity and usefulness, polymers are notoriously hard to study. The ways these chains fold, intertwine and link with each other gives a polymeric material its unique properties. When researchers study polymers, they sample large numbers of such possible shapes, also known as conformations, and compute their properties. For example, studying how plastic polymer chains disassociate at different temperatures could tell us how the material might weaken or melt as it becomes hotter. Similarly, studying biological polymers, such as DNA, may give invaluable insights into the workings of a cell.
However, studying polymers is a computational challenge, especially if they are densely packed. The simplest model of polymers treats them as continuous paths on a regular lattice. But the numbers of possible paths (that is, the number of ways a polymer chain can fold and contort) are too numerous to calculate, even for a powerful supercomputer. On top of that, not all possible paths are chemically valid – some polymers do not allow chains that branch into two, while others will not allow loops. This task of sampling valid conformations from a dauntingly large search space is a central problem in polymer physics.
Quantum annealers to the rescue
In their study, which is published in Physical Review Letters, the researchers devised a way to map the problem of identifying valid polymer conformations onto a problem that is somewhat more tractable: minimizing the energy of a quantum system. To do this, they encoded the rules for polymer conformations onto a mathematical object called a Hamiltonian that describes the energy dynamics of a quantum system. The lowest-energy quantum state of this Hamiltonian contains only those arrangements of polymer chains that obey the rules.
The team’s next task was to obtain the lowest-energy solution of the Hamiltonian. They did this with the aid of a quantum annealer operated by the quantum computing firm D-Wave Systems. Unlike a general quantum computer, which can execute universal logic through a sequence of elementary operations, quantum annealers specialize in the singular task of finding lowest-energy states. The researchers used D-Wave’s annealer to validate their algorithm using examples simple enough to fit onto the available hardware. Crucially, they observe that the operation time of their quantum-aided algorithm scales more favourably than is the case in a classical version of the same algorithm, at least for examples of the size they studied on the quantum annealer.
Because the small sizes of hardware available today limit the complexity of the polymers that can be probed using this technique, we might have to wait some time before common polymers like fishing lines and fabrics are designed using quantum computers. The new result is, however, a good starting place, says Micheletti. “We are now considering its extension to richer and more realistic polymer models,” he adds.
Physicists are comfortable with complexity and great at deconstructing problems into their essential elements. These are vital skills for understanding the climate system and for designing solutions to help the world decarbonize. This video introduces some of the key research questions where physicists can make real-world impacts in the coming years.
Making pledges is easy. More than 130 nations have so far promised to become “net-zero” carbon emitters by 2050 to try to limit global warming to 2 °C above pre-industrial levels. But as world leaders meet on the banks of the Clyde in Glasgow for the COP26 summit, they will have to turn talk into action. We’ve already hit 1.2 °C warming and there are clear signs of the climate chaos we’re starting to unleash.
The previous summit, held in Madrid in 2019, ended in frustration with little progress on issues such as carbon financing or sharing climate burdens between nations. Politicians floundered despite half a million protestors marching through the Spanish capital. Mainstream journalists seemed more interested in Greta Thunberg’s trans-Atlantic journey to the conference by low-carbon catamaran than in demanding action.
Long term, climate change is a greater threat than the COVID-19 pandemic. It’s also more complicated, affecting lives in clandestine ways, exposing and amplifying global inequalities. The good news is that physicists have a vital part to play, being good at deconstructing problems into their essential elements and speeding up the development of solutions. Basic and applied research will also help to tease out the finer details of the climate system itself.
Here are four key climate questions where physicists are perfectly placed to help.
1 Where will the world’s hot danger zones be?
Thanks to its delightfully warm summers, the resort of Lytton in British Colombia has long been known as “Canada’s hot spot”. Nestled in a valley where the Fraser and Thompson rivers meet, its official website hailed this community of 250 residents as “the perfect place for people looking for the peace and friendliness of a charming small town”. On 29 June, however, tragedy struck when Lytton recorded Canada’s highest ever temperature of 49.6 °C. Wildfire engulfed the town. Two residents were killed and the rest were evacuated as were those in surrounding First Nation communities. Almost all of Lytton’s properties were destroyed.
The unfortunate events were a result of this year’s extraordinary heat wave in western North America, which followed a sequence familiar to meteorologists. An area of high pressure above the Pacific Ocean was driven eastwards through the jet stream by a “Rossby wave” – a planetary-scale fluctuation arising from the Coriolis force. The Rossby wave eventually “broke”, dumping its energy – like an ocean wave hitting the shore – to create an area of high pressure locked over western Canada and US.
Up in flames After recording Canada’s highest ever temperature on 29 June 2021, Lytton in British Columbia had to be evacuated as wildfires engulfed the town and destroyed most of its buildings. (Courtesy: Canadian Press/Shutterstock)
As air sunk through the atmosphere, it got squeezed and heated. Using attribution techniques – an emerging field that blends climate modelling and statistics – an international team of researchers quickly concluded that the daily maximum temperatures in the heatwave region were so extreme that they would normally occur only once every 1000 years. Without human-induced climate change, that heat would be at least 150 times rarer.
And this is where physicists can help by building a more complete understanding of how global warming triggers localized outbreaks of extreme heat. Where are they most likely? How extreme might such occurrences be? And how are they linked to wildfire, air pollution and other hazards? Extreme heat is not just an abstract notion: if we can’t cool our bodies enough, we’re in danger of neurological failure, organ failure and even death, with the risks highest for children and the elderly. Conditions will be particularly bad in regions, such as southern Asia, that are already hot and humid.
To gauge the combined effects of heat and humidity, health experts use a practical unit known as the “wet-bulb temperature”, which is simply the value read by a thermometer wrapped in wet cloth. Spend too long in a wet-bulb temperature above 35 °C and you’ll be in trouble. A 2017 study led by geographer Camilo Mora from the University of Hawaii found that around 30% of people around the world are already exposed to climatic conditions above this deadly threshold for at least 20 days a year (Nature Climate Change7 501). This figure will increase to nearly half of the world’s population by the end of the century, the authors say, even with drastic reductions in greenhouse-gas emissions.
Limiting warming to 2 °C over pre-industrial levels could avoid thousands of heat-related deaths compared with the 3 °C rise we’re heading towards
Eunice Lo, University of Bristol
“One key challenge is to quantify the different combinations of heat and humidity, then to link them with different health outcomes,” says Eunice Lo, a physicist-turned-climate scientist at the University of Bristol, UK. By combining historical health data (1987–2000) in 15 US cities with a statistical model of temperature-mortality, her group has found that limiting warming to 2 °C over pre-industrial levels could avoid thousands of heat-related deaths compared with the 3 °C rise we’re heading towards by the end of the century based on current emissions pathways (Science Advances 5 eaau4373).
Particularly important will be to identify hotspots where dangerous heat and vulnerable populations coincide. City dwellers are at most risk due to heat being reflected and absorbed from buildings, roads and other urban structures. This “urban heat island” creates zones within cities that can be several degrees warmer than the surrounding countryside. Recent studies suggest that it disproportionately affects communities along both economic (Env. Res. Lett.14 105003) and racial lines (Nature Comms12 2721).
2 How can we track and reduce the hidden carbon in buildings?
Can a building be evil? That was the provocative question posed by David Coley, a physicist at the University of Bath, UK, to an audience at the headquarters of the Institute of Physics (IOP) shortly before it relocated to its environmentally sound premises at King’s Cross, London, in 2018. Coley, who studies energy use in buildings, was pointing out that when we evaluate architecture, we must always consider its environmental harm, not just its beauty or functionality.
Fortunately, architects are listening to environmental concerns, with sustainability one of the 21st century’s key themes in building design. Companies and organizations (including the IOP) are not shy in boasting about the green credentials of their premises, from green roofs and ground-source heat pumps to smart lighting and renewable energy. What’s harder is knowing the carbon footprint of building materials throughout their lifecycle, which requires reams of data about supply chains and logistics that either don’t exist or have never been tracked.
Unfortunately, unless politicians can agree on a global carbon price and make businesses pay for, or trade, carbon emissions – an issue on the agenda at COP26 – there will be little incentive for construction companies to keep detailed records. “In most cities it is a challenge to even know how many buildings there are, how many kilometres of road, how many miles of water pipes there are,” says Arpad Horvath, an environmental engineer at the University of California, Berkeley, and co-chair of IOP Publishing’s Environmental Research 2021 virtual conference.
Horvath is often hired by businesses to help make their buildings more green, but says that when he asks what they are made of he just gets a shrug of the shoulders before being invited to stroll around and figure it out himself. In the coming years, better data collection, along with tools such as smart sensors and 3D-mapping drones, should create a more accurate picture of carbon embedded within urban infrastructures. Learning from the past will also be essential to develop more sustainable building practices.
In particular, we’ll have to readdress our love affair with concrete. It’s a great building material because it’s cheap and resistant to rust, fire and biological pests. Trouble is, its key constituent is cement, which is made by converting limestone (calcium carbonate) into lime (calcium oxide) in a process that spews out roughly a tonne of CO2 for every tonne of cement. Overall, cement accounts for 3% of the world’s carbon emissions.
Wood you believe? Mjøstårnet in Norway (top), designed by Voll Architects, is the tallest wooden building in the world. The football club Forest Green Rovers has commissioned an all-wood design from Zaha Hadid Architects (bottom) for its new stadium in Stroud, UK. (Courtesy: Shutterstock/Kristin Spalder; Zaha Hadid Architects)
Annual global cement production has remained stuck at just over 4 × 10⁹ tonnes over the last decade and ditching concrete is unlikely anytime soon. In his book Making the Modern World, the Czech-Canadian energy researcher Vaclav Smil estimates that China used more cement between 2011 and 2013 than the US did in the entire 20th century. What’s worse is that concrete is often reinforced with steel, the manufacture of which also releases CO2.
Physicists can help by devising cleaner ways of producing cement and steel. But developing alternative building materials will be vital too. Among the promising options are timber, rubber, coconut fibres, bamboo and other “biogenic” materials, all of which have a lower carbon footprint and act as a carbon sink. Large timber buildings are now becoming fashionable, the tallest being an 18-storey, 85 m tower in Brumunddal, Norway. One English football club – Forest Green Rovers – is even planning the world’s first entirely wooden sports stadium.
3 How will clouds influence future climates?
Do you see dolphins, dogs or dinosaurs when you stare at the clouds? You can be forgiven for seeing all sorts of strange shapes as clouds are complex, varying and always changing. Even a seemingly featureless, low-lying stratus cloud is, to meteorologists, a dynamic system with varying temperatures, humidities and wind speeds. In terms of the climate, clouds create a complicated duality: they not only reflect the Sun’s radiation (a cooling effect) but also trap infrared radiation emitted from the Earth’s surface (a warming effect).
On balance, clouds nearer the stratosphere warm us, whereas low-lying clouds tend to cool us because their greenhouse effect is smaller. Taken together, however, clouds in today’s atmosphere have an overall net cooling effect. The crucial question, though, is how clouds form; the key step being water vapour condensing around dust, salt and other aerosol particles to form droplets. When the air cools to its dew point it cannot hold as much water vapour, and it is these isolated droplets that conglomerate into clouds.
Clouds form a very complicated part of the Earth’s climate, having both cooling and warming effects. Understanding cloud formation is key to improved climate models. (Courtesy: iStock/imagedepotpro)
The science gets murkier when linking individual cloud formation with global climate models. “There’s such a vast range of scales we have to deal with – from a planet to a dust speck – and you can’t do all of that at once,” says Steven Sherwood, an atmospheric physicist at the University of New South Wales (UNSW) in Australia, who uses numerical simulations of cloud formation to test assumptions built into global climate models.
Cloud models need to be tested against real-world measurements. Satellites have been tracking clouds for the past four decades, and for 20 years LiDAR has been capturing high-resolution 3D information about cloud dimensions and water content. Experimentalists on the CLOUD project at CERN have even been using cloud chambers to examine the role of cosmic rays in creating aerosols in the atmosphere.
We know that as the average global temperature increases, the greenhouse effect from clouds will increasingly outweigh their reflective cooling powers. By how much, though, is unclear
We know that as the average global temperature increases, the greenhouse effect from clouds will increasingly outweigh their reflective cooling powers. By how much, though, is unclear. Another confusion is that climate models predict that warming will be more pronounced at higher latitudes – but not by as much as in past warm global climates with similarly high greenhouse-gas concentrations.
“One explanation is that we don’t understand some of the cloud processes in settings where temperatures are warmer, or when there were much higher methane concentrations in the atmosphere,” says physicist Katrin Meissner, who is director of the USNW’s Climate Change Research and another co-chair of IOP Publishing’s conference. Whatever the reason, understanding the impact of changing cloud cover will be vital.
Global warming of more than 2 °C above pre-industrial levels will make countries at higher latitudes cloudier, wetter and more likely to suffer from flooding. The extreme flooding that resulted in at least 200 fatalities, the majority in Germany and Belgium (see photo at top of article) could be a grim marker of things to come. Most subtropical regions, in contrast, will become drier, increasing risks of drought and wildfire in the Mediterranean, Middle East and Australia. As for the tropics – where rain is vital for food security – we are even less certain.
4 Can we safely store enough carbon underground?
Extracting CO2 from industrial plants and pumping it underground might not have the green glamour of an elegantly rotating wind turbine. But if deployed at scale, carbon capture and storage (CCS) technology could be crucial in reaching net-zero global emissions by 2050. The basic principles are almost a century old, and the first commercial CCS project designed specifically to combat climate change – the Sleipner project off the Norwegian coast – opened in 1996. It’s been sequestering a million tonnes of CO2 annually ever since.
Capturing CO2 directly from the air isn’t easy, as its concentration there is so low. That’s why many commercial CCS efforts instead extract it directly from the exhaust gases at power plants. The gas is usually compressed into a supercritical fluid state and then pumped into porous rocks covered with impermeable “caprocks” that form a natural seal. Geologists have identified plenty of suitable storage sites around the world and most climate-mitigation scenarios that limit warming to 2 °C above pre-industrial levels include a lot of CCS.
But despite Sleipner’s success, there are just 26 commercial CCS facilities currently in operation, which together store barely a few million tonnes of CO2 from the 35 billion tonnes emitted each year. It’s an energy-intensive process, with chemical solvents and heat usually separating the CO2 from flue gases, and energy needed to liquefy the CO2, transport it and pump it into rocks. Then there are the ongoing costs of building and maintaining infrastructure.
For CCS to be used more widely, it must become more energy efficient and economically viable. To improve the capture process, researchers will need to develop better chemical processes or design nanoscale membranes to filter the gas instead. On the storage side, one option is to reuse redundant infrastructure from the oil and gas industry in well-surveyed geological settings. That at least is the aim of the Acorn project, which would be the UK’s first commercial CCS plant when it opens in the mid-2020s. Based at the St Fergus gas terminal in north-east Scotland, it will repurpose North Sea gas pipelines to transport CO2 to a site roughly 80 km from the coast, where it will be pumped into sandstone lying underneath shale.
Avoiding leaks will be vital too, although supporters of CCS insist there are fewer risks of that happening over time as CO2 gradually dissolves, sinks and then gets trapped in pores before eventually precipitating out as carbonate minerals. “CCS contrasts very much with nuclear waste storage, where over time we know there are going to be problems,” says Martin Blunt, an engineering physicist at Imperial College London. “CO2 storage is not like that.”
But industrial negligence does happen. And can we be sure the CO2 won’t gradually seep to the surface over millennia? Fortunately, when researchers from the universities of Aberdeen, Barcelona and Edinburgh modelled leakage rates in different scenarios, they found that well-regulated storage should keep leakage below 0.0008% per year, with over 98% of the injected CO2 stored over 10,000 years (Nature Comms 9 2201). Even with multiple abandoned wells, more than 78% would be retained, the study found.
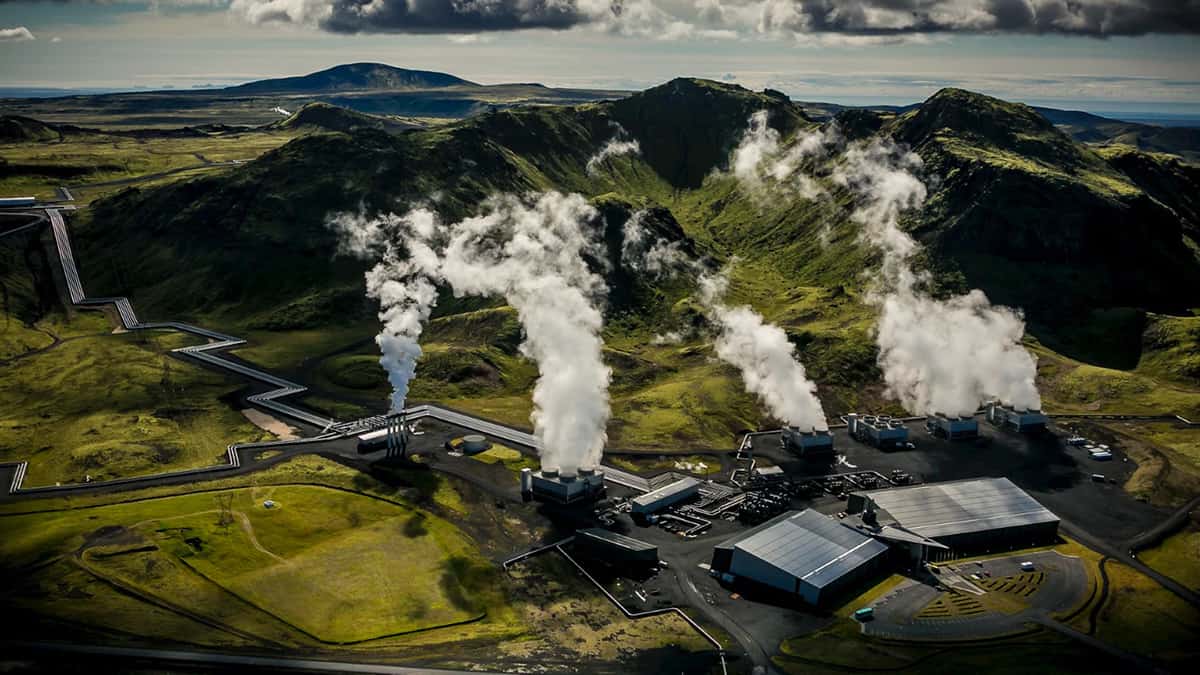
Disappearing act Run by Reykjavik Energy, the CarbFix project takes gases from Iceland’s Hellisheiði geothermal power plant and stores them in basalt rocks 400 m underground. The company also has pilot projects to apply CarbFix to steel, iron and cement production. (Courtesy: CarbFix)
Juan Alcalde Martín, a geoscientist at the Geo3bcn research lab in Barcelona, who led the study, thinks that geophysicists can help by characterizing saline aquifers and other less surveyed rock formations that could also be used for CCS. One novel approach is being taken by Reykjavik Energy, an Icelandic company whose CarbFix project involves injecting CO2 into basalts. These rocks mineralize the gas – essentially turning it into stone – much faster than sedimentary rocks can. And although the process uses a lot of water, the beauty of basalt is that it can be found below most of the world’s oceans.
But no matter how enticing individual solutions appear, adapting to live with our changing climate will require a mix of actions, with physicists playing a key part. “I encourage everybody to join the movement to make the world more sustainable,” says Horvath at Berkeley. “It might have been a slogan 30 years ago; it might have even been a slogan 10 years ago. Now it’s a necessity.”
IOP Publishing’s Environmental Research 2021 virtual conference is free to attend and runs from 15 to 19 November.