Physicists have taken a step towards realizing the smallest-ever solid-state laser by generating an exotic quantum state known as a Bose-Einstein condensate (BEC) in quasiparticles consisting of both matter and light. Although the effect has so far only been observed at ultracold temperatures in atomically thin crystals of molybdenum diselenide (MoSe2), it might also be produced at room temperature in other materials.
When particles are cooled down to temperatures just above absolute zero, they form a BEC – a state of matter in which all the particles occupy the same quantum state and thus act in unison, like a superfluid. A BEC made up of tens of thousands of particles therefore behaves as if it were just one single giant quantum particle.
“Devices that can control these novel light-matter states hold the promise of a technological leap in comparison with current electronic circuits,” explains Anton-Solanas, who is in the quantum materials group at Oldenburg’s Institute of Physics. “Such optoelectronic circuits, which operate using light instead of electric current, could be better and faster at processing information than today’s processors.”
Anton-Solanas, Schneider and colleagues studied crystals of MoSe2 that were just a single atomic layer thick. MoSe2belongs to a family of materials known as transition-metal dichalcogenides (TMDCs). In their bulk form, these materials act as indirect band-gap semiconductors, but when scaled down to a monolayer thickness, they behave as direct band-gap semiconductors, capable of efficiently absorbing and emitting light.
In their experiments, the researchers assembled sheets of MoSe2 less than a nanometre thick and sandwiched them between alternating layers of silicon dioxide and titanium dioxide (SiO2/TiO2), which reflect light like a mirror. The resulting structure is known as a microcavity and acts like a cage for light. “It’s like trapping the light-emitting material in a room filled with mirrors and mirrors only,” Tongay tells Physics World. “The light gets reflected these mirrors and is absorbed by the material back and forth.”
Sudden increase in light emission
The team cooled the system to 4 K and stimulated it with short pulses of laser light to produce excitons in the MoSe2. These excitons then coupled with light in the microcavity to generate the exciton-polaritons. Using a technique called momentum-resolved micro-photoluminescence spectroscopy, the researchers observed a sudden increase in the light emission from the sample above a certain threshold laser intensity. The researchers say that this, together with the build-up of interference fringes from the polariton light emission, indicates that a BEC had been created from exciton-polaritons.
“In theory, this phenomenon could be used to construct coherent light sources based on just a single layer of atoms,” says Anton-Solanas. “This would mean we had created the smallest possible solid-state laser.”
The researchers, who report their work in Nature Materials, are confident that the effect could also be produced at room temperature in other exitonic materials, such as tungsten-based TMDCs or organic halide-based materials. This means it could be exploited in practical applications. To this end, they are now looking for condensation signatures by studying the interference properties of tungsten diselenide polaritons at room temperature.
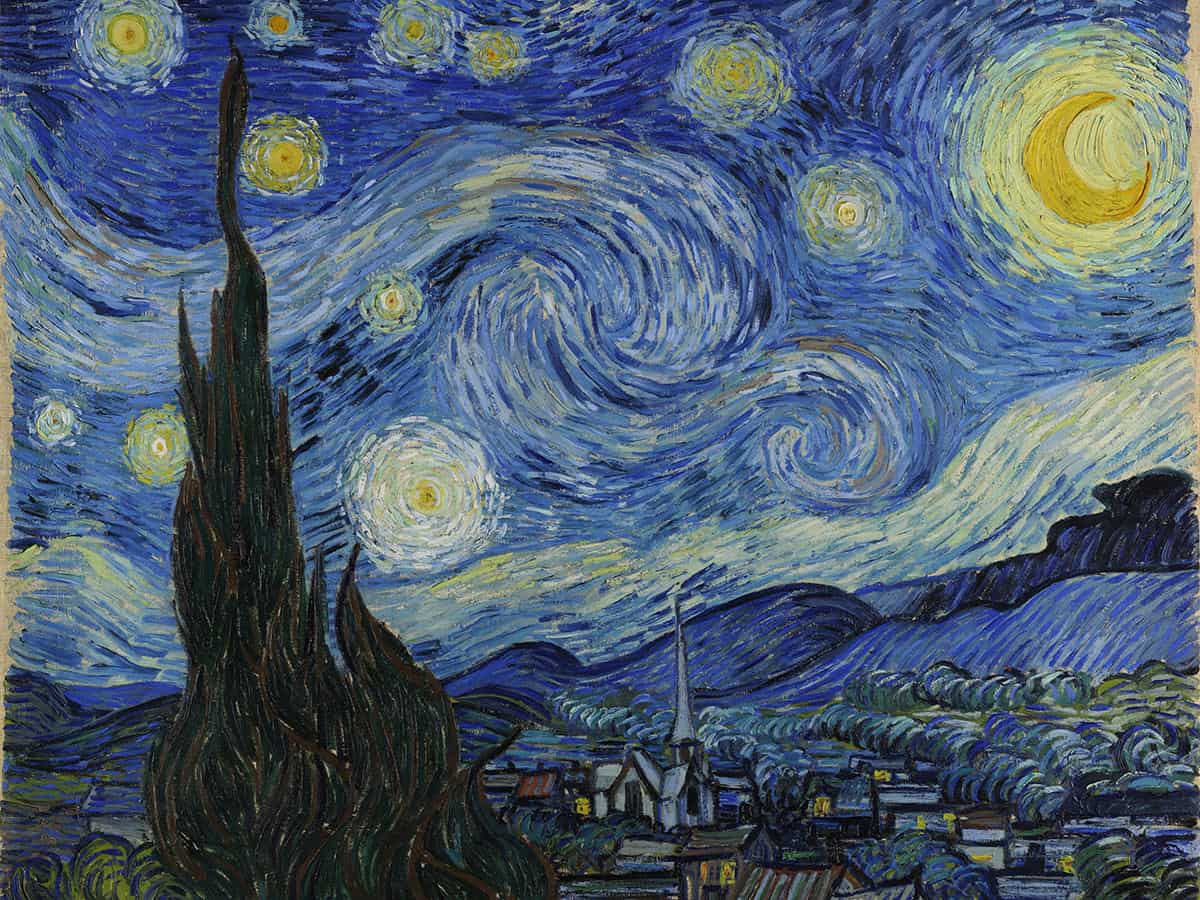
Look up the word “physics” on Google Images, and what you see may surprise you. If, like me, you were expecting to mostly see photos of Albert Einstein and atomic diagrams, you may be somewhat puzzled to find the top search page dominated by a rather different aesthetic – photos and illustrations of chalkboards covered in equations and diagrams. A similar search for “biology” mostly shows a page of DNA helixes, while “chemistry” rather expectedly throws up lots of test tubes. Search for the word “art” instead and one of the first images to pop up is Vincent Van Gogh’s The Starry Night. Painted in 1889, it is still one of the most famous depictions of the night sky.
Looking up these terms and the related images on Google gives us a quick insight into the visual trends carrying an idea at a particular time and place. Indeed, it can give us a pictorial sense of how other people perceive something, beyond our own frames of reference. When physicists make notes on a chalkboard, it is usually to work through an idea or devise a solution, and it is most often done while communicating with peers or students fluent in the same language of mathematics. So given that the visual detail won’t mean much to most people, it’s fascinating that the low-tech, equation-filled chalkboard is so prominent as a visualization of physics in the public sphere.
A powerful argument for the enduring visual power of the chalkboard is found in a work by Turner Prize nominated, multidisciplinary artist Goshka Macuga. In 2018, among other work, Macuga curated nine chalkboards by contemporary physicists in her installation called Untitled (see above). The language of mathematics, specifically equations, “supposedly has the capacity to describe things in a more truthful and universal way than any other language we use to communicate with one another”, says Macuga. “This has always been a very seductive concept to me.” As an artist, she has met many scientists over the years through her art projects. When she’s had the chance to include their written ideas in her work, she describes it as “an honour and a great joy”.
For Macuga, the chalkboards function as artefacts – they represent and question the ways in which we categorize knowledge in different fields of research. “The information embedded in [them] represent a subjective approach in each individual gesture, but once contextualized with each other, open up a possibility of greater narrative,” she says. “The medium of chalk on board is timeless, and very intimate in comparison to other ways we use to register our thoughts and ideas nowadays, not only in the arts but also in science, making them even more precious and unique.”
Online, where the iconography of “physics” is seemingly a board covered in equations, there may be something to bring with us from this artistic context – that this kind of imagery finds meaning and connections with audiences in telling the story of the human process within physics.
Cosmic concepts
In many ways, visual depictions transcend the need for an academic understanding of science, to simply be inspired by the topic at hand. This in turn allows physics to be more meaningfully encountered by the public. Exploring the more complex ideas in physics through visual means spills over in the way that artist Shanthi Chandrasekar talks about her work. “Whatever I have wanted to learn, I do it through art. Because this is my easiest medium, when I start drawing, or building using my hands, then the communication is so much more fruitful.”
Visual depictions transcend the need for an academic understanding of science, to simply be inspired by the topic at hand – and this in turn allows physics to be more meaningfully encountered by the public
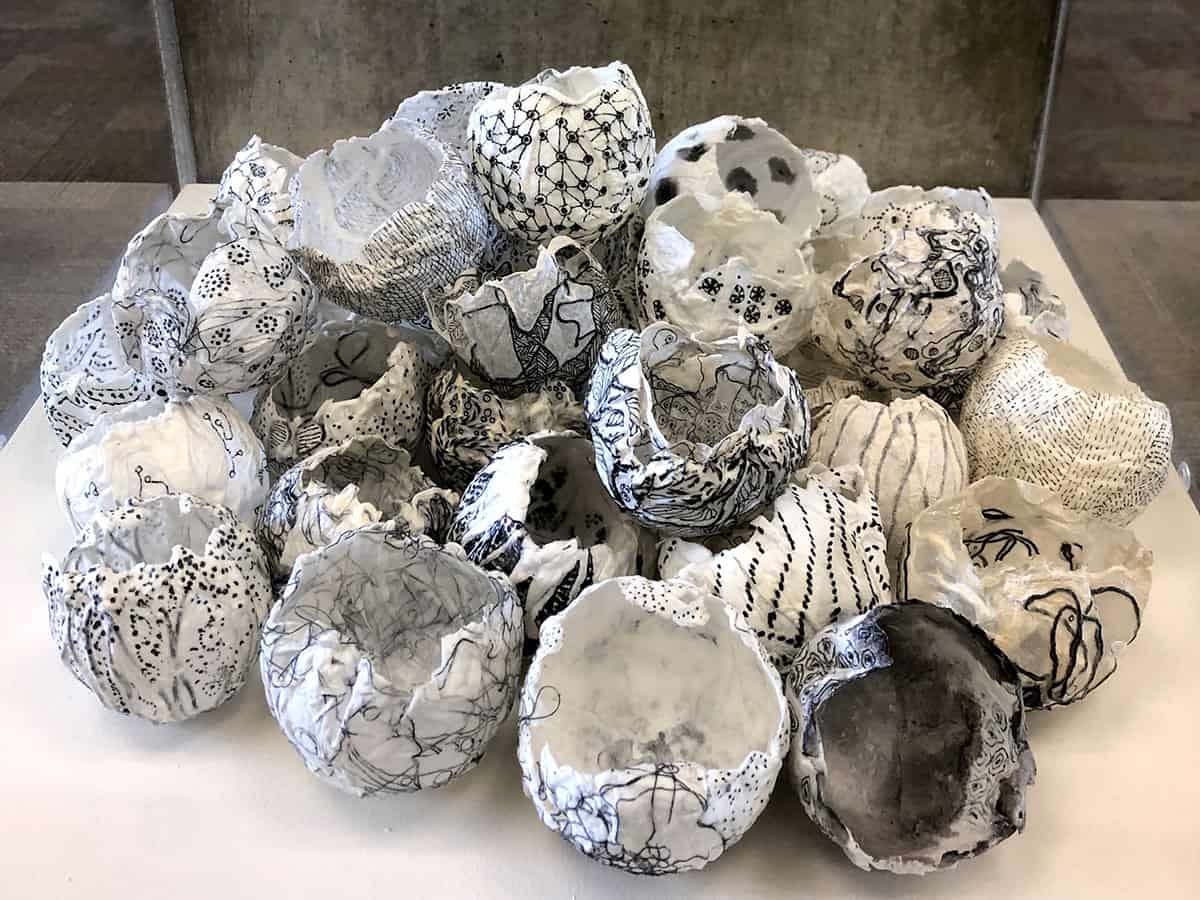
In her work Multiverse(see below), she created handmade paper universes, presenting a 3D layering of ideas in physics, interwoven with the cosmic philosophies from sacred Sanskrit verse. Inspired by inflationary theory and the Hindu goddess Aneka Koti Brahmanda Janani who births multiple universes, Chandrasekar’s process of making these eggshell remnants of universes allowed her to explore conceptual questions. “What if I change the rules and the laws of physics in all these eggshell universes? What would happen if they had different dimensions, or if the cosmological constant changed in that part of the universe? And these questions kept coming. I would add my take on it – with very simple lines of all the various possibilities.”
I’m struck by how Chandrasekar’s work manages to capture a sense of the theory of multiverses, the beauty in the infinite possible differences, as well as the fragility of our ability to comprehend these ideas. The visualization of these ideas is about the feeling of that cosmic big picture rather than didactic detail, something Chandrasekar thinks deeply about. “I wasn’t sure if it’s scientific enough, because I brought culture, I brought a traditional art form into it. And I was not sure how scientists would respond to that.” As it turned out, the answer to that question is very positively. Multiverse has been presented at Fermi National Accelerator Laboratory in the US, and internationally.
Cosmic spheres Shanthi Chandrasekar, Aneka Koti Brahmanda/Multiverse, installation at Fermilab, 2019. Handmade paper, thread, resin, pen and ink, 2015. The artwork’s title in Sanskrit refers to a Hindu goddess who births multiple universes, and can be translated as ‘several million cosmic eggs’. (Courtesy: Shanthi Chandrasekar)
Working in science communication over many years – and, most recently, curating experiences at the intersection of art and science at We The Curious, a science centre in Bristol, UK – I’ve often heard concern from scientists that artists will get the science “wrong”. But this assumes that artistic imagery and exploration are somehow mainly in service to science, to provide accurate explanations. Where does that leave the space for people to simply have access to a feeling of wonder, curiosity and delight in the ineffability of the edges of physics? There’s a vital place for this alongside teaching and more literal data visualizations or illustrations of ideas in physics.
Interpretative arts
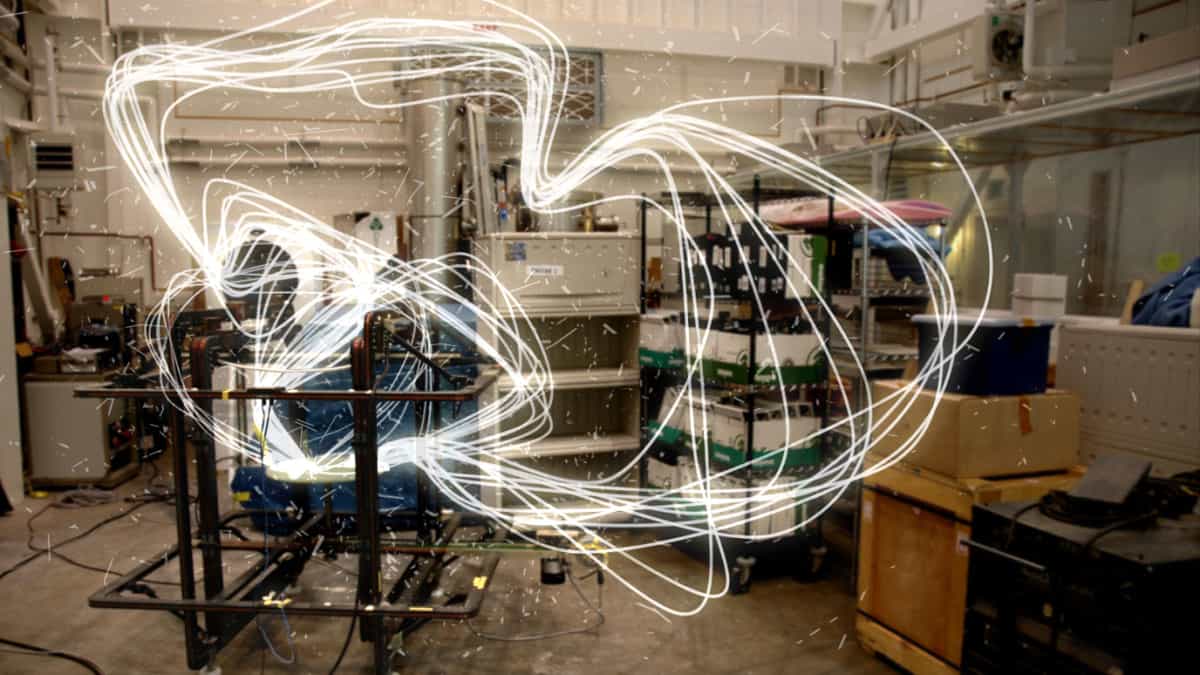
“Art isn’t about illustration. Art is where you see something from a different perspective, a different angle, it’s a new way of seeing.” Back in 2007 UK artist duo Ruth Jarman and Joe Gerhardt – who jointly go by the name “Semiconductor” – were on a fellowship at NASA’s Space Sciences Laboratories at the University of California, Berkeley, where they talked to physicists studying magnetic fields on Earth and other planets. The two artists noticed the creativity of language that physicists had to employ in explaining their work, as they were exploring the raw planetary data and plot lines representing the magnetic fields. “They’re all interpretations of magnetic fields. And what do they really look like when you bring them all together?”
The visual, and audio, answer to that question became a short film titled Magnetic Movie (see movie still below). Set in the laboratory, it combines recordings of physicists talking about their work, with very low frequency recordings of the Earth’s magnetosphere, along with animated field lines inspired by the data. The resulting work is mesmerizing. So much so that some people watching it in the early days of YouTube weren’t sure whether it was a film of real physics phenomena and experiments in motion or simply special effects. Semiconductor don’t encounter those reactions anymore, perhaps as audiences have become used to digital visualizations in all areas of our lives. “In our work, a lot of the time we’re dealing with phenomena that exist beyond our perceptions of physical scales or timescales. And so we always bring things down to a human scale, so we can experience them directly,” say the duo. “We’re giving people the confidence to ask questions of science. Science is a constantly evolving question. And people aren’t taught that; nearly everybody just assumes science is the answer.”
More than meets the eye Still image from Magnetic Movie by Semiconductor, 2007. This short film combines recordings of physicists talking about their work, with very low frequency recordings of the Earth’s magnetosphere, and animated field lines inspired by the data. (Courtesy: Semiconductor
Most of the time, scientists control the images chosen to represent their work, as they make aesthetic visual choices about their data. Semiconductor point to the Hubble Space Telescope. The stunning images the public have seen are all manufactured in some sense, with false colouring applied and aesthetic choices being made in selecting a few for publication. “ And of course, [the pictures] give no understanding of how that image is being captured, or what it really looks like out there. In a way science has created its own myths.”
Perfect imperfections
This poses an interesting question for visualizing physics. So often, physics is presented to audiences via the polished end product, a result, a perfect image. And yet, many artists would prefer to explore the raw data, before the algorithms have been applied to filter out the noise. When the BBC became interested in another Semiconductor project, for the TV series Wonders of the Solar System, it was attracted to the work the pair had done in visualizing raw, noisier data. “When you can see all these artefacts and all the noise, that tells you something about the capturing process, and we were really interested in that,” say Jarman and Gerhardt. Now, the TV programme makers often go a step deeper into the process of physics, asking for raw data to generate their visuals, instead of only the final, glossy images. “Audiences have such a different journey when they’re engaging with noise, which is what we deal with every day. They have more of a connection to it, more of an understanding, so they don’t feel so removed from science.”
Playing with imperfections in the observing process was what led astrophotographer Steve Brown to produce a compelling visualization of the many colours of the star Sirius. “I wanted to create an image that presented the twinkling of Sirius frozen in time. The best way of doing this, I realized, was video.” After experimenting with different camera settings, Brown worked out that the best way of capturing the rapid scintillations in starlight over a short period of time was to deliberately capture the star out of focus.
Twinkle twinkle little star Steve Brown, The Rainbow Star, 2016. These frames from a video of the star Sirius show the variety of colours that make up its characteristic ‘twinkle’. (Courtesy: Steve Brown)
“Choosing the best frames from the video, I was amazed at the sheer variety of colours captured with this method. Initially, I began to group the colours together into a kind of spectrum montage, but I didn’t think this looked particularly aesthetically pleasing.” So he chose a simple grid arrangement and in doing so, created a visualization of a physics phenomenon that’s now been featured in art books and photography competitions (see above). “Hopefully, the way I have presented the image inspires the viewer to think about why stars twinkle and the science behind it, while also appreciating the beauty to be found in the night sky.”
Why visuals matter
Our brains are wired to respond to images – we process them tens of thousands of times faster than we do words, and we recall images more readily than text. As social media develops to be increasingly visual, with the rise of apps such as TikTok and Instagram, and with images flying around the world in seconds, what things look like really matters. Visualizations of ideas and phenomena, whether they are direct representations or abstracted forms, communicate across disciplines – but they can also wield an unconscious power within disciplines, changing them for the better.
In her breakthrough book Doughnut Economics: Seven Ways to Think Like a 21st Century Economist, economist Kate Raworth set out to change the world – to communicate a new economic model for the future, an alternative to the endless unsustainable growth that’s breaking society and the environment. She realized that to change our view of economics and the practice of economics itself, she needed to change how it’s visualized.
Essential boundaries The Doughnut model of economics, a visual framework for sustainable development, from Kate Raworth’s Doughnut Economics (Penguin Random House 2017). (Courtesy: Kate Raworth and Christian Guthier. CC-BY-SA 4.0)
In replacing the old exponential GDP growth curves and circular-flow-of-income diagrams with a visual for regenerative, sustainable economics; her “Doughnut model” has attracted global attention (see left). “Many people told me that the Doughnut made visible the way that they had always thought about sustainable development, they had just never seen it drawn before,” writes Raworth. She adds that her new model “helped to reinvigorate old debates and instigate new ones, while offering a positive vision of an economic future worth striving for. Visual frames, it gradually dawned on me, matter just as much as verbal ones.”
Might there be longstanding graphs and diagrams in our high school physics textbooks that are keeping us unhelpfully stuck within old paradigms? Sometimes a new visualization opens up new ways of thinking about things within physics. Indeed, when physicist Richard Feynman introduced his eponymous diagrams, they became a powerful tool for calculating probabilities of the outcomes of processes in particle physics. If more physics textbooks included visualizations from the world of art – instead of the dated black-and-white diagrams most students are used to seeing – perhaps it would better suit those who learn visually.
Challenging perceptions
Let’s not slip towards instrumentalizing visualizations of physics, however. When asking what physics looks like, the question is really how these images make people feel around ideas in physics; how a visualization of something can reinforce or challenge perceptions, generate questions or simply express something beyond words. Physics and art both play at the edges of the sublime, the ineffable, and can also ground us in our collective, daily human experience.
In some ways, physics has been absorbed into the popular consciousness, as part of our visual cultures – from chalkboards and Hubble images, to the conceptual exchanges between Einstein and Pablo Picasso, to contemporary collaborations between artists and physicists at laboratories such as CERN. Indeed, it’s likely that sketches of spiral galaxies informed the recognizable swirls in Van Gogh’s The Starry Night (see below). The artist may have encountered one of the earliest sketches of spiral nebulae in Camille Flammarion’s popular astronomy books of the 1870s and 1880s. These would have included the Earl of Rosse’s sketches of the Whirlpool Galaxy (M51), which he discovered through his telescope in 1845.
Looking up Vincent Van Gogh, The Starry Night, 1889. Oil on canvas. Held in the permanent collection of the Museum of Modern Art in New York City since 1941, acquired through the Lillie P Bliss Bequest. (Courtesy: Vincent Van Gogh/Google Art Project)
What does physics look like? That’s up to you, to all of us. Does it matter? The more people who can connect to physics, the more ideas flow between disciplines, the better the outcome for science and society.
All art is, of course, subjective, and different visualizations will resonate with different people. Some – such as Rutherford’s representation of the atom – are more enduring than others. When I wonder what imagery of physics might dominate in 10 years’ time, I can only hope it reflects the intensely imaginative and evocative visual world of physics and the conceptual landscapes it explores.
Researchers in the US may have found the first hard evidence that the electron is made up of two distinct particles. According to N Phuan Ong and colleagues at Princeton University, the observation of “spin-charge separation” in a material known as a quantum spin liquid suggests that the electron is not a structureless “point” particle as is commonly thought, but instead behaves like it contains two separate entities.
Quantum spin liquids (QSLs) are solid magnetic materials that cannot arrange their magnetic moments (or spins) into a regular and stable pattern. This so-called “frustrated” behaviour is very different from that of ordinary ferromagnets (in which all the spins point in the same direction, either “up” or “down”), or antiferromagnets (in which the spins point in alternating directions, “up-down” or “down-up”).
Quantum mechanics describes this frustration by suggesting that the orientation of the spins is not rigid. Instead, it constantly changes direction in a fluid-like way to produce an entangled ensemble of spin-ups and spin-downs. Thanks to this behaviour, a spin liquid will remain in a liquid state even at temperatures near absolute zero, where most materials usually freeze solid.
The holon and the spinon
To describe this behaviour in mathematical terms, the late Nobel laureate Philip W Anderson, who predicted the existence of spin liquids in 1973, proposed that in the quantum regime, an electron might in fact be composed of two distinct particles. The first, known as a “holon”, would bear the electron’s negative charge, while the second “spinon” particle would carry its spin. Anderson later suggested that this spin-charge separation might provide a microscopic mechanism to explain the high superconducting transition temperatures (Tc) that were observed in copper oxides, or cuprates, beginning in the late 1980s.
In the new study, Ong and graduate students Peter Czajka and Tong Gao set out to identify signs of the spinon in ruthenium (III) chloride, RuCl3. This antiferromagnetic material closely resembles the ideal Kitaev honeycomb model for a spin liquid, and undergoes a transition to a spin liquid at a temperature of 0.5 K in the presence of a strong magnetic field (between 7 and 11.5 Tesla). This is the field interval over which the spin liquid state is stable, Ong explains.
In their experiments, which they detail in Nature Physics, the researchers placed crystals of RuCl3 in an ultracold bath held at temperatures just above absolute zero. They then applied the magnetic field and a small amount of heat to one edge of a crystal and monitored its thermal conductivity. According to theory, spinons, if they are present, should appear as an oscillating pattern in the plot of thermal conductivity versus applied magnetic field.
Extremely small signal
The amount of heat applied is extremely small, equating to a temperature change of just a few hundredths of a degree. This meant that the researchers had to control the temperature of their sample very carefully, while using very sensitive thermometers to measure how it changed. They also made their measurements on the purest crystals available, as provided by David Mandrus’ group at the University of Tennessee-Knoxville and Stephen Nagler in the Neutron Scattering Division of Oak Ridge National Laboratory.
In their study, which was performed over nearly three years, Ong, Czajka and Gao detected temperature oscillations that imply the presence of spinons. These freely moving spin excitations can be considered as (uncharged) analogues to electrons in a metal even though RuCl3 is an excellent insulator with a large electronic bandgap.
In their previous work, the researchers found that these oscillations slowly die away as the temperature increases from 0.5 to 5 K, replaced by an in-plane thermal Hall effect. “We have been investigating this effect in much detail and have many questions surrounding the twin phenomena,” Ong notes. “Is the thermal Hall effect quantized? Where does it come from? And what is its physical nature? We will be providing a detailed report on this study in a forthcoming paper,” he tells Physics World.
Topology is a form of mathematics that describes the properties of objects that do not change during continuous deformations. The old joke is that a topologist struggles to tell the difference between a coffee mug and a doughnut. Both shapes have a single hole and if the doughnut was made of a sufficiently pliable material it could be reshaped into a coffee mug without being torn.
Physicists have been particularly excited about topology since the mid 2000s, when the first experiments verified types of materials known as topological insulators. These exotic materials are insulators in their bulk but their surfaces can conduct like metals.
This video introduces topological materials and why they hold so much promise for emerging technologies such as quantum computing. But today topological research is certainly not limited to solid-state physics. Scientists are also starting to apply some of the mathematical concepts to understand complex fluid dynamic systems in earth sciences, biology, and the way plasma is controlled by magnetic fields inside a tokamak in the quest for practical nuclear fusion.
For a more in depth look at the latest developments in topological research see this feature article by science writer Jon Cartwright, originally published in the June 2021 issue of Physics World.
On 14–18 June Physics World is celebrating Quantum Week, so today’s Red Folder is celebrating the growing influence that quantum science and technology is having on society.
The Canadian rapper and playwright Baba Brinkman is not a physicist, but that hasn’t stopped him from writing and recording this wonderfully clever rap about quantum computing. Called “Qubits”, the song is from his twelfth full-length album Bright Future, which also includes the tracks “Molten salt” and “Stirling engine”. Brinkman is so serious about science communication that his album’s liner notes provide references for further reading.
Indeed, “Qubits” – which was cowritten by J Simmonds, AKA Mr Simmonds – was produced with support from Google’s AI Quantum Lab and its founder Hartmut Neven acted as technical consultant. That’s not surprising given the high technical standard of the lyrics. But it’s also great fun and physicists will enjoy the quantum iconography that is used as a backdrop to Brinkman’s performance.
Interpreting science via the medium of dance has become a popular form of artistic expression thanks in part to the Dance Your PhD competition, which is run each year by the American Association for the Advancement of Science and the journal Science.
Now, physicists at the University of Leeds in the UK are asking you to help them express concepts of quantum mechanics in dance. Called Dancing Quantum Magic, the project aims to collect clips of the public do four quantum-related dance moves. One is called “Pattern and chaos” and looks to me like the sort of languid dance you might do towards the end of a heavy night out. The others are “Emergence”, “Melting and reforming” and “Entanglement (Parts 1&2)”.
Recording your own versions of these dances looks like fun. And if you submit them to the Leeds physicists, they will edit them together into a short film.
Tricky explanations
Getting people to dance quantum mechanics is sure to spark their interest in things like quantum computers. Sparking an interest is one thing, but how do you explain the tricky concepts of quantum computing to the public without oversimplifying or getting it wrong?
That is something that I really struggle with as a physics journalist, so I was very pleased to see that the quantum-computing expert Scott Aaronson has written about it. His article – appropriately published in Quanta – is called “What makes quantum computing so hard to explain?” and it’s a worthwhile read.
Quantum repeaters that can store multiplexed signals; provide heralded signals of entanglement; and operate at telecommunications wavelengths have been developed by two independent research teams. Their work could prove to be an important step towards the creation of a scalable quantum internet.
If it can be built, a quantum internet would allow calculations to be distributed between multiple quantum computers – allowing larger and more complex problems to be solved. A quantum internet would also provide secure communications because eavesdropping on the exchange of quantum information can be easily identified.
The backbone of such a quantum network would be quantum-mechanically entangled links between different network points, called nodes. However, creating entangled links over long distances at high data rates remains a challenge. A big problem is that quantum information becomes degraded as it is transmitted, and the rules of quantum mechanics do not allow signals to be amplified by conventional repeater nodes. The solution could be quantum repeaters, which can amplify quantum signals while still obeying quantum physics.
Quantum memory
Now, two independent research groups — one at the Institute of Photonic Sciences (ICFO) in Spain and the other at the University of Science and Technology of China (USTC) – have shown how quantum memories (QM) offer a path towards practical quantum repeaters.
Both teams’ approaches use photon-pair sources, where one photon is stored in the QM and the other is used as a signal to herald (or confirm) the entanglement. Multiplexing, by means of storing several signals at once using different photon wavelengths, is performed via atomic frequency comb protocols. This means that the systems do not have to wait for a successful heralding event before generating the next entangled pair. Equally important is that the heralding photons are at telecoms wavelengths, making the systems compatible with existing telecoms networks and allowing entanglement to be created over long distances using optical fibres.
The ICFO system uses a QM that stores photons in millions of atoms all randomly placed inside a rare-earth doped crystal. The team uses a set of photons at different wavelengths. One at 606 nm for storage, one at 1436 nm (telecom wavelength) for signalling that entanglement is achieved. The QM can store the signals for up to 25 µs, before releasing the signals. Entanglement is achieved between two QMs by storing a single photon in a superposition over the two QMs placed in different labs 10 m apart.
Bell-state measurement
Meanwhile in China, the USTC team used QMs based on rare-earth-ion-doped crystals. The team built an elementary link with an intermediate station and two nodes at the ends. Each node contains a QM where one entangled photon of each photon pair was stored for 56 ns before being released for analysis, while the other was transmitted to the middle station for joint Bell-state measurement (BSM). A successful entanglement swapping operation was heralded by the successful BSM and entanglement was established in between two QMs placed 3.5 m apart.
Commenting on its work, ICFO group leader Hugues de Riedmatten says, “Several technical challenges had to be overcome, like the frequency stabilization of the set-up and controlling the length of the optical fibres to within a few hundreds of nanometres. We are now working on improving the performances of the sources and quantum memories to get longer storage times and on-demand read-out of the stored qubits. We progress towards a multi-node network and longer distances with quantum repeaters and to perform entanglement swapping between links.”
Zhou Zongquan at USTC says, “Our work shows a complete demonstration of an elementary link of a quantum repeater based on absorptive memories.” On future developments he adds: “We will update the light source to a deterministic entanglement source to greatly enhance the entanglement distribution rate. Overall the performances of the memory should be greatly enhanced, including efficiency, lifetime and multimode capacity and be optimized according to the applications of a practical quantum repeater.”
“Important achievement”
Ronald Hanson at Delft University of Technology in the Netherlands is positive about both teams’ achievements: “These results can be considered an important achievement in the specific context of building quantum repeaters, towards improved transmission of quantum communication over long distances. For solid-state ensemble-based memories, these push the state of the art significantly. Most important is the combination of operation at telecom wavelengths, heralding signals of entanglement and multiplexing ability. Improved performance of the memories in the future will enable full heralding as required for scaling towards useful quantum repeater systems.”
Rodney Van Meter at Keio University in Japan also praises the work: “Both teams (albeit different in the details) have each achieved something remarkable: creating two entangled photon pairs, storing two photons in separate memories some distance apart while bringing the remaining two together to conduct a joint measurement. Afterwards, the two stored photons are released where their successful entanglement is measured.” He adds that it is still early stage and significant improvements need to be made: “The trial rates and success probabilities still need to come up, but every day, it seems, brings us a new result that moves us a step closer to a practical quantum internet.”
Papers describing the USTC and ICFO research are published in Nature.
Understanding the forces behind blood clot formation could be the key to improving heart attack prevention methods, according to researchers from University Hospital of the RWTH Aachen in Germany.
Their proof-of-concept study, published in eLife, uses patient-specific computer models to examine the forces responsible for coronary plaque rupture. Plaques are fat deposits that can line the heart’s arteries; if a plaque breaks away from the artery wall, it can form a clot and subsequently cause a heart attack. Knowing when and where a plaque might rupture, based on the stresses exerted upon it, could allow physicians to provide life-saving preventive care.
“Including such analyses in clinical practice might allow cardiologists to predict a future myocardial infarction [heart attack] by looking – among other factors – at the stress distributions in diseased vessels,” says study author Mathias Burgmaier in a press statement.
Modelling plaque rupture
Coronary plaques consist of a layer of fibrous connective tissue (fibrous cap) covering a lipid-rich necrotic core. It is known that the cap fails when it is subjected to forces higher than its tensile strength. Nevertheless, the disruptive forces driving this biomechanical stress are not well understood.
“This may limit our ability to recognize and treat high-risk lipid deposits before they cause a myocardial infarction,” says co-first author Andrea Milzi. Cardiologists can use morphological characteristics such as fibrous cap thickness (FCT) to predict whether a plaque is vulnerable to rupture. FCT alone, however, does not provide an indication of where the rupture will likely occur.
In their study, the researchers combined high-resolution optical coherence tomography (OCT) imaging with finite element analysis to simulate how stress is distributed within the artery wall. They obtained OCT images from 20 patients with type 2 diabetes and coronary artery disease. “These analyses are particularly important in high-risk patients with type 2 diabetes,” explains Nikolaus Marx, head of Internal Medicine I, one of the largest cardiology departments in Europe.
All of the patients presented with coronary plaques. In each case, the researchers analysed the maximal stress in both the fibrous cap and the plaque as a whole. They discovered that the stress was up to fourfold higher in ruptured plaques compared with stable ones. What’s more, 50% of ruptures occurred in the immediate proximity of the highest cap and plaque stress. This spatial correlation between maximal stress and rupture not only suggests that high stress concentrations play a mechanistic role in plaque rupture, but that the stress pattern is influenced by plaque morphology. And it’s not just location: the model can also provide an estimate of the magnitude of force needed to promote cap failure.
“Our pilot study shows that OCT-based analysis of the forces within the vessel wall is a feasible tool to carry out patient-specific assessment of biomechanics in coronary lesions,” says Burgmaier.
The approach shows excellent potential for clinical application, scoring more highly on a diagnostic efficiency test than pure FCT analysis. Moving forward, the researchers aim to test their method on a larger number of patients and explore automation.
Quantum science and technology is growing by leaps and bounds as more physicists choose careers in quantum physics and new companies spring up to develop quantum processors and other devices.
In this episode of the Physics World Weekly podcast we meet Maria Violaris and Ieva Čepaitė who are both doing PhDs in quantum science and technology – and we find out what drives their passion for working in the quantum world. Čepaitė is at the University of Strathclyde in Glasgow, where she focuses on quantum computing from both the theoretical physics and computer science perspectives. Violaris is at the University of Oxford where her research looks at the foundations of quantum information with a special interest in quantum thermodynamics.
The week of 14–18 June is Quantum Week at Physics World, and we give a taster of the broad range of coverage that we will be devoting to quantum science and technology next week. You can also listen to a Physics World editor take our Harwell Campus quantum quiz, and see if you can beat his score.
This June we will bring you Quantum Week – a series of free-to-attend scientific presentations in the field of quantum science and technology. Presentations will be on topics including quantum processors, the ethics of quantum computing and computational advantage. Find out more and register today.
Even if you’re not able to join the live events, registering now enables you to access the recordings as soon as they are available.
Robust new calibration standards for studying materials at extreme pressures have been developed by researchers in the US. Dayne Fratanduono at the Lawrence Livermore National Lab (LLNI) and colleagues used dynamic compression experiments to establish clear relationships between the pressures and volumes of both gold and platinum at terapascal (TPa) pressures. These standards could better co-ordinate the findings of independent high-pressure experiments and theoretical predictions.
Terapascal pressures are tens of million times greater than atmospheric pressure and have profound effects on structures of atoms and the intermolecular forces that hold materials together. Indeed, the quantum mechanical pressure that prevents an electron from being sucked into an atomic nucleus is in the terapascal range.
Giant planets
Such pressures can transform gases such as hydrogen, oxygen, and xenon into solid metals and even make some materials room-temperature superconductors. Terapascal pressures can be found at the centres of giant planets – with Jupiter having core pressures as high as 7 TPa. As a result, the ability to reliably study materials at terapascal pressures in the lab benefits astronomers and materials scientists alike.
Experiments that generate extreme pressures tend to fall into two categories: static and dynamic. Static experiments usually involve diamond anvil cells, which compress femtolitre-scale samples between hard diamond tips for indefinite periods of time. Diamond anvils are now approaching terapascal pressures but dynamic experiments can already achieve pressures as high as 50 TPa. These experiments crush larger, millimetre-sized samples by driving compression waves through them – although extreme pressures can only be maintained for a few nanoseconds.
With such a diversity of experimental techniques available, robust calibration standards are crucial in ensuring that independent experiments and theoretical studies can be reliably compared. In their study, Fratanduono and team used two facilities to carry out dynamic compression to 1 TPa on both gold and platinum samples. The National Ignition Facility at LLNI used lasers to create the extreme pressures, while the Z Pulsed Power Facility at Sandia National Laboratory created the pressures by harnessing the rapid release of a large amount of stored electrical energy.
Strong agreement
From measurements made using each technique, the researchers established the relationship between pressure and volume in both metals. Despite a roughly order of magnitude difference between the sample sizes and compression times in the two techniques, the pressure–volume relationships showed strong agreement with each other. In addition, the new measurements agreed with the results of previous static experiments involving diamond anvil cells. This was particularly impressive, since the differences in sample sizes and compression timescales between static and dynamic experiments spanned many orders of magnitude.
Overall, the experiments provide reliable new standards for the behaviour of gold and platinum at terapascal pressures. By referring to them, future researchers will be able to calibrate their findings far more easily. Fratanduono and colleagues now hope to do similar calibration measurements on many more materials.
Global leaders must take “urgent” action to halve emissions of greenhouse gases and reverse the loss of nature by 2030. That is according to a group of 126 Nobel laureates – including physics laureates Georg Bednorz, Steven Chu, Konstantin Novoselov and James Peebles – and others who have released a statement claiming that “time is running out to prevent irreversible changes” to the climate. The document was presented to António Guterres, United Nations General Secretary, and British Prime Minister Boris Johnson just days before a meeting of leaders belonging to some of the world’s richest countries, known as the G7, which is taking place this weekend in Cornwall, UK.
The statement – co-signed by laureates from all Nobel disciplines as well as other eminent scientists from around the world – highlights several issues that need attention such as planetary health, inequality and technology. “The long-term potential of humanity depends on our ability today to value our common future,” it notes. “Ultimately, this means valuing the resilience of societies and the resilience of Earth’s biosphere.”
The statement – titled Our Planet, Our Future – was inspired following discussions during the first Nobel Prize Summit – a meeting hosted in late April by the Nobel Prize Foundation and organized by the National Academy of Sciences with the Potsdam Institute for Climate Impact Research and the Stockholm Resilience Centre and Beijer Institute of Economics.
“Humanity is waking up late to the challenges and opportunities of active planetary stewardship. But we are waking up,” the statement declares. “Long-term, scientifically based decision-making is always at a disadvantage in the contest with the needs of the present. Politicians and scientists must work together to bridge the divide between expert evidence, short-term politics, and the survival of all life on this planet in the Anthropocene epoch.”
Johan Rockström, director of the Potsdam Institute notes that the move by the laureates is a “loud and clear call” to humanity. “With one voice they conclude we face unacceptable risks,” he says.