Physicists should be wary of data from gravitational-wave observatories that appear to contradict Einstein’s general theory of relativity. That is the message from researchers in the UK, who have analysed how errors accumulate when combining the results from multiple black-hole mergers. They say that current gravitational-wave catalogues contain nearly enough events to potentially generate errors large enough to be confused with signals for alternative theories of gravity.
The discovery of gravitational waves by the LIGO collaboration in the US in 2015 was one of the most important vindications of Einstein’s general theory of relativity. That theory, formulated a century earlier, predicts that massive, accelerating objects will generate wave-like distortions in space-time that radiate away from them. The waves are miniscule, but LIGO and other laser interferometers are now sensitive enough to pick up the distinctive waveforms from certain pairs of massive celestial objects. In the case of the first detection and most others since, the objects in question were two merging black holes.
Ironically, however, physicists also hope that gravitational waves might reveal flaws in general relativity. They strongly suspect that the theory does not provide a complete description of gravitational interactions, given its incompatibility with quantum mechanics. To this end, researchers make detailed comparisons between the waveforms of gravitational radiation picked up by interferometers and those predicted by general relativity – with any inconsistencies between the two signaling a possible hole in the theory.
As Christopher Moore and colleagues at the University of Birmingham point out, all detections to date have been consistent with general relativity. But the scrutiny will intensify as LIGO and its European counterpart – the Virgo detector in Italy – become more sensitive, and other observatories start up elsewhere. Indeed, it might become possible to identify features in the observed waveforms that discriminate between general relativity and alternative theories, such as ones motivated by quantum gravity.
Combining data
Doing so with individual events is limited by the strength of the signal in each case. But as the number of events increases – to date there have been about 50 binary systems observed – researchers are looking to combine the data from them and thereby perform more stringent tests.
In the latest work, Moore and colleagues sought to establish the possible extent of systematic errors when such multi-event analyses are carried out. Their results, they say, surprised them – finding that small model errors can accumulate faster than expected when combining events together in catalogues.
As the researchers explain in a paper published in the journal iScience, modelling the waveforms from specific celestial phenomena is a complex business. As such, they say, several simplifications have to be imposed to make the calculations manageable. These include the removal of higher-order mathematical terms and the need to ignore certain physical effects – such as those deriving from black holes’ spin and orbital eccentricity. Even then, they say, finite computing power limits the calculations’ accuracy.
Additional parameters
Using a simple method of data analysis that assumes the signal-to-noise ratio is very large, Moore and colleagues found that the extent of error accumulation depends on how individual gravitational-wave events are combined. In other words, how additional parameters are added to the equations of general relativity. On one hand, are parameters that would be common to all events, such as the mass of the hypothetical force particle known as the graviton. On the other hand, are parameters whose values can change from one event to the next – such as “hairs” on black holes.
In addition, say the researchers, error accumulation depends on how modelling errors are distributed across catalogue events and how they align with different deviations from relativity – whether they always tend to push the deviation in the same direction or whether they instead cause it to average out.
“Dangerously close”
Moore and colleagues conclude that even if a waveform model is good enough to analyse individual events, it may still create erroneous evidence for physics beyond general relativity “with arbitrarily high confidence” when applied to a large catalogue. In particular, they calculate that such a false signal could emerge from as few as between 10–30 events with a signal-to-noise ratio of at least 20. That, they write, “is dangerously close to the size of current catalogues”.
The researchers acknowledge that more work needs to be done to gauge the reliability of such multiple-event analyses. In particular, they say it will be necessary to test the statistical procedures involved with simulated as opposed to real data.
“Excellent starting point”
Other scientists welcome the new research. Nicolás Yunes of the University of Illinois Urbana-Champaign in the US says the problem of mistaking errors for new physics has been known about for some time but reckons the study represents “an excellent starting point to continue investigating this potential problem and determine how to overcome it”.
Katerina Chatziioannou of the California Institute of Technology in the US argues that although waveform models are “good enough” for existing gravitational-wave data it remains to be seen whether they are up to the job in the future. Nevertheless, she says, researchers are “actively working to improve the models”.
Indeed, Emanuele Berti of the Johns Hopkins University, also in the US, is optimistic that a “self-correcting process” will take place. “As we learn waveforms and astrophysical properties of the events,” he says, “we should be able to correct for the effects pointed out in the paper.”
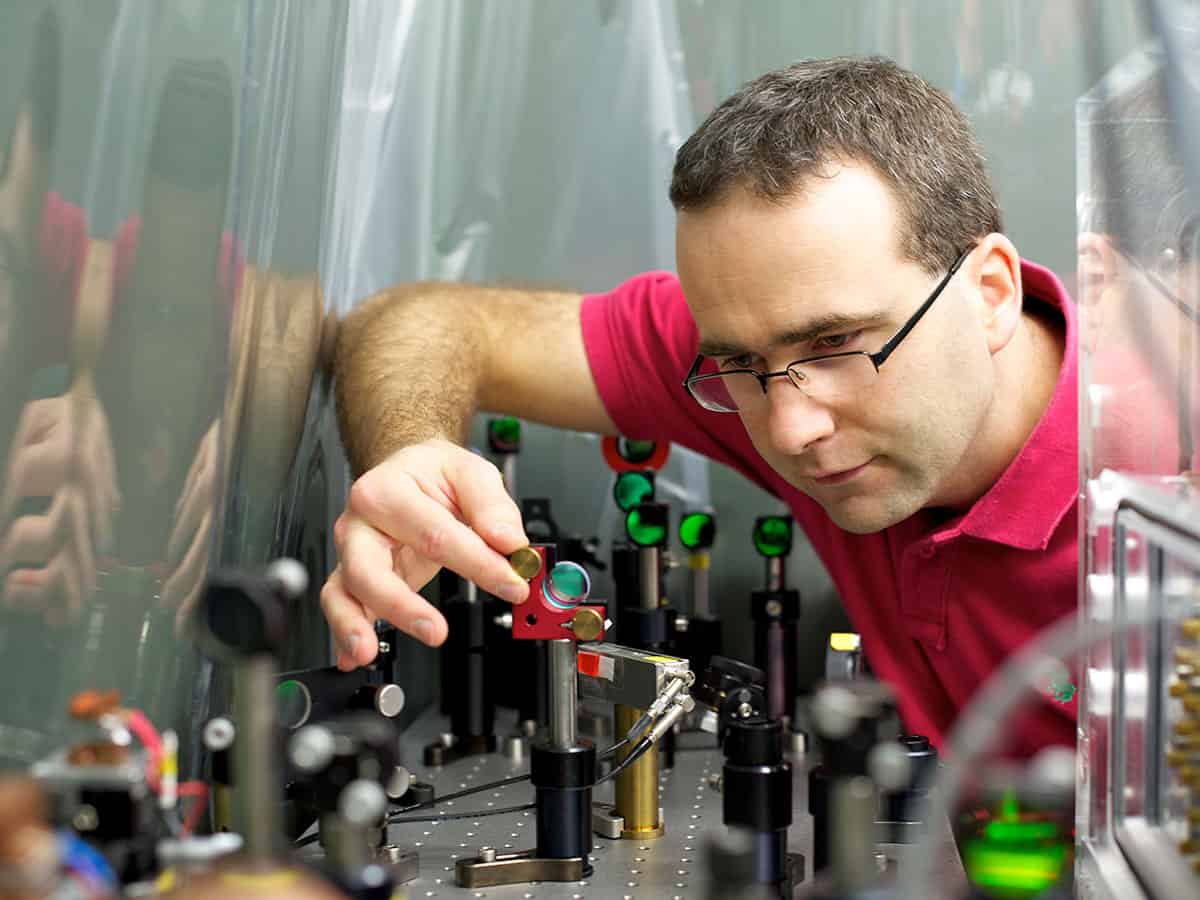
Randolf Pohl was not in a good mood, late one evening in July 2009. Sitting in a control room at the Paul Scherrer Institute (PSI) in Switzerland, he was cursing the data from a project he’d embarked on over a decade earlier. Known as the Charge Radius Experiment with Muonic Atoms (CREMA), it was designed to measure the radius of the proton more precisely than ever before. Technically very demanding, CREMA involved firing a laser beam at hydrogen atoms in which the electron had been replaced by its heavier cousin, the muon.
Pohl, who was then a postdoc at the Max Planck Institute of Quantum Optics in Garching, Germany, was trying to tweak the laser until its energy was just enough to excite these muonic hydrogen atoms from the 2S1/2 to the 2P1/2 levels. Quantum theory says that the energy difference between the levels, known as the Lamb shift, should depend ever so slightly on the size of the proton. The idea was to detect the X-rays emitted when the atoms were excited by the laser and decayed to a much lower energy level. The precise laser frequency at that point, combined with atomic theory, would then reveal the proton radius.
Unfortunately, having scanned what they thought was the entire frequency range corresponding to all possible radii, Pohl and his colleagues had come up empty-handed. There was no X-ray signal in sight. But then team member Aldo Antognini, who turned up for the night shift, had an inspired idea. He suggested looking at a range of frequencies seemingly ruled out by previous experiments, that CREMA had yet to explore. With potentially just a week of observation time left, the researchers quickly re-adjusted their equipment.
Eyes on the prize CREMA’s Aldo Antognini in the laser lab at the Paul Scherrer Institute. (Courtesy: PSI)
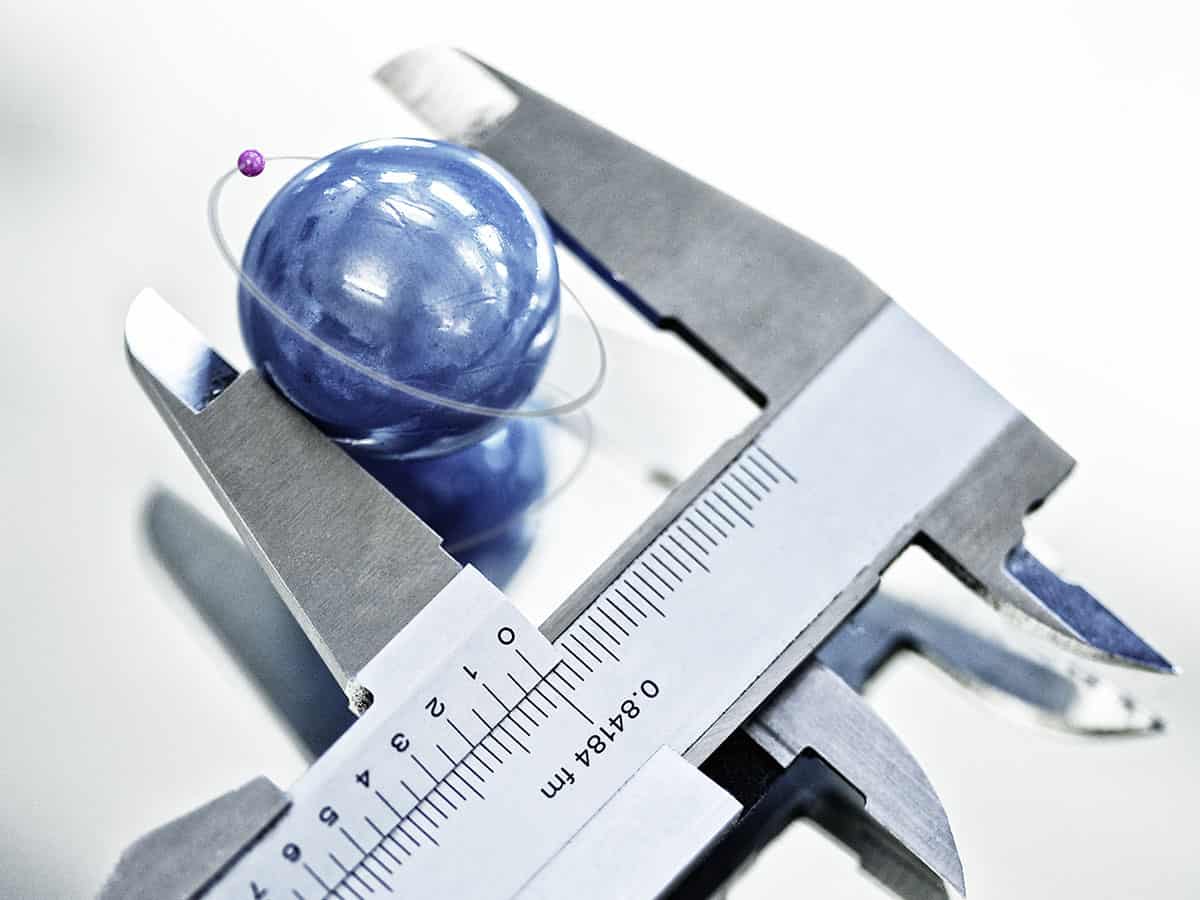
Amazingly, a signal emerged. Clearly visible above the background, it indicated that the proton’s radius is 0.84184 ± 0.00067 fm (where 1 fm = 10–15 m). That made it nearly 4% smaller than the then official value set in 2006 by the Committee on Data of the International Science Council (CODATA) and, given the tiny error bars, completely at odds with it.
Puzzling times
The strange discrepancy between CREMA and previous measurements became known as the “proton radius puzzle” because it involved what appeared to be two contrasting but very well founded sets of results. On the one hand was the CODATA value, calculated on the basis of data from around two dozen experiments using two techniques: electron scattering and hydrogen spectroscopy. On the other was the CREMA result – a single, very precise spectroscopy measurement for which no obvious flaws had been found, either before or after the result’s publication in 2010 (Nature466 213).
The disparity created great excitement among theorists, who speculated that it could be due to some previously unforeseen difference in the fundamental behaviour of electrons and muons. After all, the Standard Model of particle physics says that (apart from their masses) electrons and muons are completely alike. So if CREMA’s result was right, it raised the thrilling prospect that the Standard Model might need overhauling.
But excitement began to wane when theorists failed to find a new force that could explain the discrepancy. What’s more, by 2017 new results from the two kinds of traditional proton-radius experiments started to confirm the muon data. CREMA’s famous result now appeared not as a harbinger of revolution in physics but as a wake-up call that the earlier scattering and spectroscopy measurements had gone badly wrong. More remarkable than the discrepancy, however, was the way that new measurements from those traditional techniques seemed to fall in line – as if the field underwent a collective U-turn.
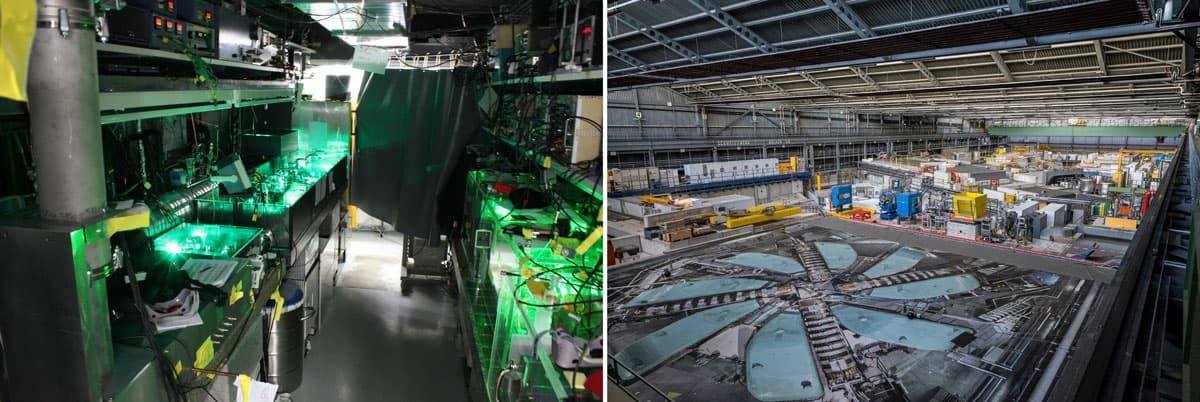
A question of size The CREMA experiment at the Paul Scherrer Institute in Switzerland, where researchers probing muonic hydrogen with lasers found an unusually small value for the proton radius. (Courtesy: CREMA collaboration/PSI; Paul Scherrer Institute/Markus Fischer)
Wim Ubachs of Vrije Universiteit in Amsterdam, who is not part of CREMA, admits to being baffled by this “peculiar matter”, as he puts it, but stresses he has the “highest esteem for the people involved in the field and would not want to point to any wrongdoing or manipulating of data”. Pohl himself says that systematic errors in the earlier work must be to blame, though he is unable to identify the culprits. “It’s very strange that so many experiments could be wrong in the same way,” he says.
Others, however, think the mystery may not be all it’s cracked up to be. Some nuclear physicists even dispute the idea that researchers had no inkling of a smaller radius until CREMA came along. Among those is Ulf Meißner at the University of Bonn in Germany, who says he had first started arguing for a lower value for the proton radius in the mid-1990s. “There was a clear discrepancy,” he recalls. “But for whatever reason CODATA was always sitting on the high value.”
Indeed, the saga raises questions about how the values of the fundamental constants ought to be decided and what role CODATA should play. For Meißner, the decision-making is not transparent and depends too much on certain individuals’ tastes. “It is more psychology than physics,” he claims.
Narrowing the gap
CODATA was set up by the International Council for Science in 1966 to organize and preserve the increasing volumes of data produced by scientists around the world. It entrusts the delicate task of setting the values of nature’s most basic parameters, such as the Planck constant, electron mass or gravitational constant, to the Task Group on Fundamental Constants. Consisting of 15 or so scientists from around the world, the group usually adjusts those values every four years using the least-squares method to fit them as closely as possible to available experimental and theoretical results.
For most constants, this process is not ambiguous as different results agree among themselves within the limits of their error bars. That much seemed true when the task group first published an official value of the proton radius – or, more specifically, the average radius of the proton’s electric charge – in 2002. At that time, the radius was derived from the two more conventional types of experiment. Electron scattering measures the extent to which high-energy electrons are deflected by hydrogen nuclei (protons). Ordinary spectroscopy, meanwhile, compares the measured frequencies of one or more electronic transitions in hydrogen with the values predicted by quantum electrodynamics (QED) to obtain a value for the Lamb shift and with it the proton radius. The figure CODATA settled on in 2002 was 0.8750 ± 0.0068 fm, which changed only slightly four years later, remaining a little under 0.88 fm.
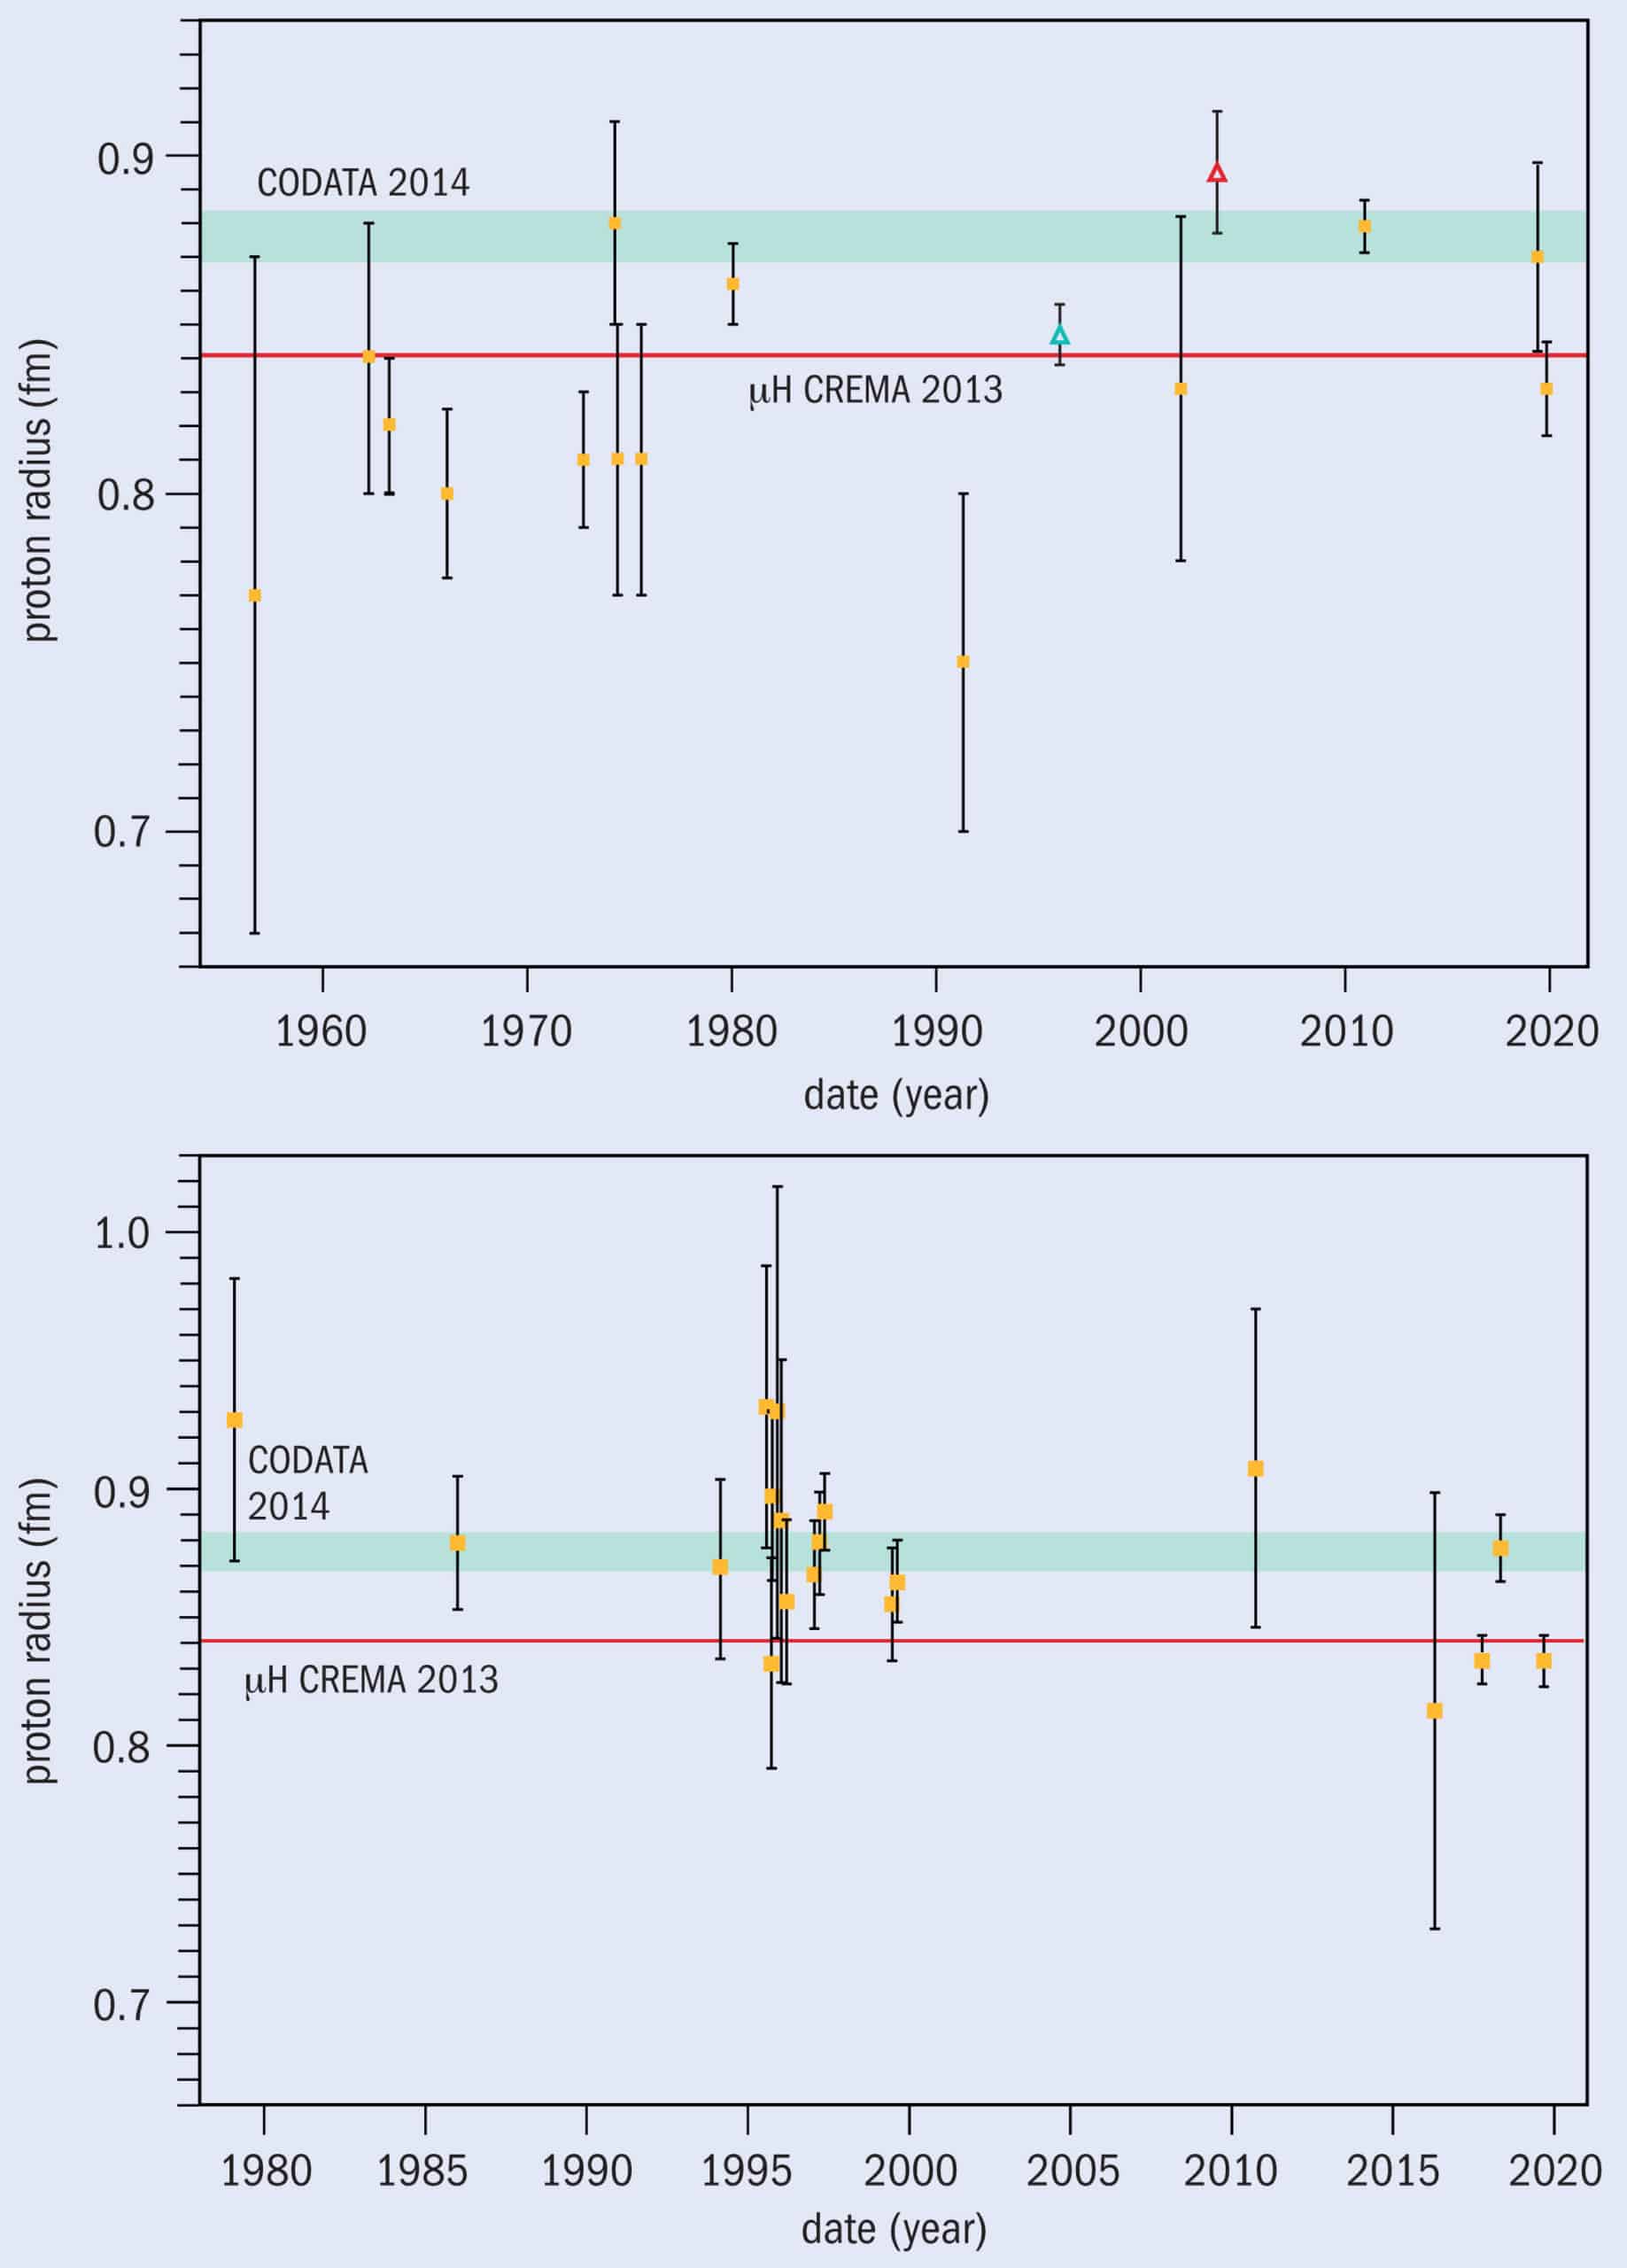
1 The changing values for the proton radius A chronological overview of values for the proton radius, as determined from electron scattering (a) and hydrogen spectroscopy (b). In both cases, the green band shows the official 2014 recommended value from CODATA, while the red line shows the (very precise) value obtained from muonic hydrogen. All scattering data are experimental, except for the two unfilled triangles giving theoretical global fits from Meißner and colleagues (in 1996) and Sick (in 2003). (Figure adapted from Nature Reviews Physics2 601; Reprinted by permission from Springer Nature)
But in 2010 along came CREMA with its muonic hydrogen spectroscopy measurements. The advantage of using muons is that they are about 200 times heavier than electrons and so get closer to the proton than their lighter counterparts, making the Lamb shift more pronounced. The resulting value of around 0.84 fm was far more precise than the official number, but the CODATA task group decided to stay put. It omitted the muon data from its 2010 adjustment, partly because new, improved scattering data from the MAMI accelerator at the University of Mainz in Germany agreed with the bigger radius. And four years later the group did the same thing when its members met up in Paris. Even though a number of invited speakers had argued it was getting ever harder to identify any experimental or theoretical loopholes that could explain away the CREMA results, the group voted – by a count of eight to two – to again exclude the muon data.
It was only in 2018 that the panel changed its approach. By then, several experimental teams had either published or communicated new data from conventional hydrogen spectroscopy agreeing with CREMA – including one at the Max Planck Institute (comprising Pohl) and another at York University in Toronto, Canada. With CREMA itself having published an even more precise value of the proton radius, the task group finally incorporated the muon data. The value that emerged from its best fit that year was very similar to the muonic one alone, but with bigger error bars: 0.8414 ± 0.0019 fm.
Decisions, decisions
In deciding what to do with conflicting data, the CODATA task group aims to be neutral. Peter Mohr, a physicist from the US National Institute of Standards and Technology who chaired the group from 1999 to 2007 and is still a member, explains that it incorporates all “individually credible” results and then takes an average. “[It] does not decide whether particular data are right or wrong,” he says. “This would require superhuman powers.”
However, the panel’s handling of the proton radius raises questions. Mohr says it “made less sense to average” the large and small radii in 2014 than it did four years later, given the absence of independent confirmation at that time. But why it changed tack in 2018 is not clear. According to the minutes of that year’s meeting, again held in Paris, the panel considered recent results from conventional spectroscopy to be “inconclusive” given that, alongside the support for a smaller radius, researchers at the Kastler Brossel Laboratory in Paris again obtained the higher value when measuring hydrogen’s 1S–3S transition.
Mohr defends the group’s decision-making process, maintaining that the situation with the proton radius was “not all cut and dried”. He and his colleagues decided ultimately to change the value, he explains, given a “preponderance of evidence” in favour of the smaller number. But he admits that the statement about the hydrogen spectroscopy results in the 2018 minutes was “poorly worded”.
Others, however, offer a different interpretation. Despite being “close to 100% convinced” in 2014 that the small radius was correct, Pohl, who gave a talk at the meeting that year, says he nonetheless supported retaining the high value. That approach, he felt, would keep the spotlight on the proton-radius puzzle and motivate further work to try and resolve it. Indeed, Simon Thomas from the Kastler–Brossel Laboratory in Paris also thinks that CODATA wanted to keep the question alive rather than obtain the most precise possible value of the radius.
As he notes, the CREMA result was not really at odds with individual spectroscopy experiments – all but one differed by no more than 1.5 standard deviations, or σ. The only significant disparity – of at least 5 σ – arose when the conventional data were averaged and the error bars shrunk. But that disparity could only be maintained if the muon result itself was kept out of the fitting process – given how much it would otherwise shift the CODATA average towards itself.
Thomas sees nothing wrong with the task group drawing attention to the puzzle rather than simply opting for the most precise values of the constants. (Indeed, Pohl reckons “no-one cares” about the exact value of the proton radius apart from spectroscopists.) He also regards the consequent boost in research funding as a necessary and healthy part of the scientific process. “It is only when both scientific and strategic motivations coincide that they [scientists] take a stance on a result,” Thomas says
A black box
It’s debatable whether the task group has always been so enthusiastic about bringing inconsistencies to light. Indeed, some nuclear physicists reckon it did just the opposite before the muon data emerged – having ignored scattering data pointing to a smaller radius (see box below). The result, they say, was a high value of the radius that appeared more solid than it really was.
The task group’s approach did not change even after CREMA published its initial muon data. In 2014 it called on “two pairs of knowledgeable researchers” to extract a value from the scattering data. These were Ingo Sick from the University of Basel in Switzerland teaming up with John Arrington of the Argonne National Laboratory in Illinois, and Michael Distler and Jan Bernauer from the University of Mainz, Germany. With both pairs calculating a high value, the scattering radius continued to be large – about 0.88 fm.
But, as before, others had arrived at a different conclusion. Douglas Higinbotham of the Thomas Jefferson National Accelerator Facility in Virginia and colleagues showed they could use linear and other simple extrapolation of low-momentum data to work out the radius, rather than the higher-order polynomials favoured by Sick and others. Their work yielded a value consistent with CREMA – indeed, they argued that “the outliers” were not the muon or scattering results but those from ordinary (rather than muonic) hydrogen.
The task group mentioned this study and two others favouring the smaller radius in its 2014 report, but dismissed them on the basis of a critical analysis by Bernauer and Distler. That pair identified what it claimed were “common pitfalls and misconceptions” in the other groups’ statistical analyses, arguing in the case of Higinbotham and co-workers that they had misunderstood tests used to justify lower-order extrapolations.
Higinbotham sees things differently. He maintains that the use of extrapolations based on higher-order polynomials “makes no mathematical sense”, adding that nuclear theorists have in fact been using dispersion relations to obtain a low value of the radius since the 1970s. But he complains that no-one from the small-radius camp was interviewed by CODATA in 2014. “It can be tough when you feel you are not getting the opportunity to discuss your point of view,” he says.
Meißner compares the task group’s approach unfavourably with that adopted in particle physics, where the international Particle Data Group, he says, lists all competing values of constants and lets users make up their own minds. CODATA’s decision-making process is, he argues, more “like a black box”, with the panel including or excluding data on the basis of “personal decision” rather than objective criteria. Indeed, Mohr has “to confess to not remembering” why the group relied so heavily on Sick’s analysis (with no explanation appearing in its various reports).
As to the use of Bernauer and Distler’s critical analysis in 2014, he says the task group was presumably “persuaded by their arguments”. But why no explanation of that choice? “That becomes a political question I guess,” he replies. “Evidently we trusted those people but to go into details about why we trusted them I can’t give concrete arguments.”
Scattered doubts
(Courtesy: PSI)
As a technique for determining the proton radius, electron scattering predates spectroscopy by several decades. First carried out in the 1950s, it initially gave atomic physicists a value for the radius so they could test QED by comparing theory with measured transition frequencies. Unfortunately, scattering is tricky to carry out and interpret. Experimentalists have to measure the number of deflected electrons as a function of the scattering angle, but the most accurate value for the proton radius comes when there is no deflection (i.e. when electrons transfer zero momentum to the protons). To obtain this physically impossible data point, physicists plot a mathematical function known as the “electric form factor” and extrapolate it back to zero momentum transfer. But that’s a contentious process, yielding a range of values for the radius even from a single experiment.
Back in its 1998 adjustment, CODATA’s Task Group on Fundamental Constants considered two scattering-derived radii. One (0.862 fm) came from low-momentum data at the University of Mainz’s MAMI accelerator in 1980, while the other (0.847 fm) was published in 1995 by Ulf Meißner and two theorists at Mainz using “dispersion relations” to analyse all existing scattering data. Giving equal weight to both numbers, the group ended up with a simple unweighted mean of 0.855 fm for the proton radius. But as this figure conflicted with the value from spectroscopy, CODATA based the radius that year solely on the results from atomic physics – and as a result didn’t formally list the proton radius among its fundamental constants.
In 2002 the task group instead turned to Ingo Sick of the University of Basel, described by Mainz group member Michael Distler as “the pope of scattering”. His global scattering analysis yielded a much higher value – 0.895 fm – which was no longer in conflict with spectroscopic data. The panel that year therefore published the combined radius, and went on to do so in both 2006 and 2010 – again relying on Sick’s number, citing both his original study and several follow-up papers. But in none of those three adjustments did the task group reference Meißner’s work. Meißner, who says he has never been told why his work was excluded, maintains that the group in effect took sides by abandoning its usual practice of averaging different results. “In this they certainly have not been neutral whatsoever,” he says. “If they are neutral they should quote whatever is around and not select.”
End game
Whether a different treatment of the scattering data could have ushered in a smaller proton radius before CREMA found its signal, or at least raised the uncertainty of the large value, is a moot point. Distler argues that the data simply weren’t precise enough to clearly distinguish between two different sizes, while Meißner thinks the discrepancy would have been less pronounced come 2010 but cautions that his view is “pure speculation”.
The task group itself noted in its 2010 report that, with the scattering data removed, the discrepancy between conventional and muonic results dropped from a whopping 7 σ to just 4.4 σ. Under those circumstances, Thomas reckons that the disparity would still have raised the same questions about a possible crack in the Standard Model, but would have generated much less media coverage. “I think there would still have been a puzzle, only a little less famous,” he says.
Scientists naturally continue searching for systematic errors when a result disagrees with what they expect but otherwise might not try quite so hard
As to what caused the presumed but still unidentified errors in conventional spectroscopy, Thomas suggests that scientists naturally continue searching for systematic errors when a result disagrees with what they expect, but otherwise might not try quite so hard. Or, in the words of Jean-Philippe Karr, a fellow atomic physicist at the Kastler–Brossel lab, “People are serious and continue looking, but maybe they are a bit less motivated when they are at the right value, so to speak.”
To try to work out what might have pushed up the result from their 1S–3S measurement, Thomas and colleagues are studying the same transition in deuterium, which could reveal any missed systematic errors due to atoms’ finite velocities. Similar work is also being carried out by the group at the Max Planck Institute, which last year reported very precise measurements of the transition in hydrogen using a frequency comb – again obtaining the small proton radius.
Nuclear physicists too are busy. Researchers at the Jefferson lab are currently preparing an upgrade to the Proton Radius Experiment, having in 2019 reported a small radius in 3 σ disagreement with results from other scattering efforts. The MUSE experiment at the PSI, meanwhile, is preparing to scatter both electrons and muons off protons to establish whether the two types of lepton might behave differently after all.
In fact, there are some who continue to argue for a large proton radius. Distler, whose colleagues at Mainz are also planning fresh experiments with lower systematic errors, insists that the group’s existing results are valid. He maintains that the mismatch with the muonic data might only be apparent, and that it could be due to incomplete hydrogen energy-level corrections from QED – stemming perhaps from the production of multiple particle–antiparticle pairs. “It would mean we have two values of the radius and both would be right,” he says.
Meißner, in contrast, has no doubt that the small radius is correct. He says he doesn’t want to take anything away from the CREMA researchers, describing their experiment as “really high accuracy and great stuff”. But he resents what he regards as the lack of credit given for his work beforehand, while admitting that he can’t discuss the proton radius anymore with his counterparts at Mainz. “They can take the large value of the radius to the grave,” he says. “I don’t care.”
This edition of the Red Folder focuses on spinning objects flying through the air – and first up is the baseball.
Just like in particle physics, spin plays a crucial role in how a baseball is pitched. If the ball has little or no spin when it is released by the pitcher, its flight to the batter will be erratic. Called a knuckleball, this type of pitch can be very difficult for a batter to hit. If the ball has lots of spin, it will travel in a smoother trajectory, but the interaction between the air and the stitched seams of the ball will cause its motion to curve. These curveballs can also be difficult to hit.
Now, a kerfuffle has broken out in Major League Baseball about pitchers using sticky substances on their hands to increase the spin of the ball. According to the sports physicist John Eric Goff of the University of Lynchburg in the US, major league pitchers appear to have used this trick to increase the spins of their pitches by about 400 rpm. This is a significant boost of about 17% to a typical curveball that spins at about 2400 rpm.
Goff calculates that this can result in an extra displacement of about 5 cm when the ball reaches the batter – which also happens to be the thickness of a baseball bat. As a result, experienced batters are misjudging curveballs. This, Goff speculates, could be the reason why major league batters are striking out 25% of the time today, compared to just 17% of the time in 2005.
If you’d rather watch baseball than play it, you could find yourself sitting in a pub full of beer mats – those cardboard coasters that often stick to the bottom of your glass. During a lull in the game, you might even be tempted to flick your beer mat across the room. But unlike a Frisbee flying disc, beer mats will flip over as they spin through the air – and now three physicists at the University of Bonn in Germany have worked out why.
Using a combination of computer simulations and experiments, Johann Ostmeyer, Christoph Schürmann and Carsten Urbach found that a lifting force acts on the forward edge of a spinning disc, causing it to flip over. Frisbees don’t suffer from this instability because of their thick edges.
A new on-chip device that is very good at mediating interactions between light and atoms in a vapour has been developed by researchers in Germany and the UK. Flavie Davidson-Marquis at Humboldt University of Berlin and colleagues call their device a “quantum-optically integrated light cage” and say that it could be used for wide range of applications in quantum information technology.
Hybrid quantum photonics is a rapidly growing area of research that integrates different optical systems within miniaturized devices. One area of interest is the creation of devices for the control, storage and retrieval of the quantum states of light using individual atoms. This is usually done by integrating on-chip photonic devices with miniaturized cells containing warm vapours of alkali atoms. However, this approach faces challenges due to inefficient vapour filling times, high losses of quantum information near cell surfaces and limited overlaps between the wavelengths of light used in optical circuits and the wavelengths of atomic transitions.
Arrays of dielectric cylinders
Now, Davidson-Marquis and colleagues have addressed these issues by creating an on-chip light cage that is integrated onto an alkali vapour cell. Fabricated extremely precisely using a 3D laser nanoprinter, the pipe-like cage has a diameter of about 24 micron and is made from arrays of dielectric cylinders, arranged in a hexagonal pattern around a hollow core.
Unlike the fibres and planar waveguides used previously, this compact, easy-to-handle light-guiding structure can be accessed laterally – allowing alkali atoms to diffuse into and fill the core in minutes. Furthermore, by coating the cage with an alumina nanofilm, the researchers could precisely tune the wavelength of the transmitted light to that of the alkali atom transition. The coating also prevents the corrosive alkali vapour from damaging the polymer cage cylinders.
Transparent window
In experiments involving vapours of caesium atoms, the team observed the emergence of electromagnetically induced transparency (EIT) within their light cage. This is a useful quantum-optical effect that occurs when specific atomic transitions induced by a light beam create a window where light with a narrow range of wavelengths can propagate freely through an otherwise opaque vapour. EIT can also be used to “store” light signals within an atomic vapour.
The team envisages clear routes towards further improvements to their on-chip device. Owing to its long-term stability, ease of integration, and versatile production through 3D laser nanoprinting, the device could be interfaced with other silicon-chip-compatible devices such as waveguides for light modulation and frequency conversion. It can also be coupled to optical fibres.
In the future it should be possible to use EIT to create a broad range of transparent windows. This could be useful for creating highly compact storage devices for quantum information or systems that control the arrival times of photons in quantum networks. Potential applications of devices with these capabilities include optical switches, quantum memories and quantum repeaters.
One of the oldest medical procedures, palpation, consists of feeling body parts in search of abnormalities that could help diagnosis. For example, a stiffer area on the skin might indicate a tumour mass. But the nature of this physical examination limits information to the most superficial tissues and large abnormalities. What happens if tumours are located deeper inside the body or are too small to be detected manually?
A group of researchers from the Optics and Photonics Research Group at the University of Nottingham may have come up with a solution. In a proof-of-concept study published in Light: Science & Applications, they showed how an ultrasonic probe deployed on the tip of a standard optical fibre can simultaneously determine 3D spatial information and mechanical properties of microscopic structures, generating images with nanoscale depth resolution.
This “phonon probe” could represent the highest resolution ultrasonic 3D fibre imaging device in the world and could pave the way towards minimally invasive point-of-care diagnostics. “We believe its ability to measure the stiffness of a specimen, its bio-compatibility and its endoscopic potential, all while accessing the nanoscale, are what sets it apart,” says Salvatore La Cavera, first author of the study.
Brillouin scattering
Practically, the phonon probe works by pulsing coherent acoustic phonons – synchronized sound particles – into the specimen and detecting the sample’s vibrational response to infer its viscoelasticity.
The probe incorporates two lasers that emit short pulses. One of the laser pulses is absorbed by a gold nanotransducer fabricated onto the tip of the fibre, generating high-frequency phonons that are pumped into the specimen. Then, when a second laser pulse is incident on the specimen, the photons collide with the phonons and undergo a process called Brillouin scattering.
Based on the geometry of this collision, the phonon will either give or receive energy from the photon, resulting in a frequency shift in the light (Brillouin frequency shift). Measuring this shift provides a measure of the sound velocity through the medium. Combining this velocity with the rate at which the specimen dissipates acoustic energy – measured by tracking the decay of the phonon amplitude over time – quantifies the sample’s viscoelasticity.
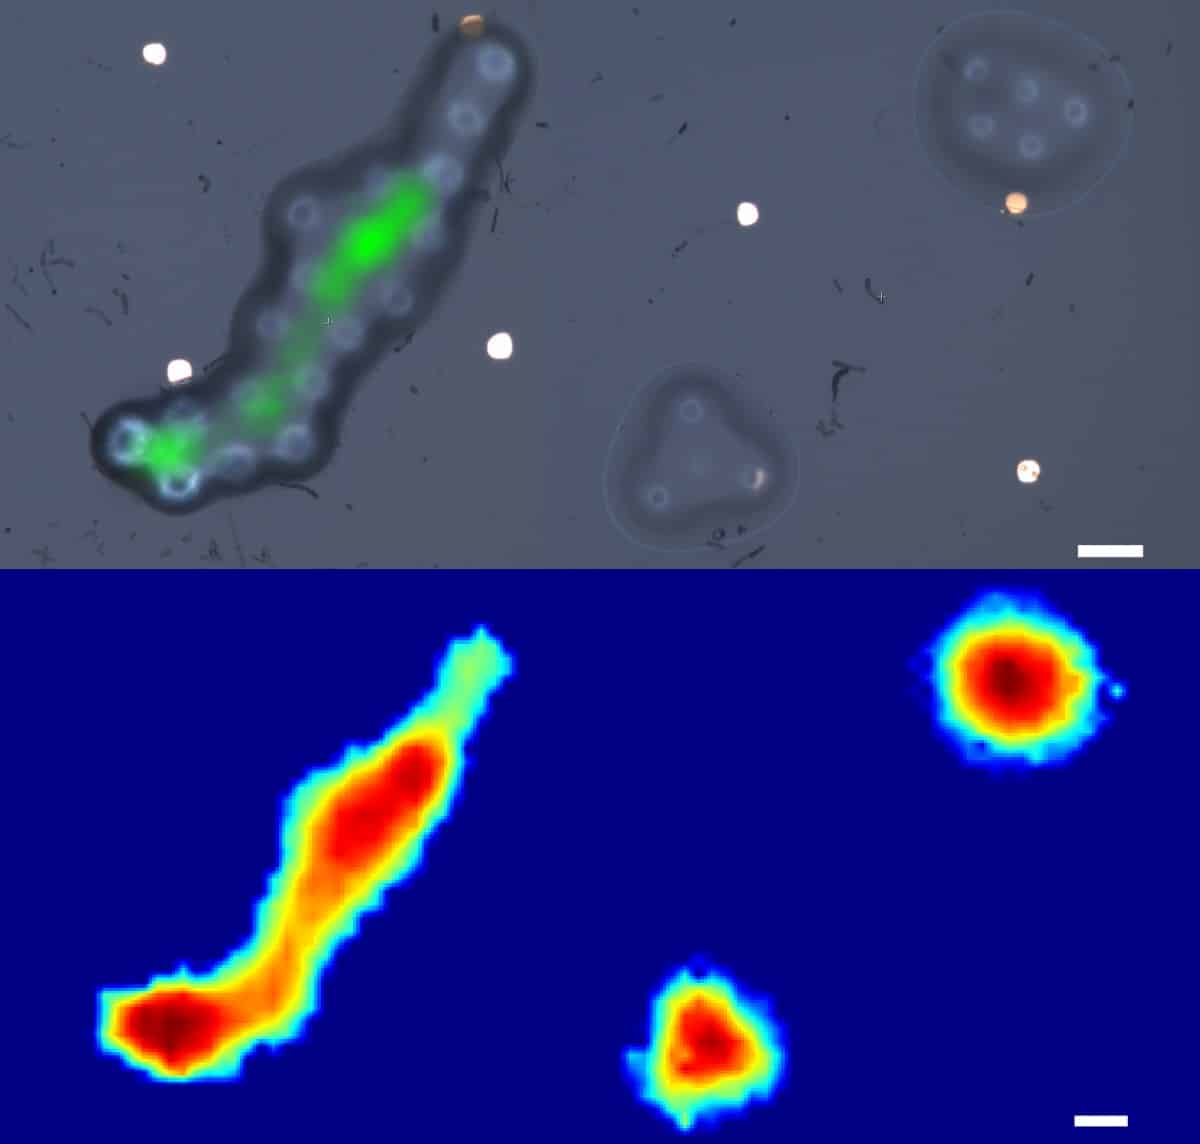
To demonstrate the probe’s ability to perform parallel 3D topographical mapping and spatially resolved elastography, the team assembled 10-µm-diameter microspheres into complex microstructures and partially melted them to create height irregularities. They used the fibre probe to scan a 100 x 100 µm area centred on the microstructures, in steps of 2 µm.
The probe demonstrated 2.5-µm lateral resolution and could measure height with 45-nm precision, over an order of magnitude smaller than the probe’s optical wavelength.
Using Brillouin scattering, the probe maps the stiffness (top; green areas are regions of homogeneous stiffness) and topology (bottom; blue indicates low areas, red indicates high areas) of polystyrene microstructures. Scale bar: 10 µm. (Credit: Salvatore La Cavera)
The whole scanning process took 2.8 hr, but the researchers note that in practice, this could be made much faster through sensor optimization. Indeed, probes can be deployed at the tip of each of the 20,000 fibres that make up an imaging bundle, such as in an endoscope, and immediately provide an image of the region-of-interest.
From microscopy to metrology
This is not the first use of Brillouin scattering to assess biomechanical properties of tissues. Brillouin microscopy is already used to characterize tissues in several fields, including cancer biology, tissue regeneration and 3D mapping of corneal biomechanics, where its non-contact and label-free nature make it a method of choice. But the apparatus required is cumbersome, immobile and unsuited to clinical settings, limiting assessments to ex vivo samples.
The phonon probe would provide an immediate inspection tool to help clinicians examine cells within hard-to-reach parts of the body, such as the gastrointestinal tract, and offering more effective diagnoses for diseases ranging from gastric cancer to bacterial meningitis. The team is now looking to develop a series of biological cell and tissue imaging applications to create a viable clinical tool in the coming year.
Looking further afield, the potential of such technology is not limited to healthcare. Fields such as precision manufacturing and metrology could also use this high-resolution tool for surface inspections and material characterization: either as a complementary or replacement measurement for existing scientific instruments.
In just a few short years, quantum science and technology has gone from the lab to the boardroom with companies ranging from tech giants to tiny start-ups seeking to commercialize quantum devices and algorithms.
In this special Quantum Week edition of the Physics World Weekly podcast, we look at the challenges facing young companies and also hear from a firm that has been in the quantum business for over two decades.
First up are Jay Schrankler and David Awschalom who explain how the Duality start-up accelerator is nurturing new quantum science and technology businesses in the Chicago area.
Then we speak to Alan Baratz, who is president and CEO of Canada’s D-Wave Systems. He explains why his company is now focussing on providing its customers with cloud services on its quantum processors.
If you enjoy this episode, make sure to also join us for the inaugural Physics World Quantum Week. Running on 14–18 June 2021, the event showcases the latest developments in quantum science and technology. It includes a series of free-to-view webinars and a curated selection of quantum articles.
“That may be one of the reasons why people in the medical physics world are interested in getting a conformal brachytherapy treatment for the eye.”
David Medich, an associate professor of physics at Worcester Polytechnic Institute, was explaining why internal radiation, or brachytherapy, may be preferable for treating ocular melanomas over external-beam radiation therapy: using brachytherapy to deliver radiation to an ocular tumour also protects healthy tissues and critical structures, like the optic nerve and retina, from radiation-induced damage.
Work recently reported in Physics in Medicine & Biology introduces a new device for intensity-modulated high-dose-rate brachytherapy. The device, designed by John Monro III, managing director of Montrose Technology Inc, and simulated by Medich’s research group, delivers a more conformal treatment to ocular tumours than conventional brachytherapy approaches. The device would also shorten treatment from one to two weeks to less than 10 minutes.
The authors (left to right): Justine Dupere and David Medich from Worcester Polytechnic Institute, John Munro III from Montrose Technology Inc.
Brachytherapy and ocular melanomas
Ocular melanoma, though rare relative to all other cancers, is the most common type of eye cancer in adults. Plaque brachytherapy treatments deliver radiation to eye tumours via radioactive sources called pellets or seeds, which are placed in a device called a plaque that is sewn onto the surface of the eye.
Plaque brachytherapy treatments can be low-dose-rate (LDR) or high-dose-rate (HDR). LDR brachytherapy plaques are sewn on the eye for days at a time and may require patient hospitalization. HDR plaque brachytherapy treatments, on the other hand, can be performed as outpatient procedures because radioactive pellets are only in the body for tens of minutes at a time.
Whether a brachytherapy treatment is HDR or LDR, most brachytherapy plaques do not modulate the intensity of radiation incident on a tumour, and there is little to no collimation. In other words, most plaques cannot be adjusted to precisely conform the delivery of radiation to the tumour, so some critical structures and healthy tissues will be irradiated.
New plaque to treat ocular melanomas
The new ocular plaque is thin and ring-shaped. It’s made from gold, which is biocompatible and doesn’t react with the body’s tissues. The proposed plaque houses a series of ytterbium-169 pellets coated with stainless steel. Ytterbium-169 is a middle-energy source that emits photons with average energies of around 93 keV.
The properties of ytterbium-169 and gold have two consequences. First, the gold plaque can be used to attenuate photons emitted by the ytterbium-169 pellets and shield healthy tissues and critical structures. Second, a clinician can sew an empty plaque onto a patient’s eye and then feed the ytterbium-169 pellets into the plaque remotely, eliminating any radiation dose that might otherwise be delivered to the clinician.
In addition, the new plaque, unlike most others used in ocular brachytherapy, can be adjusted to optimize how and where radiation is delivered to the eye – a clinician can select plaques that deliver radiation to tumours at different diameters and angles.
Simulation results
The researchers modelled the new HDR plaque and ytterbium-169 pellets in two computer code systems (MCNP and BrachyDose) and validated the plaque’s performance against a commonly used LDR brachytherapy plaque and radiation source. They performed simulations for multiple tumour sizes and depths.
The new plaque reduced the dose absorbed by critical structures in the eye by up to 14%. Combined with its other advantages – shortened treatment time and reduced dose to a clinician – the researchers believe that this new plaque can feasibly treat ocular melanomas.
The researchers’ next steps are to collect experimental data to validate the performance of the plaque in the lab and to experimentally determine a prescribed treatment radiation exposure that will produce a biologically equivalent tumour response relative to conventional treatment times.
Great Dimming: Betelgeuse as observed in 2019–20 (Courtesy: ESO/M Montargès et al.)
The dramatic dimming of the red supergiant star Betelgeuse in 2019–20 was caused by a cold spot on the surface of the star causing a nearby gas cloud to cool and condense into obscuring dust, according to new findings.
Betelgeuse, on the shoulder of Orion, usually shines as the tenth brightest star in the sky. As a semi-regular variable star, it does fluctuate slightly as it pulsates but beginning in October 2019, Betelgeuse was seen to sharply dip in brightness, from magnitude +0.5 to an unprecedented magnitude +1.64 – three times fainter – by February 2020.
This “Great Dimming” event captivated both amateur and professional astronomers, resulting in some wild speculation that Betelgeuse was about to explode in a supernova. On the contrary, it has since returned to its regular brightness.
Images taken during the dimming by the SPHERE instrument on the Very Large Telescope in Chile were able to resolve Betelgeuse, which is about 548 light years away, as a disc. They showed that the dimming was confined to a region of Betelgeuse’s southern hemisphere. This region was ten times fainter than the rest of the star.
Two explanations
When the dimming was first observed, two main explanations emerged. One was that an orbiting dust cloud was obscuring the star and the other was that an anomalous cold patch had formed on Betelgeuse’s surface. The dust cloud explanation had been most favoured, however, the dust could not be orbiting the star, because that would cause a periodic dimming, which was not seen by SPHERE
Now an international team of astronomers, led by Miguel Montargès of the Observatoire de Paris in France and the Institute of Astronomy at KU Leuven in Belgium, argue that both explanations are correct, and connected.
“We think the rapid condensation of dust due to a cool spot caused [Betelgeuse’s] brightness to drop off so steeply,” Montargès tells Physics World.
Large convective cell
Their conclusion builds on work done in 2020, when a team led by Graham Harper of the University of Colorado, Boulder used photometry to observe light emitted by molecules of titanium oxide in the atmosphere of Betelgeuse. They found that whatever instigated the dimming did indeed manifest as a cold patch in the star’s atmosphere. Cool stars like Betelgeuse are highly convective, with convection cells the size of giant planets bubbling up to the surface and sinking again. The cool spot therefore could have been produced by an unusually large convective cell.
Also in 2020, research by Emily Levesque of the University of Washington, Seattle, and Philip Massey of Lowell Observatory in Arizona, showed that Betelgeuse’s overall temperature did not drop below 3600 K, which is too high to translate into the observed dimming. Therefore, the cool spot alone could not have resulted in a significant enough decrease in overall temperature to affect Betelgeuse’s luminosity so dramatically.
Now, Montargès’s team has linked the cool spot with the formation of dust — and connected both with the star’s cycle of variability. Previous work by a team led by Meridith Joyce, formerly of the Australian National University and now at the Space Telescope Science Institute in the US measured Betelgeuse’s primary period of variability as being 416 days (± 24 days) and confirmed that the variability is the result of the star’s natural pulsations. The onset of the dimming came 424 days after the previous minimum in the star’s brightness cycle, coinciding with the next expected minimum and implying a connection between the dimming and the 416-day-long pulsation period.
Clumps of gas
Montargès and colleagues suggest that the cool spot, brought about by the pulsations, reduced the amount of radiation incident on a gas cloud that had been emitted by the star, but which was not in orbit around it. The origin of this gas cloud is uncertain, but observations of Betelgeuse with SPHERE in March 2015 showed asymmetries in its disc, which could be clumps of gas being ejected by the star.
“Our best guess is that [the gas cloud] was ejected by a more powerful than usual convective cell on the star,” says Montargès. Aligned with the cooler spot along our line of sight, the cloud would have dropped in temperature and condensed into dust particles that obscured the star, causing even more dimming.
Joyce agrees that a link between the period of variability, the cold spot and dust formation is probable, and that the gas cloud must have been ejected recently, rather than being in orbit around Betelgeuse. “To my knowledge, this is the first such event that has been observed and monitored so extensively, and now explained,” Joyce says.
Betelgeuse’s prominence in the night sky means that it is observed more often than any other red supergiant, but Joyce says, “I’m sure there will be great interest in other, similar red supergiants in the future”.
Montargès echoes this, pointing out that currently only a handful of red supergiant stars out of thousands that exist in our galaxy are routinely monitored. However, “The Vera Rubin Observatory will change this,” says Montargès of the 8.4-metre survey telescope in Chile that will begin scientific operations in 2022–23.
New atomic-scale computer simulations of how quantum dots “talk” to each other could lead to a wide range of practical applications ranging from quantum computing to green energy.
The research was done by Pascal Krause and Annika Bande at the Helmholtz Centre for Materials and Energy in Germany and Jean Christophe Tremblay at CNRS and the University of Lorraine in France, who modelled the absorption, exchange, and storage of energy within pairs of quantum dots. With further improvements to the model, the use of quantum dots could be expanded to include a diverse array of real-world applications.
Quantum dots are tiny pieces of semiconductor crystal contain thousands of atoms. The dots are quantum systems that behave much like atoms, having electron energy levels that can absorb and emit light at discrete wavelengths. For example, when illuminated with ultraviolet light a quantum dot can be excited to a higher energy state. When it drops back down to its ground state, it can emit a visible photon – allowing quantum dots to produce glow with vivid colours.
More complex behaviours can occur when two or more quantum dots are close enough together to interact with each other. For example, interactions can stabilize excitons, which are quasiparticles that comprise an electron and a hole and are created when electrons are excited. Long-lasting excitons can have applications ranging from photocatalysis to quantum computing
Sheer complexity
So far, computer simulations of quantum dot interactions have been limited by their sheer complexity. Since the processes involve thousands of atoms, each hosting multiple electrons, the characteristics of exciton formation and recombination cannot be fully captured by even the most advanced supercomputers. Now, Krause, Bande and Tremblay have approximated the process through simulations of scaled-down quantum dots, each containing just hundreds of atoms.
In their study, the trio successfully modelled the behaviour of the quantum dots at the femtosecond scale. Their simulations revealed how the quantum dot pairs absorb, exchange, and store light energy. They also found how excitons can be stabilized by applying a sequence of ultraviolet and infrared pulses to quantum dots. While an initial ultraviolet pulse can generate an exciton in one quantum dot, a subsequent infrared pulse can shift the exciton to a nearby quantum dot – where the energy it contains can be stored.
The team simulated interactions between three pairs of germanium/silicon quantum dots, which had different shapes and sizes. They now plan to create more realistic simulations that will allow them to model how environmental factors such as temperature can affect interactions. Through further improvements, their results could lead to a wide range of applications for quantum dots including quantum bits (qubits) that can reliably store and read out quantum information and photocatalysts that absorb sunlight, facilitating reactions that produce hydrogen gas as a carbon-free fuel source.
One of the primary goals of radiation therapy is to deliver a large radiation dose to cancer cells whilst minimizing normal tissue toxicity. However, most cancer patients undergoing such treatments are likely to experience some side effects caused by irradiation of healthy tissue. The extent of this damage is dependent on the treatment location, with the most common toxicities involving the oral cavity and gastrointestinal tract.
Materials with a high atomic number (Z), often known as radiation-attenuating materials, can be used to shield normal tissue from radiation. However, integrating such materials into current patient treatment protocols has proven difficult due to the inability to rapidly create personalized shielding devices.
Before a patient undergoes radiotherapy, they undergo CT scans to provide anatomical information that is used to plan their treatment. Byrne and his colleagues utilize these CT images to design personalized radio-protective devices, which they produce through 3D printing.
To determine the most appropriate shielding materials for the device, the researchers tested various elements and alloys, including liquids, with a high Z number. They characterized these materials by measuring their relative mass attenuation coefficients. From this, the team determined that elemental materials demonstrated greater radiation shielding than alloys or composites, and that mercury largely outperformed all other liquids. They then incorporated the high-Z materials into the personalized 3D-printed devices. The devices were made such that the shielding material could be removed to reduce artefacts during CT imaging and replaced prior to treatment.
To evaluate the device’s ability to shield healthy tissue from radiation, the team treated 14 rats with single-dose irradiation, half with and half without radio-protective devices in place, and examined the incidence of toxicities such as oral mucositis and proctitis.
The group also simulated clinical radiation treatments by modelling the radio-protective devices in the treatment planning software. The dose distributions with and without shielding were compared to evaluate the dosimetric impact of the device. The researchers simulated treatments of prostate and head-and-neck cancer patients, selecting the appropriate positioning of the device based on the regions of increased radiation exposure.
Evaluation of radio-protective devices
Histopathological analysis revealed that only one of seven rats with radio-protective devices in place during treatment suffered ulceration on the surface of the tongue. In contrast, all seven control rats, with no device in place, experienced extensive ulcerations on the tongue surface.
The clinical simulations identified that using radio-protective devices during prostate cancer treatment could reduce the dose to healthy tissue by 15% without reducing the dose delivered to the tumour. For the head-and-neck cancer treatment, the dose absorbed by inner-cheek tissue was reduced by 30%.
The results clearly show that the radio-protective devices may improve patient comfort throughout the course of treatment. “Our results support the feasibility of personalized devices for reduction of radiation dose and associated side effects” claims Byrne.
Future clinical implementation
The benefits of using 3D-printed radio-protective devices in the clinic are clear. “This personalized approach could be applicable to a variety of cancers that respond to radiation therapy,” says Byrne.
The researchers acknowledge that full clinical translation of 3D-printed shielding devices will require further development. “Given the small sample size of our dosimetric studies, further investigation in larger cohorts is needed to validate these approaches,” they say.