As is the case for most academics, the job has a mixture of elements. A lot of my research and interaction with students involves analytical skills. Some of it is subject-specific knowledge, but a great deal of it is understanding how to interact with people – finding good ways to give constructive feedback and suggestions for how people can move things forward. I find that it’s important to do that while still being honest so that people realize when things are not working out, but also understand how to improve.
One big challenge is understanding how to work most efficiently. No matter how well you manage your time there are still only 24 hours in a day, so you have to be realistic about what you can achieve in the available time. Prioritization is a key skill — knowing when something is really important, and that you may have to drop everything else in order to make sure it gets done. But often it’s a juggling act, keeping several tasks on the go at the same time.
What do you like best and least about your job?
The thing that I enjoy best in my job is the thrill of discovery — if that’s not too pretentious a way of putting it – the feeling that at any moment we could have found something of interest in the data. I also enjoy the challenge of figuring out problems. Sometimes you can spend a lot of time scratching your head trying to understand what is going on, and there is great satisfaction when eventually you achieve it. That could be understanding some strange effect in the data, or overcoming some other problem.
I’m sure I won’t be the first person to say that the thing I like least is admin. We seem to be very good at inventing bureaucratic processes that may have been initiated for a good reason, but often outlive their purpose and nobody seems to be willing to get rid of them.
What do you know today, that you wish you knew when you were starting out in your career?
It’s tempting to say that I wish I had known what all the major discoveries were going to be. Then I could have got ahead of the curve and chosen to work on those. But if I already had that knowledge then I would not have enjoyed working on understanding it all, so I guess I don’t wish for that after all.
Really my answer to this is more focused on the human aspect — I would have like to have learnt a little earlier on the best ways of interacting with people. This also means learning about yourself, and by now I appreciate that sometimes it’s best to have a breath of fresh air or a cup of tea before responding to that difficult e-mail.
Over the course of my career, I also think that as a field we have learnt a lot about diversity and how it benefits the workplace, though there is still much to improve. I would like to think that I have always championed diversity, but it is certainly an area where it would have been beneficial to the field as a whole if we had done more about this, earlier, and I include myself in that.
An R&D collaboration between Queensgate, a UK manufacturer of high-precision nanopositioning products, and scientists at the National Physical Laboratory (NPL), the UK’s National Metrology Institute, has yielded experimental findings that are likely to attract commercial interest from manufacturers of next-generation atomic force microscopes (AFMs) and other scanning probe microscopy (SPM) systems.
In a proof-of-concept study completed earlier this year, an amalgam of enabling technologies from Queensgate – including high-speed, piezo-driven nanopositioning stages and proprietary closed-loop velocity-control algorithms – were put through their paces by NPL researchers in a series of experiments to evaluate their potential suitability for high-speed AFM scanning applications. The results are eye-catching: reliable capture of large-area, high-quality AFM images with nanometre spatial resolution – and all achieved in a matter of minutes, rather than hours or days, at raster scan speeds ranging from 0.5 mm/s up to 4 mm/s.
Although NPL and Queensgate have worked together on several previous occasions, the latest undertaking was conducted via the Measurement for Recovery (M4R) programme. This NPL-led initiative is funded by the UK government and aims to support industry with its recovery from the economic impacts of COVID-19. “M4R provides access to cutting-edge R&D, expertise and facilities to help address analysis or measurement problems that can’t be resolved using standard technologies and techniques,” explains Edward Heaps, research scientist for dimensional metrology at NPL, who carried out the experimental work on behalf of Queensgate. “Ultimately, the aim of M4R is to help boost productivity and competitiveness in UK industry post-pandemic.”
Accept no AFM compromises
To put the NPL study into context, it’s first necessary to recap the fundamentals of AFM. This powerful SPM modality uses an ultrasharp microfabricated tip (usually Si or Si3N4) attached to a cantilever to generate topographic images of a sample surface at very high resolution (between 1–20 nm depending on the sharpness of the tip). Deflection of the cantilever – a result of atomic-scale forces acting between the probe tip and sample – provides the basis for sample imaging and nanometrology as the tip is scanned across, and in close proximity to, the surface. In the same way, AFM is also able to map a range of mechanical surface parameters (e.g. stiffness, friction and adhesion) as well as chemical, electrical and magnetic properties on the nanoscale.
Get the picture: the NPL study involved high-speed AFM scanning of a series of standardized test samples. The grid in the above sample is set at a constant 300 nm spacing. (Courtesy: NPL)
Notwithstanding the upsides, there are non-trivial shortcomings associated with AFM and other SPM techniques. Slow measurement speed, for example, means low sample throughput and troublesome temperature-induced measurement drift because of prolonged scan times (in some cases running to many hours or days if a large area is to be imaged at high resolution). “Traditional experience with high-speed AFM says that there’s a trade-off between the scan speed and the range [scan area],” explains Heaps. “For the research user, the benefits of extended range and increased scan speed will be seen in measurement throughput. That ultimately translates into enhanced productivity and more published research papers.” The same calculus applies to industrial R&D users who may be using AFM for the quality control and imaging of semiconductor ICs, quantum nanodevices or advanced optical components.
For Queensgate’s engineering team, the NPL collaboration provided an opportunity to road-test a portfolio of technologies for closed-loop velocity control that, they believe, will address the systems-level compromises traditionally associated with high-speed AFM scanning. “We had already deployed closed-loop velocity control to do fast, accurate linear ramps for motion control,” explains Graham Bartlett, lead software engineer at Queensgate. “The M4R project allowed us to evaluate this capability for AFM scanning applications, knowing that image quality links directly to how accurate our velocity control is at maintaining dead straight, linear motion with constant speed.”
By extension, image quality also provides a visual indicator of how fast the AFM stage can be driven before accurate control of velocity cannot be maintained. “If you’re taking AFM measurements every few microseconds and you’re running at constant speed, you’ll get those measurements at a constant spacing and a clear image,” adds Bartlett. “If your AFM head speed is inconsistent, your measurements won’t be evenly spaced, and you’ll end up with a skewed or distorted image.”
Speed is nothing without control
Prior to the experimental study, Heaps used Queensgate hardware to retrofit NPL’s customized metrological high-speed AFM (an instrument co-developed by the University of Bristol, UK). In terms of specifics, that meant replacing the AFM’s existing 5×5 μm XY stage with a Queensgate NPS-XY-100 stage (100×100 μm range) driven by a Queensgate NanoScan NPC-D-6330 controller (which offers closed-loop control of position and velocity). Evaluation work subsequently proceeded along several coordinates, with initial tests establishing that velocity control remained sufficiently accurate at raster rates of up to 4 mm/s – though a progressive reduction in resolution on the raster axis is also seen as scan speeds are stepped incrementally from 0.5 mm/s to 4 mm/s.
Workflow efficiency: demonstrating direct capture of larger areas, this 80×80 μm AFM image was captured in 40 s using a 2 mm/s scan rate. Note that the sample shows visible scratches from earlier use. (Courtesy: NPL)
A related issue for fast AFM scanning is the extent to which rapid acceleration and deceleration at each end of a raster line excite mechanical resonances. This phenomenon, commonly known as “ringing”, is found to be amplified at the faster scan speeds – which in turn gives a somewhat smaller linear region for image acquisition. With closed-loop control and features such as notch filtering, however, the NanoScan controller can substantially reduce these effects over an open-loop control system. The controller also has built-in waveform generation capabilities, which include S-curve acceleration and deceleration profiles to further reduce such resonances.
The fine-detail of image acquisition also came under scrutiny as part of the NPL project. The combination of high speed and larger scanning area significantly simplifies the imaging process. With the original 5×5 μm piezo stage, large-area imaging with the NPL high-speed AFM requires a coarse positioner to move the nanopositioning stage to capture a series of smaller image “tiles” that are subsequently stitched together – a slow and cumbersome exercise that impacts aggregate acquisition time. By contrast, the NPL results show that the 100×100 μm piezo stage may be used on its own to capture a larger image, while the higher speed available using velocity control gives a greatly reduced timeframe. Even if a larger area needs to be captured, it will mean significantly fewer moves from the coarse positioner – another win for the NPS-XY-100 stage.
Following on from the M4R collaboration, Queensgate and its parent company Prior Scientific are looking to share the experimental findings directly with OEM partners in the SPM community and beyond. “We see real potential for our nanopositioning stages, control electronics and algorithms to deliver significant AFM improvements versus speed, throughput and image quality,” concludes Bartlett. “It’s also worth noting that those same core building blocks are well suited for other cutting-edge applications like 3D live-cell imaging using confocal microscopy.”
New ultralow-field MRI scanners are bringing unprecedented flexibility at low cost to the clinical setting, registrants heard at ECR 2021. Presenting the benefits of ultralow-field MRI, Mathieu Sarracanie, co-head of the Adaptable MRI technology (AMT) Center at the University of Basel, Switzerland, said both the upper and lower ends of the ultralow-field spectrum that feature in two recently-launched devices will shine bright in the modality’s future.
The lower end and the higher end of low-field MRI, bring benefits and value, including performance, lower costs, and easier siting than 1.5-tesla (T) and 3T MRI, he noted, including the unfriendly environment of the intensive care unit (ICU). However, within the range of low-field, advantages may vary.
Illustrating the differences between ultralow-field scanners, he cited two commercial systems as case examples. The Siemens Magnetom Free.Max, a 0.55T scanner with an 80-cm bore, weighs in at 3.2 metric tons (3200 kg). This scanner has been used routinely for imaging the abdomen, as well as for different organs such as the lungs and for cardiovascular procedures.
Mathieu Sarracanie.
“The major pro is that it is basically a standard MRI, it has a large bore, no quench line, which is a huge advantage, no need for helium refill and shows very good imaging performance. The cons are (also) that it is basically a standard MRI, and the siting is similar to a 1.5T machine,” noted Sarracanie, pointing out that this solution might not be suitable for ICU, and that it might be problematic for neurological applications where resolution and the capacity to leverage susceptibility contrast are key.
Sarracanie pointed to the Hyperfine scanner as his second example, noting that he co-founded the ultralow-field MRI startup in 2014 with the aim of bringing MRI to places where previously it wasn’t feasible.
The Hyperfine SWOOP, a 64mT machine, intended mostly for head injury but also MSK wrist, knee and foot imaging, can be located in smaller and more crowded spaces such as the ICU, stroke unit, outpatient centres, and paediatric departments. The average scan for a patient is 35 minutes and that includes T1, T2, FLAIR, and diffusion imaging with 3D slices and millimetric resolution, he said. The Hyperfine needs a monthly subscription and has to be integrated into the hospital’s PACS.
The Hyperfine SWOOP 64mT MRI scanner. (Courtesy: Mathieu Sarracanie)
“This solution is truly disruptive, in the sense that the technology allows for a paradigm change. It has a small footprint and is also mobile. These machines don’t need any specific siting and the cost is low. The con is that these devices are purpose-built and some customers may see that as a disadvantage,” Sarracanie said.
Pointing to Hyperfine’s imaging capacity, he noted that grey- and white-matter contrast can show very high dispersion at lower field strength. This has been explored by the researchers at the University of Aberdeen, UK, who have generated some fascinating T1 contrast results in stroke patients thanks to a novel fast-field cycling MR scanner, he noted.
“Now is the time for ultralow-field MRI. The 0.55T machine could be a serious contender to the standard 1.5T as it is more compact and cost-efficient. Machines at even lower field strength will not replace MRI as we know it but will expand its use and bring it to other places that we don’t know yet,” Sarracanie added.
7T detail
High-field MRI of 7T and above might seem like a cool toy with little clinical benefit, but in October 2017, the FDA approved the first 7T MRI platform for clinical use, pushing it from the realm of research to the clinical world, according to Anja van der Kolk, a neuroradiologist at the UMC Utrecht and Netherlands Cancer Institute/Antoni van Leeuwenhoek Hospital in Amsterdam, who spoke about the benefits of ultrahigh-field MRI in brain diseases during the same ECR session, organized jointly by the European Society of Radiology and European Federation of Organisations for Medical Physics.
Anja van der Kolk.
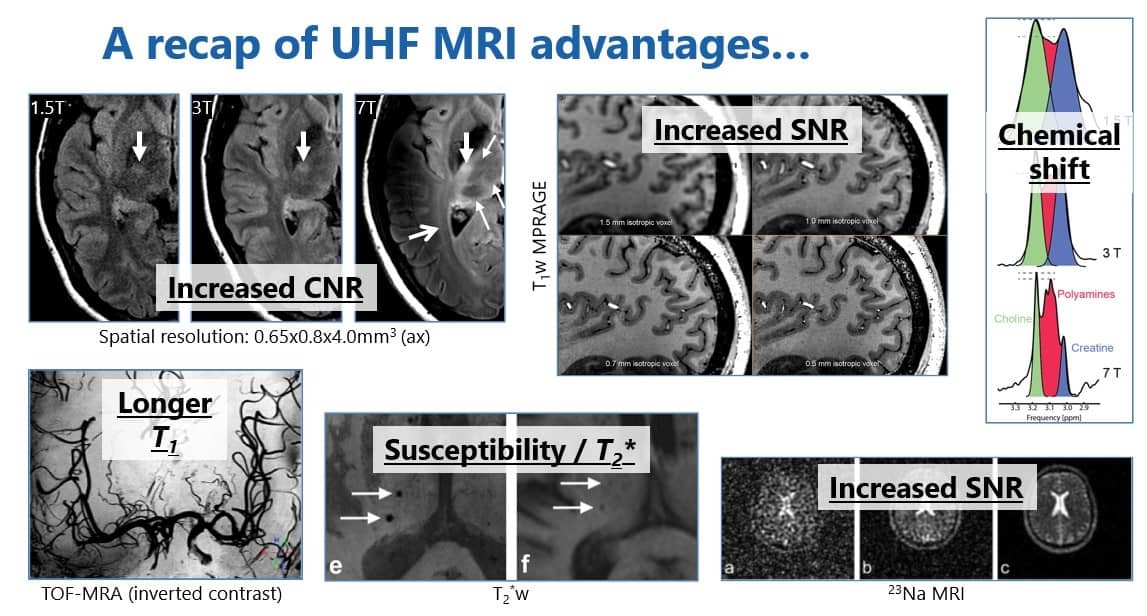
Ultrahigh-field MRI provides more anatomical detail due to higher spatial resolution within a reasonable scan time. New detail can be gleaned from T2-weighted imaging because of the increased susceptibility effects. Increased signal-to-noise ratio also enables metabolic imaging and imaging of x-nuclei, while increased spectral resolution makes it possible to distinguish metabolic peaks that overlap on 1.5T.
Now essential for certain areas of healthcare, the advantages of ultrahigh-field translate not only into direct clinical benefits such as diagnosis, treatment and prognosis of disease, but also indirect ones such as knowledge about the development of diseases, their associated factors, and the effects of these diseases on other organ systems.
“These indirect benefits have a significant impact on our understanding of diseases and how to potentially diagnose and treat them in a better way,” she said.
Novel techniques
One of high-field MRI’s most promising applications is metabolic imaging, such as MR spectroscopy, chemical exchange saturation transfer, and sodium and x-nuclei MRI, according to van der Kolk.
“Specifically, in sodium MRI of brain tumours you can see high sodium concentration inside the enhancing part of the tumour, but also within the T2 hyperintense area around the tumour and which we know is caused by oedema and tumour cells. This may be a way to visualize infiltrative tumour cells,” she noted.
A summary of the main advantages of ultrahigh-field MRI. (Courtesy: Anja van der Kolk)
But should radiologists view ultrahigh-field MRI as a specialized platform for only some rare or difficult cases or as a routine platform and part of the MRI workforce?
Van der Kolk’s view falls between the two extremes. At the moment a specialized platform for specific cases, this niche modality may be used more routinely with time.
“Future studies will show if it is going to become the next 3T scanner,” she noted.
Clinical use
Her talk covered several specific neurological diseases already benefitting from ultrahigh-field MRI such as MRI-negative/cryptogenic epilepsy, Parkinson’s disease, deep-brain stimulation, multiple sclerosis, pituitary (micro)adenomas and brain tumours.
Ultrahigh-field MRI can have a clinical benefit in epilepsy, and this is because 30% of patients with the condition have the cryptogenic type, meaning no anatomical focus can be found. However, 7T MRI can detect new lesions that cannot be detected at lower field strengths in 30% to 40% of patients. Lesions such as focal cortical dysplasia, polymicrogyria, and mesial temporal sclerosis can be missed on 3T. And while these lesions can be seen on 3T retrospectively, she noted that the 3T images that illustrated her cases were performed in centres where dedicated epilepsy radiologists with high experience in detecting these abnormalities had missed them on 3T and had only seen them retrospectively on the original images once detected on 7T.
In addition to more accurate detection of the causes of epilepsy, and better assessment of Parkinson’s disease, the targeting of deep-brain stimulation electrodes also can be optimized through improved visualization of the basal ganglia and other grey-matter structures. Ideally, these electrodes should be localized in the dorsal border of the subthalamic nucleus – more readily visualized on 7T than on other field strengths.
Proven advantages
Multiple sclerosis is one of the best-studied diseases with 7T, and it leads to better lesion detection in younger patients for earlier diagnosis, as well as differentiation from other white-matter lesions: ultrahigh-field MRI was the first technique to depict the small central vein sign, which is characteristic of multiple sclerosis lesions and not seen in other white matter hyperintensities, van der Kolk noted. Also, it depicts paramagnetic phase changes and a persistent hypointense rim that can predict outcome in these patients.
She also pointed to 7T’s improved detection of very small microadenomas which would otherwise be missed on lower field strengths, making presurgical planning difficult.
Meanwhile for brain tumours, using 7T’s increased susceptibility effects and spectral resolution doctors can detect the 2-hydroxyglutarate peak, specific to gliomas, for example, while tumour progression is shown using the susceptibility effects of microvascularity, which increases during treatment.
However, there are challenges, she said. So far it is unclear what the clinical consequences of some findings will be, and importantly nonradiology clinicians will have to know what the advantages of ultrahigh-field scans are in order to request them.
The artificial tendon material developed by UCLA materials scientists. Credit: Sidi Duan, Shuwang Wu, Mutian Hua, and Ximin He/UCLA
A strong, flexible and tough hydrogel that contains more than 70% water could be used to make durable artificial tendons and other load-bearing biological tissues. The new hydrogel was made by researchers at the University of California, Los Angeles, US and is based on polyvinyl alcohol (PVA) – a material that is already approved for some biomedical applications by the US Food and Drug Administration.
Biological tendons are also more than 70% water, yet they remain strong and tough thanks to a series of connecting hierarchical structures that span length scales from nanometres to millimetres. Researchers have been trying to mimic these materials using hydrogels, which are three-dimensional polymer networks that can hold a large amount of water and are structurally similar to biological tissue. The problem is that so far, hydrogels that contain as much water as natural tendons tend not to be as strong, tough or resistant to fatigue as their biological counterparts.
Salting out a freeze-casted structure
In their work, a team led by Ximin He of UCLA’s Samueli School of Engineering began by freeze-casting, or solidifying, PVA to create a honeycomb-like porous polymer structure. The micron-sized walls of the pores in this material are aligned with respect to each other and serve to increase the concentration of PVA in localized areas.
The researchers then immersed the polymer in a salt solution (“salting out”) to precipitate out and crystallize chains of the polymer into strong threads, or fibrils, that formed on the surface of the pore walls. This phenomenon is known as the Hofmeister effect.
Hierarchical assembly of anisotropic structures
The resulting hydrogels have a water content between 70 and 95%. Like natural tendons, they contain a hierarchical assembly of anisotropic structures spanning lengths from the molecular scale up to a few millimetres.
He and colleagues tested various salt ions in their experiments and found that sodium citrate was the best at salting out PVA. When they used a mechanical tester to measure the stress-strain characteristics of the resulting hydrogel, they found that it had an ultimate stress of 23.5 ± 2.7 megapascals, strain levels of 2900 ± 450 %, a toughness of 210 ± 13 megajoules per cubic metre, a fracture energy of 170 ± 8 kilojoules per square metre and a fatigue threshold of 10.5 ± 1.3 kilojoules per square metre. The researchers say that these mechanical properties resemble those of natural tendons. They also note that their hydrogel showed no signs of deterioration after 30 000 stretch cycles.
Replicating other soft tissue
Since the Hofmeister effect exists for various polymers and solvent systems, He says the technique used in this work, which is detailed in Nature, could apply to other materials too. It might therefore be possible to use hydrogel-based structures to replicate other soft tissues in the human body, not just tendons.
As well as making these other tissues, the hydrogels could be used in bioelectronics devices that have to operate over many cycles, adds He. The structures could also be used as a coating for implantable or wearable medical devices to improve their fit, comfort and long-term performance.
The researchers’ longer-term ambition is to use the new hydrogel to mimic not only load-bearing tissues but also functional organs. “This could be achieved by combining 3D printing and tissue engineering with the hydrogel we have developed,” study lead author Mutian Hua tells Physics World.
Borophene – a sheet of boron just one atom thick – can be stabilized in air by bonding its atoms with hydrogen, researchers in the US have discovered. The new technique was developed Mark Hersam at Northwestern University and colleagues, who found that hydrogenated sheets of borophene (called borophane) oxidized far more slowly in air than pure boron sheets. Their approach could enable researchers to finally realize many of the proposed applications of borophene – which were previously seen as impractical outside the lab.
In its atomically thin 2D form, boron has a diverse array of crystal lattice structures. Together named borophene, these sheets have many desirable properties: including high mechanical strength, flexibility, and phonon-mediated superconductivity. Like carbon-based graphene, these 2D materials hold the potential to revolutionize many aspects of electronics. However, unlike graphene, borophene is much trickier to fabricate into practical devices.
While graphene can be produced by simply peeling away layers of graphite, borophene must be synthesized directly on a substrate: a process first demonstrated by Hersam and colleagues in 2015. Unlike graphene, borophene rapidly oxidizes when exposed to air, removing its conductivity. This means that any experiments on the material must be carried out in ultra-high vacuum conditions, severely restricting the integration of borophene within practical devices.
Chemical functionalization
Previously, chemical functionalization by adding different atoms has been widely used to fine-tune the electronic properties of materials including graphene. Among the resulting products is graphane, in which the carbon atoms are bonded with hydrogen. Inspired by this process, Hersam’s team exposed borophene to atomic hydrogen in ultra-high vacuum to produce sheets of borophane featuring boron atoms bonded to hydrogen in several different ways.
The researchers then used a combination of atomic-scale imaging, spectroscopy, and theoretical calculations to determine the diversity of crystal lattice structures of their new material. Overall, they identified eight distinctive bonding patterns, each of which retained the desirable traits of borophene. The team also showed that their process could be entirely reversed through the thermal desorption of hydrogen – returning the boron to its original pure state.
Outside the vacuum chamber , Hersam and colleagues found that the oxidation rate of borophane was two orders of magnitude lower than borophene – demonstrating a far higher stability in air. This resilience at standard temperatures and air pressures could now significantly improve the prospects for the practical use of atomically-thin boron outside the lab. Applications could include batteries, sensors, solar panels, and quantum computers. If achieved, the team predicts a potential revolution in electronics; comparable even with previous advances brought about by graphene.
Antihydrogen atoms have been laser-cooled for the first time, paving the way for precision studies that could reveal why there is much more matter that antimatter in the universe. The cooling was done by an international team of physicists at CERN in Switzerland, who used a new type of laser to cool the antiatoms and then measured a key electronic transition in antihydrogen with unprecedented precision. Their breakthrough could lead to improved tests of other key properties of antimatter.
In every process ever observed in the laboratory and almost every process predicted by the Standard Model of particle physics, the creation of a particle is always accompanied by the creation of its antiparticle. Conversely, when a particle and its antiparticle meet, the two annihilate. One indisputable fact, however, is that we live in a universe that is made almost entirely of matter – raising the question of how lots of matter was created without an equivalent quantity of antimatter at the Big Bang.
In the Standard Model, the physical properties of a particle (such as an electron) appear to be equal and opposite to its antimatter equivalent (the positron) – electrons and positrons have the same mass but opposite electrical charge, for example. Therefore, looking for tiny differences between particles and their antimatter equivalents could shed light on the matter-antimatter asymmetry in the universe. One way of doing this is to make and study antihydrogen, which comprises a positron and an antiproton.
Annihilation problem
As with ordinary hydrogen, the quantum properties of antihydrogen become clearer at low temperatures. Cooling antiatoms like antihydrogen, however, is far from straightforward. Many techniques for cooling matter are simply unavailable: sympathetic cooling, in which the atoms lose energy by colliding with different atoms, is not feasible as they would annihilate. Evaporative cooling, in which all but the very coldest atoms leave the trap, taking the energy with them, is currently impossible because antiatoms are so hard to produce: “It’s just not an option with antimatter,” says Jeffrey Hangst of Aarhus University in Denmark, who works on the Antihydrogen Laser Physics Apparatus (ALPHA) experiment at CERN; “We don’t have the numbers; we don’t have the density.”
One possibility is Doppler cooling, which works – paradoxically – by exciting the atoms. If the atoms are irradiated with a laser frequency just below that needed to excite an electronic transition, an atom moving towards the beam will see the radiation blue-shifted and may absorb a photon. When this excited state decays, it emits more energy than it originally absorbed, cooling the sample. This technique is widely used with other atoms but faces a problem with hydrogen – the one atom whose antimatter counterpart has so far been produced. The only suitable transition is the Lyman-alpha transition between the 1s and 2p orbitals, involves light at vacuum ultraviolet wavelengths around 121 nm. However, there are no practical lasers operating in this region and efforts to develop a continuous wave 121 nm laser had foundered after years of attempts.
“A lot of grief”
For the new work, fellow ALPHA member Makoto Fujiwara from TRIUMF in Canada suggested they try pulsed laser cooling and, together with colleagues, set out to produce a device that produced 121.6 nm laser pulses from 729.4 nm continuous wave laser light: “In retrospect it seems like kind of an obvious thing to do,” says Fujiwara, but Hangst says Fujiwara “took a lot of grief from some of our colleagues when he proposed this and when they started building the laser”.
The researchers then designed a cylindrical magnetic trap with transparent ends. At one end, they injected antiprotons from CERN’s antiproton decelerator. At the other, they added positrons. After several hours, around 1000 antihydrogen atoms had accumulated in the centre of the trap. The researchers then used their laser to cool the atoms. They do not report a final temperature in their paper, as the atoms had not reached thermal equilibrium, but the sharpened Lyman-alpha peak revealed that the atoms were moving more slowly than had previously been achieved.
Einstein’s equivalence principle
The researchers next measured the frequency of the transition between the 1s and 2s orbitals in antihydrogen: “It’s the thing we understand best in hydrogen, it’s measured absolutely to a precision of about 10-15,” says Hangst, “and that’s the thing we want to compare with antihydrogen.” Their new results show an improved precision from cooling and they intend to report a comparison with hydrogen in future work. The team also wants to study other properties of antihydrogen, starting with Einstein’s equivalence principle, which says that matter and antimatter behave the same under gravity.
Fujiwara describes the team’s success as “revolutionary” and Vladan Vuletić of the Massachusetts Institute of Technology (who was not involved in the work) agrees: “The main challenge with cooling hydrogen or antihydrogen has always been…the generation of laser radiation at such short wavelengths with the necessary spectral purity…You’re building this on top of this very complex experiment: you first need to produce the antiprotons; you need to trap them together with the positrons in an electromagnetic trap; you need to neutralize them into antihydrogen and then on top of all that you need to bring in your laser cooling.”
The Japanese semiconductor pioneer Isamu Akasaki has died at the age of 92. His work in the late 1980s and early 1990s led to the development of blue light-emitting diodes (LEDs), which soon found a wide range of applications from low-energy light bulbs and mobile-phone displays to televisions. For the work Akasaki shared the 2014 Nobel Prize for Physics together with fellow Japanese-born researchers Hiroshi Amano and Shuji Nakamura.
Akasaki was born in Chiran, Japan, on 30 January 1929 and graduated from Kyoto University in 1952. After receiving a PhD in electronics in 1964 from Nagoya University, he moved to Matsushita Research Institute Tokyo before returning to Nagoya in 1981 where he remained for the rest of his career. From 1992 Akasaki held a joint position with Meijo University, which is also in Nagoya.
It was at Nagoya and Meijo where Akasaki conducted much of his Nobel-prize-winning research. The first red LED was created in the early 1960s and researchers then managed to create devices that emitted light at ever-shorter wavelengths, reaching green by the end of that decade. However, creating devices that could deliver enough blue light was a struggle. But doing so was essential for a source of white light – needing, as it would, red, green and blue LEDs.
Crystal maze
At Nagoya in the 1980s, Akasaki and Amano focused on making blue LEDs from the compound semiconductor gallium nitride (GaN) given that it has a large band-gap energy corresponding to ultraviolet light. Yet they needed to overcome several challenges, including the ability to create high-quality crystals of GaN with good optical properties. To do so they used metal-organic vapour-phase epitaxy techniques to deposit thin films of high-quality GaN crystals onto substrates.
Another issue was to learn how to dope the GaN so it is a “p-type” semiconductor, which is crucial for creating an LED. Akasaki and Amano noticed, however, that when GaN doped with zinc is placed in an electron microscope, it gives off more light than if undoped, which suggested that electron irradiation improved the p-doping.
This effect was later explained by Nakamura, who was based at the Nichia Corporation and was working independently on GaN blue LEDs. In the early 1990s both groups then used their high-quality, p-doped GaN to make high-brightness blue LEDs, achieved by combining them with other GaN-based semi-conductors in multilayer “hetero-junction” structures. Today, GaN-based LEDs are used in back-illuminated liquid-crystal displays in devices ranging from mobile phones to TV screens.
In 2014 Akasaki, along with Amano and Nakamura, were awarded the Nobel Prize for Physics for “the invention of efficient blue light-emitting diodes which has enabled bright and energy-saving white light sources”. Akasaki was awarded many other prizes during his career including the Japanese Order of Culture in 2011 and the Queen Elizabeth Prize for Engineering in 2021. He died on 1 April from pneumonia.
A few years ago, atmospheric physicist Grant Allen and his colleagues were using drones to measure methane emissions from a fracking site in Lancashire in the north-west of England. But next door to the shale-gas operation was a dairy farm and the researchers wondered if they could also measure the methane produced by the cows. So while the animals were in the barn being milked, the researchers flew their drone system in the fields outside.
“They have about 150 cows and once you put them all inside a box, like a barn, they become a condensed system that you can model as a point source of emissions,” says Allen, who is based at the University of Manchester, UK. It is then possible to measure the concentration of the methane that is downwind with a drone. “And if you know the wind speed and you’ve got the measurement of the concentration,” Allen continues, “you can do some clever maths to calculate what the emission flux is in grams per second from the herd as a whole – that way you can get an average emission per cow.”
Cattle are responsible for a huge amount of greenhouse-gas emissions. Globally the livestock sector accounts for the equivalent of seven gigatonnes (7 × 10¹² kg) of CO2 every year, according to the United Nations. This is around 15% of anthropogenic emissions – a similar proportion to cars. On a commodity basis, beef and milk from cows are responsible for the highest proportion of these emissions. And almost 40% of that seven gigatonnes is methane produced by fermentation in the stomachs of ruminants – mainly cows.
Over the course of a week, the fracking site that Allen and his colleagues were monitoring released more than 4 tonnes of methane – equivalent to the environmental impact of 142 trans-Atlantic flights. But this was linked to a single event, thanks to operations to clean out a 2.3 km-deep shale gas well. While sources of methane like this are sporadic, cattle belch methane all year round. “If you compare it over a few days, the fracking site was emitting a lot more per unit time over that period,” Allen explains. “But if there were no other emissions from the fracking site for the rest of the year, then the cumulative flux from a dairy herd of 150 cows for a whole year is more.”
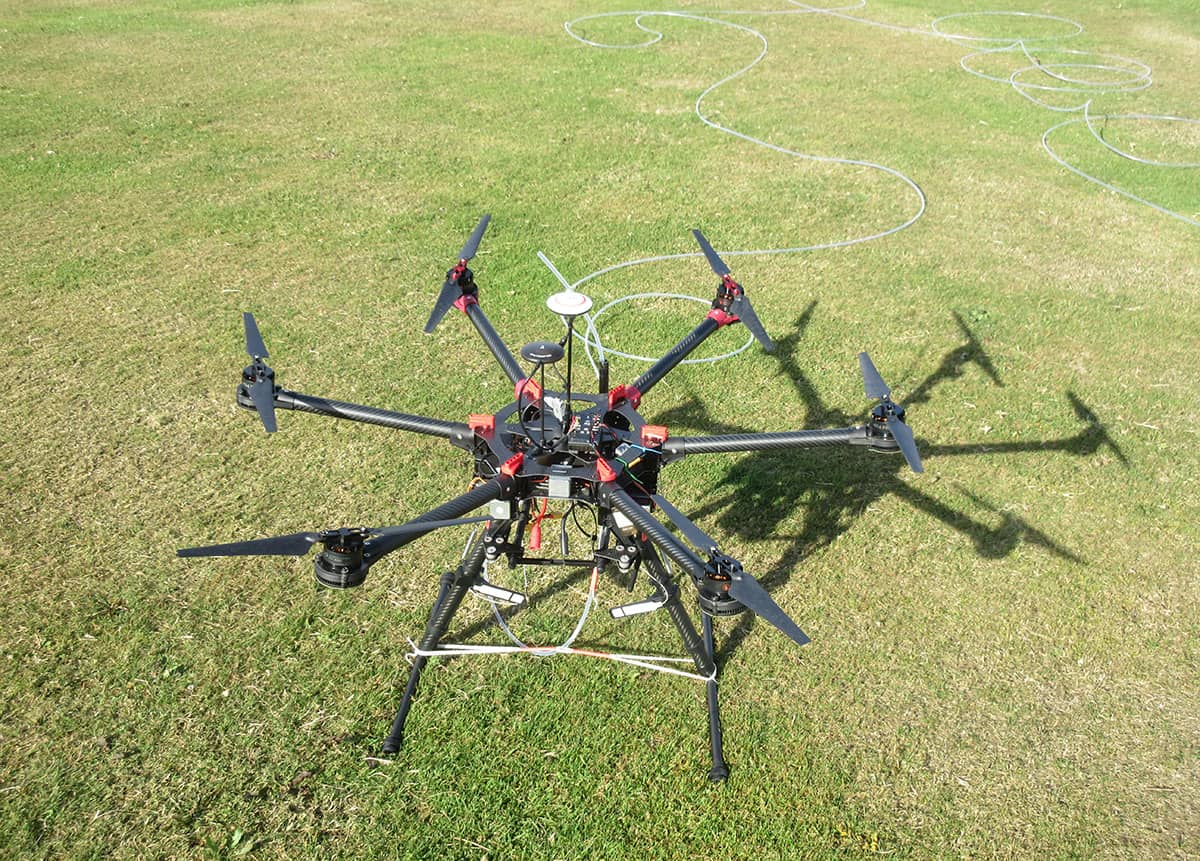
Droning on The drones used by Grant Allen of the University of Manchester are tethered using tubes connected to spectrometers on the ground. The drones did 22 surveys downwind of a point-source of methane gas, released from a regulated cylinder with a flowmeter. (Courtesy: Grant Allen)
Fermenting plants, burping methane
Cows and other ruminants eat grass, straw and other fibrous plants that are simply indigestible to most other animals. To extract nutrients from the complex carbohydrates – particularly cellulose – in these plants, the animals ferment them in a special stomach chamber known as a rumen. In this oxygen-free environment, microbes (mainly bacteria) break down the complex plant material. But as this process occurs, it produces a vast amount of hydrogen.
As the hydrogen builds up, the cow turns to another group of bacteria-like micro-organisms known as archaea. These bugs use the hydrogen as a source of energy but produce methane as a by-product, a process known as methanogenesis. And as this gas builds up, the cow belches it out, which is good for the cow, but not the planet because methane is a potent greenhouse gas. Although it only survives in the atmosphere for a decade or two, over a 20 year period it has more than 80 times the global-warming potential of carbon dioxide, according to the Intergovernmental Panel on Climate Change.
Ruminating on ruminants Ermias Kebreab from the University of California, Davis is studying ways to reduce methane emissions from cattle. (Courtesy: UC Davis/Katherine Kerlin)
This makes methane a good short-term target for tackling climate change, says animal scientist Ermias Kebreab, director of the World Food Center at the University of California, Davis. While reducing carbon dioxide needs to be the long-term focus, it will take a while for us to see the effects of this as carbon dioxide persists in the atmosphere for centuries. “But the effect of slowing down or reducing methane will be felt in a decade or so,” explains Kebreab. And given that they are responsible for more than 40% of anthropogenic methane emissions, livestock are a good place to start.
Improving productivity is key to reducing emissions. According to Kebreab, you can make animals produce more protein – milk or meat – per kilogram of feed with a combination of genetics and good nutrition. For example, he explains, there are cows in low-income countries that produce around 4–5 kg of milk per day. But if you were to cross breed those with Holstein-Friesian cows – which are renowned for their high milk production – you could get 20 kg of milk per day, while maintaining some of the advantages of the local breeds. Indeed, over the last five decades, a focus on breeding and meeting nutritional requirements has cut methane emissions per litre of milk by about 50% in the US. There are now fewer dairy cows than half a century ago, but they each produce more milk (figure 1).
1 Feeding a growing population Changes (relative to 1950) in total milk produced, milk production per cow, total number of cows and dairies and methane produced per kilogram of milk in the California dairy industry. (Data source: Ermias Kebreab)
Seaweed supplement
To cut emissions even further, Kebreab’s recent work has focused on using seaweed as a feed additive. He and others have shown that adding various species of seaweed to a cow’s food can reduce methane production by as much as 90%. “It’s absolutely crazy,” Kebreab exclaims, adding that there is minimal processing of the seaweed before it is given to the cattle. “When it’s collected, we freeze dry it to make sure that the active ingredient is stable. After that, you just crush it into a powder, which is added to the feed,” he explains.
The seaweed inhibits methanogenesis. The archaea in the cows’ rumen use enzymes to break down gases, but various compounds in the seaweed appear to interfere with some of these enzymes. This means the microbes are unable to complete the process and much less methane is produced. Other compounds have also been found to have similar effects. The Swiss AgriTech company Mootral claims that its garlic-based additive shows a 40% reduction in methane production.
In his research, Kebreab measures the methane produced by the cows using a system called GreenFeed. This trough-like machine contains food to entice the cattle and then measures the gases they breath and burp out while they are eating. There are also other devices for measuring the emissions of individual animals, such as respiration chambers and hand-held spectroscopy devices. While these systems are accurate, using them to measure large numbers of animals is expensive and time consuming. To get around this, animal scientists use the measurements from small numbers of animals to create models of emissions from different feeding systems that can be applied to whole herds. Increasingly, however, people are exploring ways to measure whole herds. That makes sense, as the variability in emissions between one cow and another can be huge. Such large-scale measurements can also help confirm models based on emission measurements from individual animals.
Taste the difference A small amount of macro red algae, a type of seaweed, has been mixed with molasses and added to cattle feed to study its effect on cattle emissions. (Courtesy: Gregory Urquiaga/UC Davis)
In the UK, Allen’s drones are tethered to the ground by a 150 m-long tube. As they fly downwind of the methane source, they pump air down through the tube to a spectrometer, which identifies different gases based on their spectral signatures (Atmos. Meas. Tech.13 1467). “We’re essentially measuring on the ground, but we’re measuring air that’s been brought down from where the drone was at that time,” Allen explains.
To test their mathematical models and accurately measure methane fluxes, Allen and his team developed a method that involved the controlled release of methane from a cylinder in a field. To ensure there was no cheating, it was decided that the person who flew the drone, analysed the data and calculated the methane emissions was not aware of how much methane was in the box, or the rate at which it was released. The result was a good correlation between the measurements and the known methane release. But achieving accurate results requires multiple flights adding up to a few hours of flight time.
Whole herd, or individual cow
Phil Garnsworthy, head of animal sciences at the University of Nottingham in the UK, is researching breeding cattle that are genetically predisposed to produce less methane. He says that the microfauna of the rumen varies from one cow to another, and appears to be fixed by genetics. “You can take the rumen contents from one cow and put it into another and after about two to four weeks, the population of bugs will go back to what it was before,” he explains.
“The cow has control over her rumen microbes. Breeding for low methane is breeding for a particular population of microbes in the rumen.” While respiration chambers provide accurate data, they are impractical for large-scale measurements of methane emissions, says Garnsworthy. That’s because when measuring methane emissions for breeding purposes, the cows need to be confined in the chamber for about three to seven days to get decent figures.
In the Nottingham study, the dairy herd is milked by robot. The cows, which wear chips for identification purposes, each come in three times a day and feed while being milked. To provide long-term methane measurements from individual animals Garnsworthy and his colleagues decided to try installing gas analysers in the feeding trays – a tube near the animal’s nostrils connected to an infrared spectrometer. “The first cow stuck its head in, and we suddenly saw this massive peak in methane about once every minute,” Garnsworthy says, “and we thought that must be it breathing in and out. Then we realized that it breathes in and out more often than once a minute, and that it was belching methane.”
The measurements from this technique are comparable with respiration chambers, the researchers found (Animals 10.3390/ani9100837). Garnsworthy says there are sectors of the scientific community who think his technique is “rubbish”, arguing that it is not as accurate as techniques like respiration chambers. But he believes that these other methods are not measuring cows under normal commercial conditions.
“They say our technique is so variable that it is not accurate enough for individual cows, but what we can do is measure them thousands of times and then get a pretty precise average,” he explains. And as this method involves measuring all the animals, individual measurements can be combined to provide methane emissions for the whole herd. That’s good because researchers can then compare emissions from farms or herds without having to measure individual animals. But, as Garnsworthy cautions, if you are interested in comparing animals for breeding purposes or conducting nutritional experiments, the observational unit needs to be individual animals. “It just depends what you want the data for.”
Elsewhere, researchers have been looking at systems that can monitor herds for longer periods, or even continuously. One option is to use point source lasers that criss-cross the field to measure emissions from the herd. In 2014 Richard Todd and colleagues at the US Department of Agriculture used this spectroscopy technique as well as the GreenFeed breath analysis system to measure emissions from 50 cattle grazing 26 hectares of Oklahoma grasslands. Three lasers scanned 16 paths over the prairie, while the cattle were fitted with GPS collars to track their locations.
Weather conditions and data on the positions of the cows allowed the researchers to measure upwind and downwind gas concentrations to track methane emissions from the cattle. They found that the laser results of methane emissions were comparable to the GreenFeed system, concluding that the open path lasers tended to overestimate emissions, while the GreenFeed method tended to underestimate them.
Sensitive scanning
Other scientists are looking at even more sensitive techniques. In 2019 Daniel Herman of the National Institute of Standards and Technology (NIST) demonstrated that dual frequency combs can measure emissions from cattle herds (Conference on Lasers and Electro-Optics 10.1364/CLEO_AT.2020.AW4K.1). A frequency comb is a very precise spectroscopy instrument, in which lasers emit a continuous train of very brief, closely spaced pulses of light covering millions of different frequency peaks. The individual peaks look like the teeth of a comb – giving the tool its name. These laser pulses act as markers that allow the detector to measure the spectral signature of any material through which they have passed, with incredible precision. Dual frequency combs use two combs with slightly different tooth spacing. This creates an even more sensitive device that acts like hundreds of thousands of laser spectrometers working together.
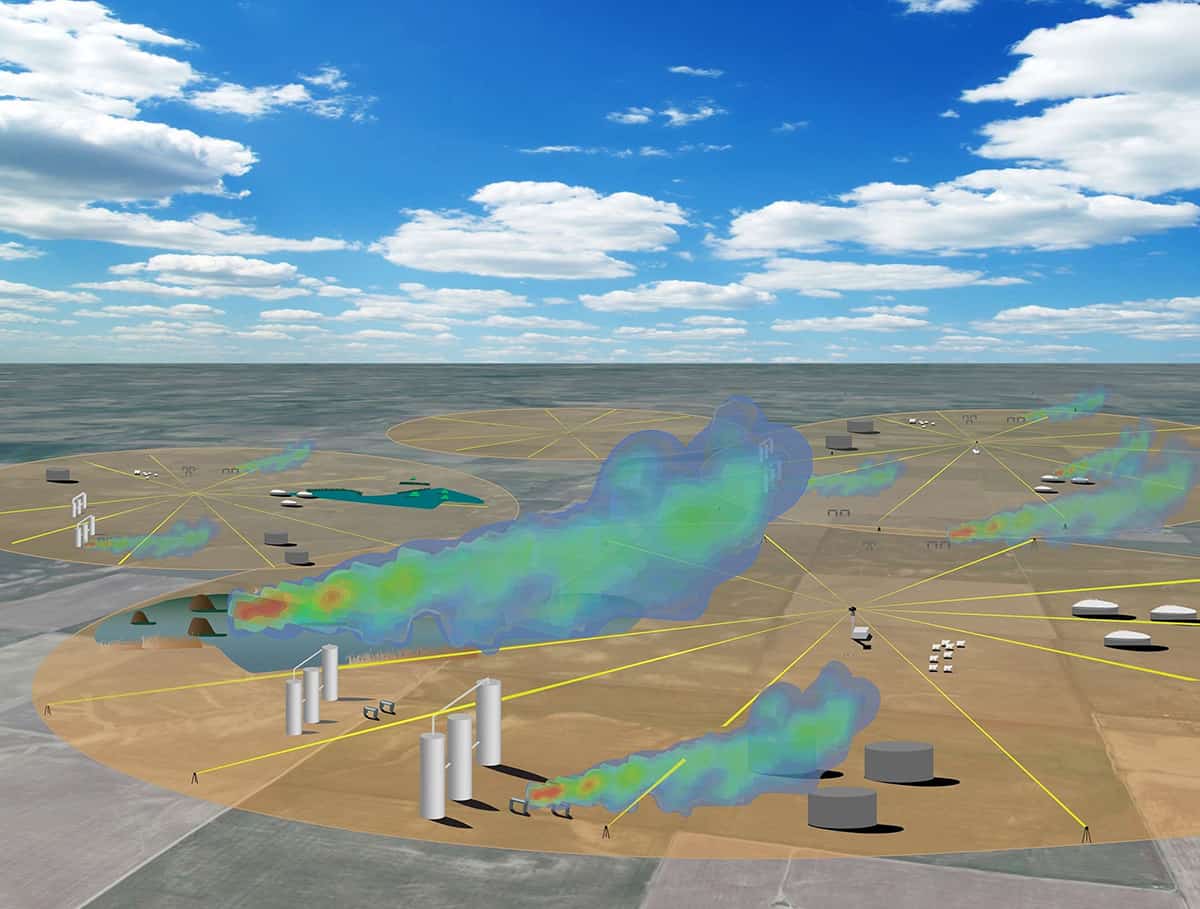
2 Detecting methane leaks Researchers led by Daniel Herman at the National Institute of Standards and Technology in the US have used a mobile dual-frequency comb laser spectrometer to measure bovine emissions. The spectrometer sits in the centre of a circle that is ringed with retroreflecting mirrors, with laser light from the spectrometer (yellow line) passing through a gas cloud and striking the retroreflector before being returned directly to its point of origin. The data are used to identify leaking trace gases (including methane), leak locations and emission rates. (Courtesy: Stephanie Sizemore and Ian Coddington / NIST)
In 2018 another NIST team, led by physicist Ian Coddington, had already demonstrated that a portable dual-frequency comb could be used to detect methane and other emissions outdoors, with extreme precision and over large areas (Optica5 320). In field tests designed to simulate emissions from oil and gas production, Coddington’s team was able to measure methane emissions of 1.6 g per minute from a kilometre away (figure 2). Herman and colleagues used two dual frequency combs on opposite sides of a feedlot containing around 400 cattle. One comb was downwind of the pen and the other upwind, to measure gas concentrations as air flowed in and out of the pen. The downwind system detected increases in methane, carbon dioxide and ammonia.
According to Allen, there are advantages and disadvantages to both the fixed-lasers-based systems and drones. While the fixed systems can monitor emissions continuously, they often rely on the wind blowing in a certain direction, so there can be a lot of dead time with emissions being missed. Also, methane is buoyant and can rise quite rapidly. The ground-level lasers can miss these plumes, while the drones can cover that vertical dimension and be positioned to account for wind direction. However, drones are expensive; require someone to fly them; and can only monitor for short periods at a time.
It is, however, also possible to measure methane emissions using aircraft. This is what Ray Desjardins, an atmospheric scientist at Agriculture and Agri-Food Canada, has spent decades working on. He explains that every 20th of a second, the equipment onboard an aircraft measures the concentration of different gases in the air, as well as the vertical motion of the air. “Basically, if there is a difference in the concentration between the air going up and down you can easily calculate the emission of a gas,” he says. But aircraft-based measurements can struggle to measure specific sources of methane. Recent work by Desjardins found that measurements of agricultural methane emissions, particularly from animal husbandry, are much more accurate when the area being surveyed is less than 10% wetland (Agricultural and Forest Meteorology 10.1016/j.agrformet.2017.09.003).
Desjardins says that the aircraft technique is used to check if a farm’s inventory of greenhouse gases is accurate. “That’s what we’ve mainly used it for at this point.” Eventually, he says, it may be a way to reward farmers and give them credit for using certain greenhouse-gas mitigating techniques. “It might be a way to verify that what they say they’re doing, they’re doing,” he explains.
Kebreab also thinks that rewarding farmers could be a good way to incentivize them to cut methane emissions. Mitigation can be expensive and an added cost on already strained finances. “Having protocols that would help them recoup the money they’re going to be spending on buying whatever technology is available would be very, very helpful,” he concludes. “If the technology actually allows them to improve their productivity, then that’s a win–win situation.”
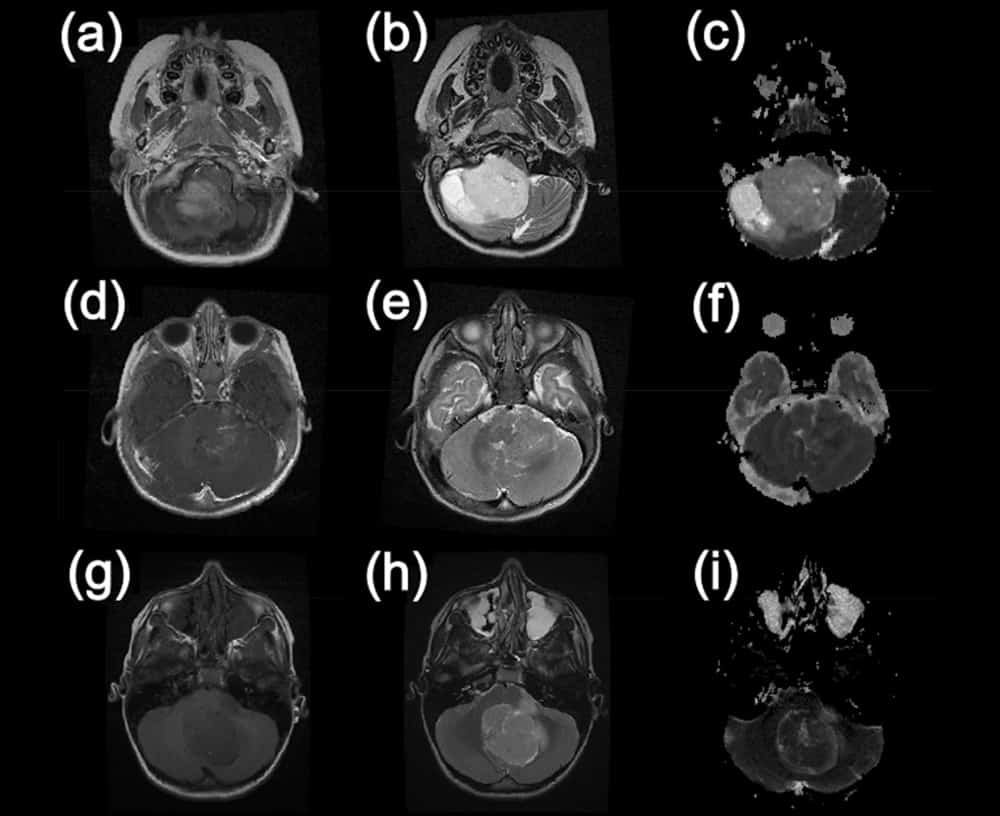
Example MR images from three paediatric brain tumour patients. First column: T1-weighted images after injection of gadolinium contrast agent; second column: T2-weighted images; third column: ADC (apparent diffusion coefficient) maps calculated from diffusion-weighted images. (Courtesy: CC BY 4.0/Sci. Rep. 10.1038/s41598-021-82214-3)
Brain and spinal cord tumours are the second most common cancers in children, making up about 26% of all childhood cancers. Many of these tumours are found in a region of the brain called posterior fossa, with the most common site being the cerebellum. There are three main types of such brain tumours – ependymoma, medulloblastoma and pilocytic astrocytoma – and as the treatment and outlook for each is different, accurate identification of tumour type is important to help improve surgical planning.
The most widespread method used in current clinical practice to characterize these tumours is through acquiring brain MRIs, which are then assessed by radiologists. However, this qualitative analysis is often challenging, due to the overlapping characteristics of these three types of cancers. This makes diagnosis difficult without the added confirmation of biopsy. One possible solution is to use diffusion-weighted imaging, which measures the random motion of water molecules in tissues, revealing details of the tissue microarchitecture. This more advanced MR technique can provide quantitative information regarding the tumour, in the form of apparent diffusion coefficient (ADC) maps, with the aim of improving diagnosis.
AI-based paediatric tumour classification…
A UK-based multi-centre study, led by the University of Birmingham and including researchers from the University of Warwick, focused on analysing ADC maps of paediatric brain tumours of the posterior fossa. The aim was to accurately identify the tumour type, without the need for biopsy. To achieve this, the group employed machine learning techniques and showed that it is possible to discriminate between the three most common types of paediatric posterior fossa brain tumour. They report their results in Scientific Reports.
Andrew Peet from the University of Birmingham.
Andrew Peet from the University of Birmingham explains: “When a child comes to hospital with symptoms that could mean they have a brain tumour, that initial scan is such a difficult time for the family and understandably they want answers as soon as possible. Here, we have combined readily available scans with artificial intelligence to provide high levels of diagnostic accuracy that can start to give some answers.”
…in a large-scale multi-centre study
The study involved 117 patients from five primary treatment centres across the UK (Nottingham, Newcastle, Great Ormond Street Children’s Hospital London, Alder Hey Liverpool and Birmingham Children’s Hospital), with MR images provided by 12 different hospitals (including the local hospitals where the children had their first scans) and a total of 18 different scanners. The images were analysed by a paediatric neuroimaging expert who manually drew regions-of-interest (ROIs) around the tumours. The researchers then extracted ADC values from the tumour ROIs and extracted a range of metrics from the ADC histogram.
The group used these features as input to two machine learning classifiers, a linear model called naïve Bayes (NB) and a non-linear model called random forest (RF), and trained them to noninvasively discriminate between the three most common types of paediatric posterior fossa brain tumours. The RF method achieved the best overall classification accuracy of 86.3%, while the NB classifier had the highest classification rates for ependymomas of 80.8%.
The authors report that these accuracies are not as high as previously seen in other studies. However, they note that their study is “much larger than the aforementioned studies with a more heterogeneous data input with regards to hospitals, scanners and acquisition protocols”. In fact, “previous studies using these techniques have largely been limited to single expert centres,” adds Peet. “Showing that they can work across such a large number of hospitals opens the door to many children benefitting from rapid noninvasive diagnosis of their brain tumour. These are very exciting times and we are working hard now to start making these artificial intelligence techniques widely available.”
Theo Arvanitis from the University of Warwick.
“Using AI and advance magnetic resonance imaging characteristics such as ADC values from diffusion-weighted images can potentially help distinguish, in a noninvasive way, between the main three different types of paediatric tumours in the posterior fossa,” explains co-author Theo Arvanitis from the University of Warwick.
“If this advanced imaging technique, combined with AI technology, can be routinely enrolled into hospitals, it means that childhood brain tumours can be characterized and classified more efficiently, and in turn means that treatments can be pursued in a quicker manner with favourable outcomes for children suffering from the disease,” Arvanitis adds.
I grew up in Calcutta, India, and did my schooling there. My dad was a materials engineer – a “metallurgist”, in those days– who graduated from the University of Manchester Institute of Science and Technology, and worked for a British company before ultimately starting his own business back in India. So I grew up in an environment of bold entrepreneurship as my dad built the family business – a materials-processing firm. Science and technology were very much part of my growing up.
I had a keen interest in what went on in the factories from a very young age. Not that I was deeply interested in physics when I was in school – I was more interested in music and acting at that age. But I ended up doing a natural sciences degree at Calcutta University, studying physics, chemistry and mathematics. Then when I was 21, I went into the family business. But within two or three years, I realized that wasn’t the place I wanted to spend my entire life. It didn’t feel right. The only way to get out of such a situation, particularly in India, was to become a student again – it was the most conflict-free way of saying I wanted to do something different. I ended up in the UK, doing materials engineering in Northumbria University. It was a very quick decision.
What was your experience like there, and what did that lead on to?
Northumbria was fantastic. I got a first-class degree and had an amazing time as well. As a mature student – by that time, I think I’d grown up a little bit – I was more interested in what was going on in the classrooms rather than in student politics. But also, I felt I had to prove something. It was the first time I came out of my comfort zone, in a way.
After that, I worked for a local company in North Tyneside, Elmwood Sensors, that was part of an international engineering group. That role was very much materials-science-based. In those days Elmwood Sensors had R&D activity at Durham University, so I got to know the university quite well. Durham kindly offered me a fully paid scholarship PhD, and I jumped on it.
My PhD was in materials science, based in a physics department. So I always say I did “the dirty end of physics”, really, in condensed matter. It was, again, a very enjoyable experience. It’s a great city to be in and once you’re in Durham, you never leave Durham. I took the PhD as a job. I finished within three years, and I got a prize for the best thesis for condensed-matter physics at Durham as well, which was nice to have.
How did you get from there to helping to found Kromek?
When I was doing my PhD, I fancied going to work in the City. The world of finance fascinated me. So, as I was finishing, I started to apply for jobs and I had one lined up in investment banking in London. But when I finished, I went travelling for four months with my wife. And while we were travelling, Durham was trying to spin this business out. The founder, Max Robinson, decided to invest some money in this spinout and they were looking for somebody to lead it.
I was contacted by Durham because they knew I had an interest in entrepreneurship and I loved science and technology. So I decided to give it a go. In May 2003 I returned to the UK, and that month the company operationally started. We had one patent that the university wanted to commercialize, and were based in the technology-transfer offices at Durham. So I had a room, a secondhand computer and a piece of paper. That’s how Kromek started.
What were the early years of Kromek like, and how did you get to where you are now?
Kromek came out of a roughly 20-year research history at Durham University. In the mid-1990s, as a leader of a European funding consortium, Durham developed an IP to grow cadmium telluride. That’s when the technology part began, and then in 2003 that was commercialized.
In the early days of Kromek, the business model was simple. We’d make a lot of these materials and scale it up. But we changed tack once we started to get an understanding of the market; we began to raise money and we realized it would be better to add more value to our offering. So we started developing electronics and application expertise. In 2013 we acquired one of the largest cadmium zinc telluride manufacturers in the US – so we are now a UK and US business, with 50% of our workforce in the US.
Max Robinson also had expertise in security imaging, which is how we got involved in that. Our first product happened to be a barcode scanner to detect liquid explosives – a product that is still used today in many airports. We also started seriously engaging with the US Department of Defense in 2008, which led to us protecting New York City and other cities against dirty bombs through large networked solutions for security.
We started making a spectrometer in 2009 – it was the GR1, which still remains the world’s smallest room temperature spectrometer, at the size of a matchbox. In 2011 we had just begun importing and distributing in Japan when the Fukushima disaster happened. The GR1 was used in the disaster aftermath because it was so small and very high resolution, ideal for getting in the right spots to categorize reusing shielding, for example.
So there are some very exciting technologies that have been developed in Kromek. We do medical radiation detection but we also do security – protecting ports, borders and cities – working with a fantastic customer base around the world.
What kind of skills are you looking for when hiring employees at Kromek?
The breadth of Kromek’s technology is big – we offer the whole platform. So we are interested in electronics engineers, semiconductor scientists, semiconductor engineers, process engineers, photonics scientists, core physicists and more. We do systems modelling and algorithm developments for software development. We are increasingly getting into artificial intelligence on a number of fronts – around bomb detection and in other parts of our portfolio. We’ve got a team of data scientists and AI specialists who are delivering product AI solutions.
Of course, we also need all the other important functions – sales, marketing, digital marketing, account management, product management and all the associated services that go with running a company. Core skills are important, but I’m always looking for personalities and what people bring to the business, as well. Will they fit into the team? Are they able to contribute and interact with other people? Emotional quotient is important.
What advice would you give to young, early-career scientists considering launching a spinout company from their university?
Entrepreneurship is an interesting journey. It is like learning to fly while you’re flying, so the challenges can be very big. Taking a realistic view of your financing is extremely important. Starting out with a vision of what it is you’re trying to build is key. And you have to believe in it completely.
Particularly with technology businesses, you have to bring a lot of people along with you, fixed on that vision, and go through the ups and downs that come with it together – it’s not going to be a straight line. When you start out, you have nothing except an idea. You’ve got to make that idea work, and then you have to prove that people are willing to pay to buy it.
Don’t try to be an expert in everything yourself because you’re not
Surround yourself with the best people you can afford. My philosophy is very simple: everybody in the business is better skilled than me, and they’re better at doing their job than I am. Your job as chief executive is about creating the vision, leading, co-ordinating and making sure all those experts and experienced people you’ve got with you are driven towards a common goal. Don’t try to be an expert in everything yourself because you’re not.
Science is about breaking new frontiers, inventing new things and increasing the knowledge that exists each day. When you come to the other side of industry and entrepreneurship, you are generally trying to convert that science into usable products or services. It’s about solving somebody’s problem using the science – and that means that you have to be completely customer-focused.
Having a piece of technology and having a successful business are two very different things, because technology is only one element of a successful business. Making sure you’ve got a good team involves not just brilliant scientists and brilliant people, but a group of people who gel with each other, work well together and have a common goal. Also, without taking risks, you’re not going to succeed. In innovation, there’s a clear understanding that if you haven’t failed, then you haven’t tried. You learn more from failures than when you succeed. It’s an exciting journey that nothing else can replace.
What is a day in the life of Arnab Basu like?
It varies from day to day. I have my internal responsibilities as the chief executive, working with my team. I’m a people person, so – in our previous norm – I’d be going from desk to desk talking to people, to understand what’s going on and trying to solve problems or enable and encourage my employees. I used to travel a lot, so I spent a lot of time with customers and working on related issues. That’s what really gives me a buzz: sitting in front of a customer and learning what they’re trying to achieve and how we can help them. I also spend time on strategy, in terms of looking forward and seeing what technology and what products we have, what markets they fit in and how we can expand them. It’s really wide-ranging stuff. It is all market-driven and market-focused, really.
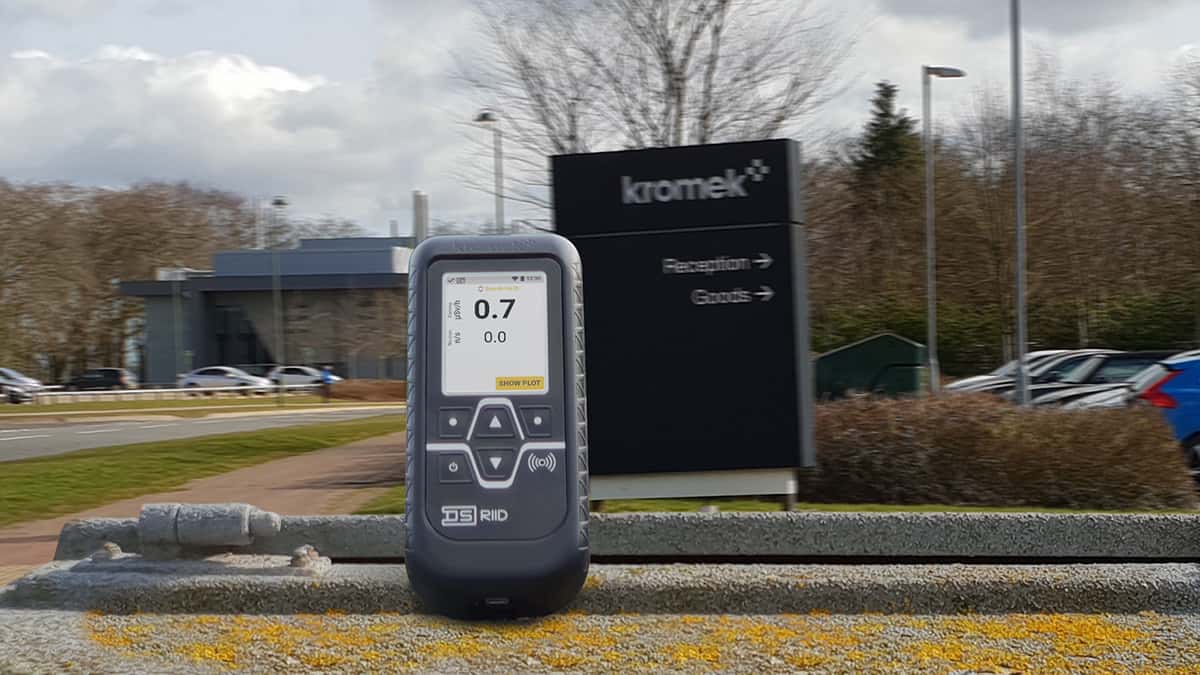
Handy handheld The D5 from Kromek is the world’s smallest radio isotope identification device. (Courtesy: Kromek)
How has the global pandemic altered the operation of your business?
COVID-19 has presented some unprecedented challenges. We’re still a relatively small business, operating on four sites, but with a global customer base. Some areas were badly affected. For example, in our medical-imaging segment, no hospital was focusing on installing new scanners while they were trying to understand how to handle the crisis.
We were lucky in a way, because we had taken steps towards adapting to new ways of working throughout the previous year. We did a pilot of homeworking 10 days before the first lockdown came into effect – but that was not because we had a grand vision of what was going to happen, it was just luck. We have learned a lot in the last year, and we’ve adapted. We’re a manufacturing business so we still have to have people in to do things in labs, to make stuff and build prototypes. You just can’t do that remotely, so we had to adapt our working conditions.
Of course, commercially, the business did suffer in the first half of 2020. But Kromek’s technology products are still needed in the market for very simple reasons. COVID hasn’t got rid of cancer, so early detection of cancer will still make a difference in people’s lives. The need to protect against terrorism hasn’t gone away, so products in that arena are still in demand. This growth market remains strong for us and will continue to be so.
What we are doing in biodetection is especially pertinent – developing a broad-spectrum monitoring system for airborne pathogens, on a very wide area basis. This is something that doesn’t exist today. These systems could sit in places where people are coming in and going out of countries, sampling air all the time. Any new variants, any new mutants, any novel viruses could be picked up and reported at an early stage.
Innovation will be key for us as a country, as a world and as a company. We must make sure we keep innovating, solving problems and providing solutions. That helps commercially in business – but it also aids humanity. That’s what the ultimate aim of science is and always should be.
What is your advice for students today – in a time when the future may seem bleak?
The world might be bleak today, but opportunities are borne out of situations like this. Fundamentally, the need for science, innovation and for good people to drive the world forward will not change. Any physics graduate already has the advantage of being able to look at a career from a very wide spectrum, whether you want to go into finance, product development, AI, data science or many other things.
I would say try to discover what you really want to do because it’s important that you pursue a career that you’re passionate about. I think the current generation of students are much more socially aware and put a lot more importance on the value of what they’re doing than my own generation. Our first priority was getting a mortgage and buying a car – we were much more materialistic, I think. That brings a different perspective and also a different way of looking at your career.
I think being a student now is not such a bad thing. COVID-19 will be behind you when you actually enter the job market. And there are some valuable skills that this pandemic has pushed people to learn. So use those, focus on those. Ultimately, skills are always needed.