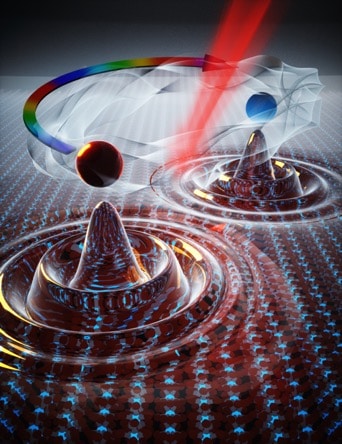
Schematic of light-induced coherent phonons that break crystal inversion symmetry and lead to the formation of Weyl points in a Dirac semimetal ZrTe5. (Courtesy: J Wang)
Researchers in the US have induced a huge and nearly dissipationless current in zirconium pentatelluride – a technologically important material that exhibits strong topological electronic effects – by illuminating it with laser light. The mechanism responsible for the effect, which occurs as the material’s crystal lattice “twists”, might find use in quantum computing applications and high-speed, low-power electronic devices.
Topological insulators are electrically insulating in their bulk, but they can conduct electricity extremely well on their surfaces (or edges) via special electronic states that are protected from fluctuations in their environment. Within these states, electrons can only travel in one direction (or channel) and do not backscatter. Since backscattering is the main dissipating process in electronics, topological insulators can carry electrical current with near-zero dissipation. This means they could be used to make electronic devices that are far more energy-efficient than any that exist today. The dissipationless electric currents in topological materials could also become the basis for quantum bits (qubits) because the materials shield fragile quantum states from impurities and lattice vibrations.
For physicists, zirconium pentatelluride (ZrTe5) is a particularly interesting topological material because it exists in a wide variety of topological phases. Indeed, depending on how it is configured, it can behave as a weak or strong topological insulator, a 3D quantum Hall state or a Dirac semimetal. In the latter phase, ZrTe5 exhibits exotic electron conduction behaviour thanks to the unique state of its crystal lattice and electronic structure, which protect electrons from backscattering, explains Jigang Wang, a physicist at the US Department of Energy’s Ames Laboratory and Iowa State University. “The anomalous electron transport channels protected by the symmetry and topology in ZrTe5 don’t normally occur in conventional metals such as copper,” he says.
Light-induced giant current
Wang and colleagues at Brookhaven National Laboratory and the University of Alabama at Birmingham discovered that they could generate a huge current in ZrTe5 by exposing the material to laser light at terahertz frequencies. This current arises because light at these frequencies triggers vibrations, or phonons, in the material’s crystal lattice that distort its symmetry.
The researchers explain that this effect, which they term phononic symmetry switching, gives rise to points in the twisted lattice where electrons behave like Weyl fermions – massless particles capable of carrying the sought-after, protected, low-dissipation current.
Weyl fermions were first predicted in 1929 by the theoretical physicist Herman Weyl, who identified them as possible solutions of the Dirac equation. Electrons of the Weyl type behave very differently to electrons in ordinary metals or semiconductors. Indeed, Wang and colleagues found that the electrons in their twisted ZrTe5 travel at very high velocities – near a fraction of light speeds (~c/300) – over distances as long as 10 microns.
Universal topology control principle?
The researchers, who report their work in Nature Materials, note that phononic symmetry switching enables them to control the flow of electrons without using electric or magnetic fields. Such a fast, low-energy, symmetry-based switch was lacking until now, says team member Qiang Li, who heads the Advanced Energy Materials Group at Brookhaven. “Our results add to a broader picture of quantum control of topological systems with symmetry selective infrared and Raman coherent phonon pumping suitable for these applications,” Li tells Physics World.
The team says it now plans to extend its method to explore other topologically-based ways of controlling electron flow in materials relevant for topological effect transistors, quantum computing and spintronics. “This light-induced Weyl semimetal transport and topology control principle appears to be universal and will be very useful in the development of future quantum computing and electronics with high speed and low energy consumption,” says team member Ilias Perakis of Alabama-Birmingham.
Parity violation pioneer Chien-Shiung Wu is featured on a US stamp. (Courtesy: USPS)
The US Postal Service (USPS) has issued a commemorative stamp honouring the Chinese-American physicist Chien-Shiung Wu. The 1957 Nobel Prize for Physics was shared by Chen Ning Yang and Tsung-Dao Lee “for their penetrating investigation of the so-called parity laws which has led to important discoveries regarding the elementary particles”. However, some physicists argue that Wu should have shared the prize for providing the experimental evidence for Lee and Yang’s theoretical prediction of parity violation. Wu now follows in the footsteps of Albert Einstein, Enrico Fermi, Richard Feynman and Maria Goeppert Mayer with a commemorative stamp. Just a shame she did not bag a Nobel prize too.
We love all things quantum here at Physics World, and it seems like we are not alone. Quantum Quilts toilet tissue is made by the UK’s Leicester Tissue Company and it has been spotted at the discount retailer Poundland. The photo below was posted on Twitter by ieva with a rather cheeky caption.
Scroll down the replies to ieva’s tweet and you will find the alternative captions “Entanglement-enhanced absorption” and “Spooky wiping at a distance” – and there is also tweet from someone who uses a photo of the related brand Quantum Soft as their background photo.
An electrochemically powered artificial muscle made from twisted carbon nanotubes contracts more when driven faster thanks to a novel conductive polymer coating. The device, which was developed by Ray Baughman of the University of Texas at Dallas in the US and an international team of collaborators, overcomes some limitations of previous artificial muscles, and could have applications in robotics, “smart” textiles and heart pumps.
Carbon nanotubes (CNTs) are rolled-up sheets of carbon with walls as thin as a single atom. When twisted together to form a yarn and placed in an electrolyte bath, these hollow carbon cylinders can be made to expand and contract in response to electrochemical inputs, much as a human or animal muscle does. In a typical setup, a voltage difference, or potential, between the yarn and a counter electrode drives ions from the electrolyte into the yarn, causing the “muscle” to actuate.
While these electrochemically driven CNT muscles are highly energy efficient and extremely strong – they can lift loads up to 100,000 times their own weight – they do have limitations. The main one is that they are bipolar, meaning that the direction of their movement switches whenever the potential drops to zero. This effect reduces the overall stroke of the actuator. Another drawback is that the muscle’s capacitance – that is, its ability to store the charge it needs to expand or contract – decreases when the potential is scanned more quickly, which also causes the stroke to decrease.
Polymer “guest”
In this study, as in their previous work, Baughman and colleagues created their artificial muscle from a “forest” of CNTs all vertically aligned in the same direction. Next, they drew a thin sheet of nanotubes from the forest and twisted it to make a yarn containing helices of intertwined CNTs. In the final step, which was unique to this series of experiments, they coated the interior surfaces of the CNTs with an ionically conducting polymer that contains either positively or negatively charged chemical groups.
The first polymer “guest” material the group studied was poly(sodium 4-styrenesulphonate), PSS. The resulting structure is known as a PSS@CNT yarn and contains around 30 percent PSS by weight. To determine the zero-charge potential of this yarn – that is, the potential at which the stroke switches direction – the researchers used a technique called piezoelectrochemical spectroscopy, which they developed themselves. They then tested their yarns in baths of either aqueous or organic electrolytes.
Bipolar to unipolar
Baughman and colleagues, who report their work in Science, found that the polymer coating converts the normally bipolar actuation of CNT yarns into unipolar actuation. In other words, the coated muscle actuates in only one direction over the entire potential range at which the electrolyte remains stable.
The team’s explanation for this unusual behaviour is that the dipolar field of the polymer shifts the yarn’s zero-charge potential to a value that lies outside the electrolyte’s stability range. This means that ions of only one polarity (positive or negative) are driven into the yarn, explains team member Zhong Wang. Hence, the muscle’s stroke changes in only one direction before the direction of voltage change reverses. Team member Jiuke Mu adds that the number of electrolyte molecules that are electro-osmotically pumped into the muscle also increases the faster the potential is changed, or scanned, across its range.
As for the new unipolar muscles’ performance, the researchers found that the maximum average output mechanical power they generate is 2.9 W per gram of muscle. This is about 10 times the typical capability of human muscle, Mu says, and about 2.2 times the weight-normalized power capability of a turbocharged V-8 diesel engine.
Dual-electrode, all-solid-state yarn muscle
In the final stage of their research, the scientists demonstrated that they could combine two different types of unipolar yarn muscles to make a dual-electrode, all-solid-state yarn muscle, thereby dispensing with the need for a liquid electrolyte bath. Here, Wang explains that a solid-state electrolyte laterally interconnects two coiled CNT yarns containing different polymer guests – one with negatively-charged substituents, and the other with positively charged ones. The injection of positive and negative ions means that both yarns contribute to actuation during charging, Wang says. He suggests that such dual electrode unipolar muscles could, in the future, be woven together to make actuating textiles that “morph” in response to electrical stimuli.
Members of the team, which includes scientists from the University of Illinois at Urbana-Champaign, Changzhou University, Jiangsu University, the Harbin Institute of Technology, Hanyang University, Seoul National University, Deakin University, the University of Wollongong, Opus 12 and MilliporeSigma, now plan to exploit these muscles in robots and artificial limbs as well as textiles.
Researchers from Dartmouth have developed a method to convert a standard clinical linear accelerator (linac) used for radiation therapy to deliver a FLASH-capable, ultrahigh-dose rate (UHDR) radiotherapy beam. The process, which uses existing accessories, takes only 20 minutes to perform, or to reverse.
UHDR radiotherapy delivers radiation at dose rates that are hundreds, or even thousands, times higher than used in conventional treatments, leading to a phenomenon commonly referred to as the FLASH effect. Adapting a linac to deliver radiation at 300 Gy/s rather than 0.1 Gy/s enables treatment to be completed in 6 ms instead of 20 s. Crucially, preclinical research with laboratory animals has shown that these high dose rates significantly reduce toxicities to surrounding healthy tissue while maintaining anti-tumour activity.
“We believe this is the first reversible UHDR beam on a clinically used linac where the beam can be used in the conventional geometry where patients are on the treatment couch,” says Brian Pogue, of the Thayer School of Engineering and the Norris Cotton Cancer Center.
The team converted a Varian Clinac 2100 C/D to deliver UHDR electron beams using existing accessories including jaws, applicators and cutouts. The conversion was performed by setting the treatment console to “service mode” and manually resetting some key components of the treatment delivery system – the carousel, air valve and target – with the gantry angle set at 90 degrees to access these components.
Modifications (which could be completed within 20 minutes) included retracting the X-ray target and flattening filter from the beam’s path, positioning the carousel on an empty port and selecting 10 MV photon beam energy in the treatment console to deliver electron beams. To convert the linac back for conventional radiotherapy use, this process is simply reversed.
Following the conversion, the researchers used film and an optically stimulated luminescent dosimeter (OSLD) to measure dose-rate, surface and depth–dose profiles in solid water phantoms. They used a fast photomultiplier tube-based Cherenkov detector to measure per pulse beam output at a 2 ns sampling rate.
FLASH accomplished
Lead authors Mahbubur Rahman and Ramish Ashraf of the Thayer School of Engineering and colleagues report that the converted system could achieve dose rates of up to 290±5 Gy/s at the isocentre (100 cm source-to-surface distance), well above the reported 40 Gy/s threshold needed to potentially achieve the FLASH effect. The doses measured from simultaneous irradiation of film and OSLD agreed to within 1%. The radial symmetry of the beams was within 0.2% at 290 Gy/s. The Cherenkov detector showed that the linac required a ramp-up period for the first 4–6 pulses before the output stabilized to a stability within 3%.
Based on these findings, the researchers believe that with further tuning of the beam output and reduced source-to-surface distance, they could achieve dose rates of up to 600 Gy/s. The variability of the radiation dose from the first few pulses may require a dose monitoring and stopping system for future clinical translation studies, and upwards of 10 pulses may be needed when performing preclinical animal investigations. Work is underway to develop a low-cost translatable controller circuit that could be used with the converted linac.
The researchers are currently using the UHDR beam in preclinical studies on experimental animal tumours, as well as in clinical veterinary treatments. Murine studies are underway to examine the nature of the normal tissue sparing from radiation damage that the FLASH effect confers. Veterinary treatments to dogs with sarcoma tumours are being used to test out the ability to safely deliver this beam.
“Further oxygen consumption from the FLASH beam has been widely postulated to be one of the factors that could lead to the FLASH effect of normal tissue damage reduction, and so, in vivo studies of this effect are being completed,” Pogue tells Physics World.
“Additionally, radiation oncologists and dermatologists have joined the team to design a human safety clinical trial using FLASH radiotherapy to treat patients with advanced skin lesions that cannot be surgically removed,” he adds. “There are a number of advanced lesions where, because of poor perfusion or lesion location, surgical removal would not be ideal. These might be better treated by radiotherapy, especially if there is a slightly enhanced sparing of the normal skin from the FLASH effect. The team is planning for this future trial to evaluate the safety of UHDR delivery in human treatment.”
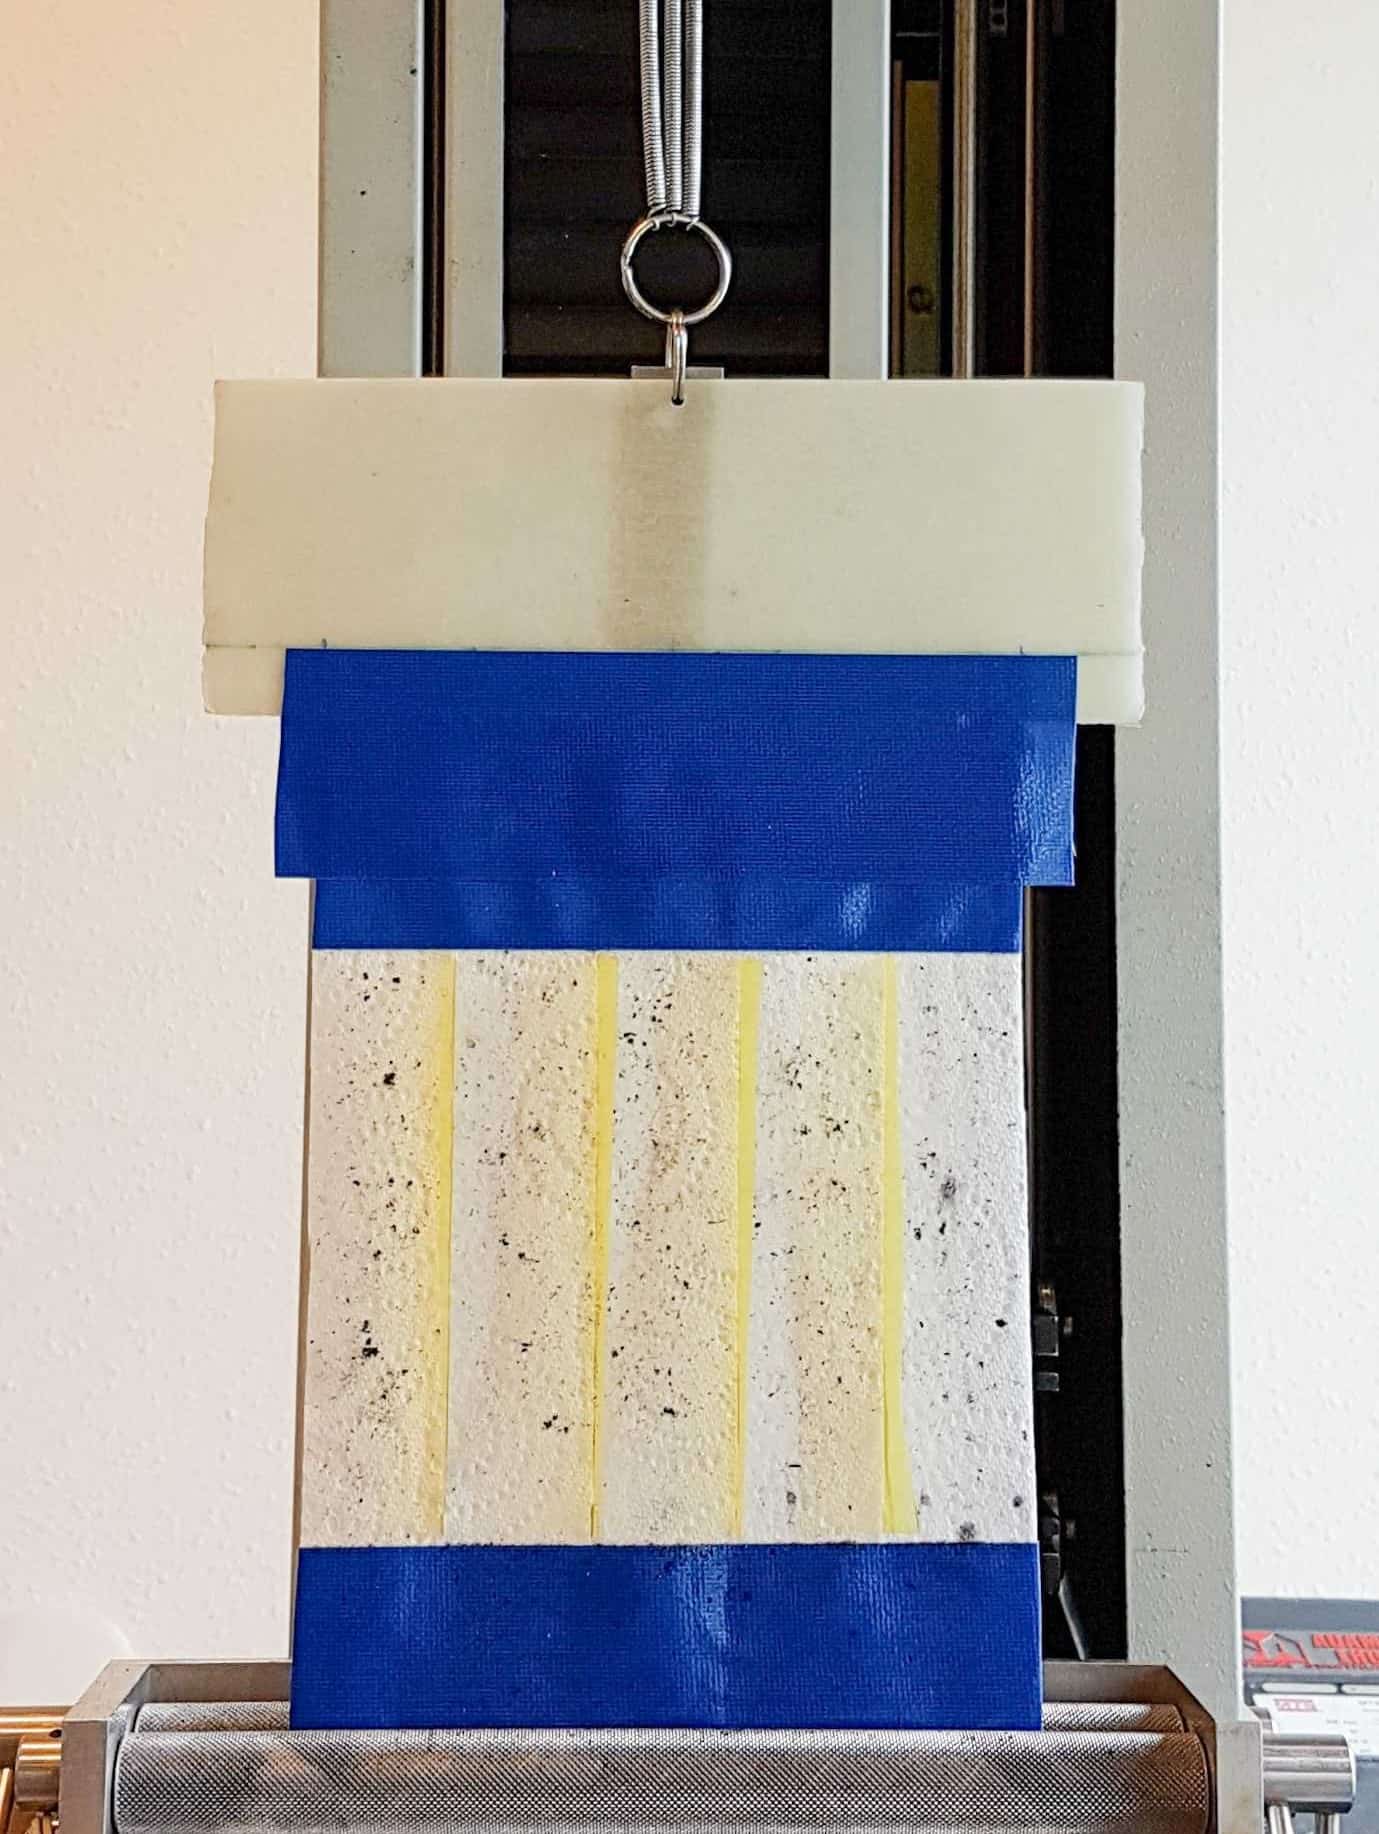
Seismic kitchen roll: photograph showing paper towel being stretched between an anchor (bottom) and springs (top). (Courtesy: Tzortzopoulos et al. / Geophysical Research Letters)
A seismic model based on kitchen roll (paper towels) has been used to show that the intensity of earthquakes can be reduced by at least a factor of ten by injecting fluid into the ground. Designed by researchers in France, the model could lead to proactive seismic interventions to reduce the risk of disasters and also help to guide the industrial projects involving underground fluid injection.
Earthquakes occur when elastic energy stored in the Earth’s crust is suddenly released by movement along a fault line. This motion can result naturally from a critical built up of tension or it can be triggered accidentally by the injection of fluids in the ground near a fault. The latter can occur during oil extraction, wastewater disposal or deep geothermal projects. Understanding the nature of such induced seismicity is key to mitigating risk.
In their study, geophysicist Ioannis Stefanou and colleagues at the Ecole Centrale de Nantes modelled a simple dip–slip fault by clamping kitchen roll – or, as the team calls it, “absorbent porous paper” – between an anchor and a spring. The spring is slowly stretched to increasing tension to the model system in a manner analogous to how the tension increases in a seismic system. When the tension is sufficient, the paper tears and the spring releases the equivalent amount of energy as a magnitude 5.9 earthquake, were the model scaled up represent a real, 6.5 km long fault.
Reduced friction
The paper is divided into strips, which the researchers used to represent segments of the fault each under the influence of a different injection well. On a real fault, the injection of pressurized fluids causes the apparent friction of the system to drop, with the potential to reactivate the fault and initiate slip. In the model, a comparable stress drop can be brought about by wetting the kitchen roll which causes the strength of the paper to reduce prior to failure.
“By progressively wetting the porous paper, we simulated fluid injections in the Earth’s crust. Each injection was accompanied by tremors, which progressively released energy and modified the energy budget of the system,” explains Stefanou. “Our experiments show that, without precise knowledge of the fault properties, we risk destabilizing the system and provoke a large seismic event,” he continued — noting the relevance to real-world fluid injection scenarios that could induce seismicity.
“However, he adds, “provided that the model’s key parameters – fault segmentation, segment-activation rate, and stress state – are well known or controlled, the natural rupture can be mitigated by at least one unit.” Mitigation of the fault’s stored energy via provoking small quakes was only possible, the team found, only when the stress state of the system was low enough at the start that the whole fault region was not reactivated.
Introducing heterogeneities
The concept could be adapted to mirror different types of fault configuration by changing the geometry of the paper samples, Stefanou said, as long as the scaling law connecting the physical model with the real-world system was updated as well. “Using, let’s say, tape or glue, one could introduce heterogeneities or reinforce and waterproof some parts of the samples,’ he explained. “This would change the local stress state, create permeability paths and give more options for new experiments.”
Stefan Nielsen, a seismologist at the University of Durham comments “One attractive feature of this model is that it allows to explain the physics of the process in an intuitive way, showing that the mathematics describing the reality and the laboratory are similar”. However, he cautions, there can be problems in translating laboratory observations to the real Earth.
“In this example, the tectonic loading increases until failure is reached, a process which takes hundreds of years in the real Earth. Fluid injection, on the other hand, would be almost instantaneous with respect to the tectonic loading time. In nature, a fluid injection would suddenly permeate a fault which is under a virtually constant state of load, instead of a gradually increasing load as in this model,” Nielsen explains.
Dramatic failure
“Therefore, on natural faults fluid injection may result in a much-increased risk of dramatic failure, unless the fault is caught in the early stages of the seismic loading cycle,’ he concludes.
The paper fault model is part of a larger project, funded by the European Research Council, to determine if it is possible to reliably control earthquake instability to minimize loss of life and economic disruption. “In my group we focus on proving (or disproving) mathematically the possibility of controlling the seismic slip,” Stefanou explained. “This is like designing a cruise control system for faults, but it is much more difficult than cars!”
Alongside laboratory-based tests with surrogate models, the team also work with computer simulations. Stefanou concluded: “Our results up to now are very promising and show us how fluids have to be injected in order to prevent earthquakes, even in the case of high stress level ratios.”
Ground-based astronomy remains at the forefront of our quest to understand more about the cosmos. While many celestial bodies in the night sky can be seen at visible wavelengths, the signal often becomes very faint by the time it reaches us here on Earth. Optical telescopes must therefore be equipped with light detectors that combine high sensitivity – converting as many incoming photons as possible into electrical measurements – with minimal noise.
For decades the detector-of-choice has been the charge-coupled device (CCD), which combines a quantum efficiency of more than 95% in the visible with low-noise operation. An important advantage of CCDs is that they are back-illuminated, which means that the photodiodes used to convert the incoming photons into photoelectrons are positioned in front of the electrical circuitry. This maximizes the area available for photon capture, and also allows efficient cooling from the back of the sensor to reduce the build up of thermal noise during long exposures – which can last for several minutes or even longer.
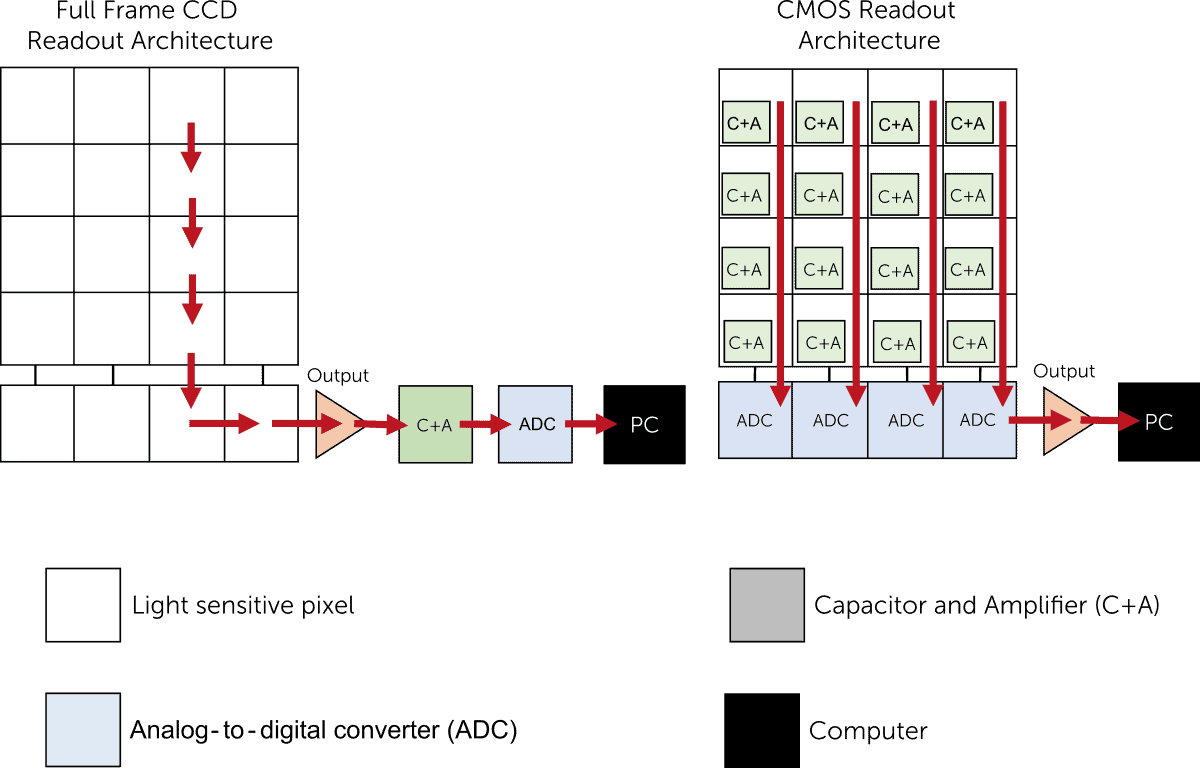
However, CCDs have significant limitations at faster time scales, which are increasingly needed to observe dynamic processes or to enable quick analysis for applications such as adaptive optics. “A CCD usually only has a single read-out node,” explains Jason McClure, chief technology officer of Teledyne Princeton Instruments. “At the end of every exposure the photoelectrons generated in each pixel must be shifted across the sensor to reach the read-out node, and this slows down the read-out speed.”
Faster read-out times can be achieved by measuring the photoelectrons collected together at the end of each exposure with high-speed analogue-to-digital convertors (ADCs), but these can introduce high levels of read noise. Even at high ADC rates, long read-out times are a particular problem for large-area detectors with lots of pixels (4k x 4k or greater), ranging from seconds to dozens of seconds.
Another issue for the full-frame CCDs typically used in astronomy are the mechanical shutters that are used to block out incoming light during readout. These mechanical shutters have finite lifetimes and need frequent replacement when the camera is in heavy use – which can be problematic for remote observatories where maintenance can be challenging. Additionally, opening and closing a mechanical shutter is relatively slow, reducing the frame rate and generating quantitative errors for shorter exposure times.
Some of these issues have been addressed through the introduction of electron-multiplying CCDs (EMCCDs), which use on-chip amplification to boost the signal relative to the read noise. EMCCDs are able to detect much weaker signals than traditional CCDs, and can also operate at the higher frame rates needed to capture the evolution of dynamic events.
What’s more, many EMCCDs are equipped with electronic shutters that are faster and more precise than mechanical versions. “Electronic shutters also reduce the dead time during which the camera is unable to detect any incoming light,” adds McClure. “EMCCDs shift the detected photoelectrons into a frame storage area at the end of each exposure, which allows the next exposure to start while the signal is being read out from the storage area.”
Despite the advantages of EMCCDs, the random nature of the on-chip amplification process generates excess noise that limits the overall sensitivity when imaging brighter objects, typically when the signal is larger than a few photons per pixel. Their complex gain response can also make it more difficult to obtain reliable quantitative measurements, which has limited their use for some astronomical applications – as discussed in more detail in the article “Types of Camera Sensor“.
Alternative visions
While CCDs remain the most popular technology for ground-based astronomy, image sensors based on traditional CMOS technology now offer a viable alternative. “CMOS image sensors have not generally been suitable for astronomy because they are front illuminated, and are both less sensitive and more noisy than CCDs,” says McClure. “But more advanced CMOS imaging chips are now emerging that rival the performance of CCD and EMCCDs, while also overcoming the common limitations of these technologies.”
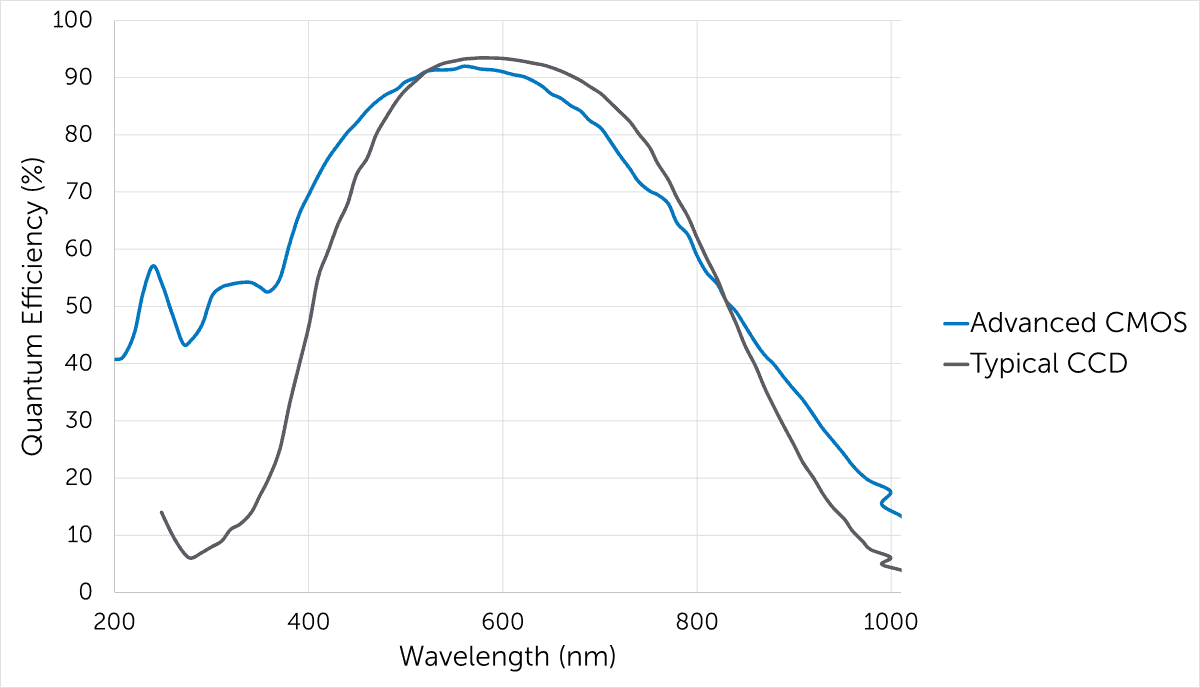
One of the big advances has been the introduction of back-illuminated CMOS sensors, which has increased the quantum efficiency to more than 90% in the visible range. Such CMOS designs are also more sensitive than a typical CCD at ultraviolet wavelengths, which makes them ideal for observations at multiple wavelengths.
Efficiency gains: A back-illuminated CMOS sensor almost matches the quantum efficiency of a CCD at visible wavelengths, and offers greater sensitivity in the ultraviolet. (Courtesy: Teledyne Princeton Instruments)
CMOS sensors are also able to process data at much higher speeds than CCDs, while maintaining low read noise and avoiding the excess random noise of EMCCDs. “CMOS designs have a parallel readout architecture,” explains McClure. “The charge-to-voltage conversion takes place at each individual pixel, allowing read-out nodes on every column of the sensor to operate simultaneously.”
Such high-speed operation makes CMOS designs ideal for large-area sensors, which allow more objects to be observed per frame for applications such as sky surveys. They also reduce the number of telescope movements needed to track rapidly moving objects, and enable improved image calibration by making it possible to record more reference stars.
Parallel speed: A full-frame CCD (left) shifts detected photoelectrons vertically down the sensor until they read the readout array, and then shifts them horizontally, pixel-by-pixel, until they are read out by an analogue-to-digital converter (ADC). In contrast, the CMOS architecture has an ADC at the end of each column, increasing the readout speed while maintaining a low read noise. (Courtesy: Teledyne Princeton Instruments)
According to McClure, CMOS cameras are now available with pixel counts of 6k x 6k and above, and with large pixel sizes of around 10 μm, to provide a large field of view. “They also offer high quantum efficiencies and low read noise for precise imaging of fainter, high-speed objects, or multiple fainter objects within one frame,” he adds.
CMOS imagers can also offer a wide dynamic range – which makes it possible to detect faint astronomical objects in the same field of view as brighter objects – without compromising on read-out speed. This is typically achieved by sampling the signal multiple times at high and low gain, but in many designs the high- and low-gain read-outs must be operated in different modes to keep the read noise down. This creates two different noise regimes, and when they are combined together artifacts emerge that often limit the precision of the measurements.
The solution in advanced CMOS designs, such as Teledyne Imaging’s LACera technology, is to improve the noise performance of the ADC. “Our patented dual ADC operates with very low read noise in high-gain mode, so we don’t have to crank up the gain to keep the read noise down,” explains McClure. “At this signal level our low-gain read-out is dominated by shot noise and you don’t see a stitching artifact at all.” The result, says McClure, is unsurpassed dynamic range at high frame rates, as described in more detail in Teledyne’s article “New Era in High Dynamic Range and Linearity for Scientific CMOS Cameras“.
CMOS sensors also have precise electronic shutters to enable continuous imaging without any loss of data. However, they typically exploit a rolling shutter – in which exposure and read-out progresses through the sensor one row at a time – instead of a global shutter, which reads and resets all the detector pixels at the same time. Although this rolling process is very fast, it can introduce distortions when imaging fast-moving objects as well as occasional delays between frames. Synchronization problems can also emerge that would be detrimental for many astronomy applications.
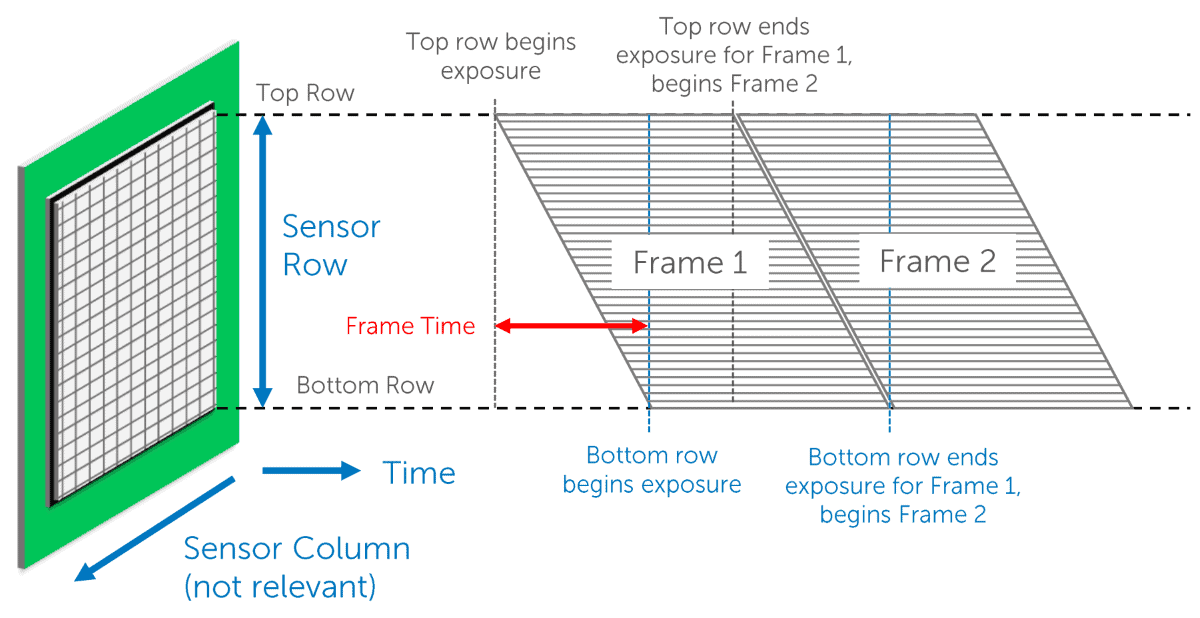
Progressive readout: in a rolling shutter, exposure and readout progresses from the top of the sensor to the bottom, rather than reading out all the pixels at the same time. The timescale of the rolling behaviour is the camera’s frame time, typically around 20 ms. (Courtesy: Teledyne Princeton Instruments)
However, it has proved challenging to engineer a global shutter for back-illuminated CMOS sensors because this mode of operation requires all the photoelectrons to be moved into a storage area as soon as the exposure ends. This storage area is typically light-sensitive, which means that interactions with any stray photons can introduce artefacts into the image. For front-illuminated CMOS sensors the storage area can be hidden under the sensor components, but this is more difficult to achieve with back-illuminated designs.
Teledyne Imaging has solved this problem in its LACera technology by redesigning the storage area to minimize its sensitivity to light when the shutter is closed. Described in more detail in the company’s article “Achieving a True Global Shutter with Large Format, Back-Illuminated CMOS“, McClure says that the new design dramatically reduces the parasitic light sensitivity and enables true global shutter operation with minimal artifacts.
“Although CCD and EMCCD technologies have their advantages for ground-based astronomy, back-illuminated CMOS sensors match their performance while overcoming their limitations on speed, duty cycle and noise performance,” concludes McClure. “CMOS designs, with their combination of high quantum efficiency, high dynamic range, short readout times and low noise, offer a competitive alternative for a wide range of astronomy applications.”
To find out more about the capabilities of advanced CMOS sensors in astronomy, sign up for the webinar Enabling the Next Generation of Astronomy hosted by Teledyne Princeton Instruments.
It’s now 10 years since Physics World published its first special report on China and since then scientific progress in the country has continued apace (as you can see from our latest China Briefing).
This week, for example, China’s Tianwen-1 spacecraft began its orbit around Mars, while exciting new data on dark matter emerged from the PandaX-II detector in the China Jinping Underground Laboratory.
But the last 12 months have been a difficult time for physicists in China – just as they have for researchers around the world – with disruptions to work and travel resulting from the COVID-19 pandemic.
To mark today’s start of Chinese New Year celebrations, IOP Publishing, which publishes Physics World, has created a short video about some of the support the company has been giving to researchers in China.
The video begins with publishing director Antonia Seymour, who will take over from Steven Hall as managing director of the company next month. She explains how IOP Publishing has helped give Chinese researchers access to articles and hosted webinars on topics such as biomedical materials, complex systems and materials for energy.
Together with the Chinese Physical Society and the China University of Science and Technology (USTC), IOP Publishing also hosted last year’s Quantum 2020 conference, which featured some big names from quantum physics in China. And now IOP Publishing has made its popular “Track my Article” service available on its official WeChat account.
Scan and go: this QR code gives access to IOP Publishing’s “Track My Article” service via its WeChat account.
The service, which can be accessed by scanning the QR code, lets researchers who have submitted papers to IOP journals track the status of their submissions. IOP Publishing’s WeChat account in addition provides news and publishing-related information for Chinese scientists.
As Chinese New Year gets under way to mark the switch from the year of the rat to the year of the ox, let’s hope life slowly returns to “normal” – whether you’re in China or anywhere else in the world.
If 2020 taught us anything, it was that humans are a very adaptable and tenacious species who can achieve incredible things by putting our minds to a problem. Not only did we prevent untold deaths by adapting our lives, we also developed and tested vaccines against a new and contagious virus, doing in less than 12 months something that normally takes 5–10 years to achieve. If only we can bring a similar vigour and urgency to tackling climate change.
Here in the UK, the government has already made clear what’s needed by recently publishing its “Ten Point Plan for a Green Industrial Revolution”. The policy paper lays out what I think is an inspiring vision to create a quarter of a million jobs with £12bn of government investment over the next 10 years. British prime minister Boris Johnson claims the plan will help the UK achieve its goal of “net zero” carbon emissions by 2050.
Climate change is an example of a “Pascal’s wager”
I’m pleased that the UK government has such a clear, visionary yet sensible plan. After all, as I mentioned last year, climate change is an example of a “Pascal’s wager”. That’s because even if you don’t think climate change is real, it makes sense to act as if you do. Doing nothing could be hellish (rising sea levels, mass extinctions, famines), but taking action could have untold benefits.
Planning ahead
The first point in the plan is about producing enough offshore wind capacity to power every home, quadrupling how much we produce to 40 GW by 2030. The second focuses on hydrogen, the aim being for the UK to have 5 GW of low-carbon hydrogen capacity by 2030 for industry, transport, power and housing, with the first town heated entirely by green-hydrogen by the end of the decade. The plan also looks at improving nuclear power as a clean energy source and developing the next generation of small and advanced reactors (both fission and fusion).
There is a focus on electric vehicles, clean public transport, cycling and walking. Cleaner aviation and greener maritime are in the plan too, as are making homes and public buildings more energy efficient by installing 600,000 heat pumps every year by 2028. The plan calls for the UK to become a world leader in carbon capture, with a target of removing 10 MT of carbon dioxide by 2030 and planting trees on 30,000 hectares of land every year.
Finally, the City of London should become the global centre for “green finance”, investing in the technologies to make these energy ambitions come true. Indeed, the outgoing business secretary Alok Sharma (who will now be president of the COP26 climate-change summit in Glasgow in November) thinks the plan could help to unlock up to £42bn of private investment by 2030 in the energy, construction, transport, innovation and environment sectors.
We need to develop more cost-effective carbon-free sources of energy
A physicist and long-time supporter of the IOP’s business-innovation awards, Sharma believes it will boost exports in low-carbon technologies, creating jobs and “reinvigorating our industrial heartlands”. Of course, writing a plan is easy; making it happen will be harder. But if there’s one thing we need to do for the plan to succeed it’s to develop more cost-effective carbon-free sources of energy.
I’m reminded of a speech given in 2018 by Greg Clark – one of Sharma’s predecessors as business secretary – in which he discussed the “trilemma” of electricity supply. That refers to the belief that electricity can be cheap and secure, cheap and low-carbon, or secure and low-carbon – but never all three at once. Clark, however, reckoned that green-energy sources would make the trade-off redundant by the mid-2020s.
Consider off-shore wind. It’s secure, at least in the UK, where we have plenty of coastline and doesn’t face the “not-in-my-backyard” opposition that bedevils onshore wind-power locations. It’s cheap too. According to the CarbonBrief.org website, offshore wind fell from £167/MWh in 2017 to £127/MWh in 2019 and is projected to drop to £44/MWh in 2023 – critically, that’s less than the projected costs of gas and solar (£50/MWh and £60/MWh, respectively).
Nuclear effort
Renewables are a “no brainer”. Of course, one challenge is that they’re not always “on”, which means we will either have to add storage capacity or rely on other carbon-free energy sources. That’s where nuclear is so vital. We need to put our fear of this source of energy behind us – the truth is that the technologies based on nuclear fission have come a long way in recent years.
Consider the UK’s Advanced Modular Reactor (AMR) programme, which supports companies developing safer alternatives to conventional fission plants. Rather than relying on pressurized- or boiling-water plants, the AMR instead focuses on stable salt reactors – advanced fuelling that prevents a meltdown. This latest iteration of AMRs could address many of the safety issues surrounding traditional nuclear plants and recently included an additional £170m in support.
Green technology and growth can go hand-in-hand
Of course, AMRs will succeed commercially only if they can bring down nuclear’s cost from its current high of around £100/MWh. The programme even includes extra money for fusion – the holy grail of clean energy – with Sharma calling for the UK to be a “trailblazer” in this field by “capitalizing on its incredible potential as a limitless clean-energy source that could last for generations to come.” Fortunately, the UK is already a leader in fusion technology.
The UK Atomic Energy Authority boasts the recently upgraded MAST reactor as well as the Joint European Torus. The UK is still, post-Brexit, part of the ITER fusion experiment being built in France. The plan also reaffirms the UK’s commitment to the STEP programme, which seeks to build a prototype tokamak-based fusion plant in the UK by the early 2040s. Britain even has several burgeoning private fusion firms, including Tokamak Energy UK, First Light Fusion, Crossfield Fusion and Pulsar Fusion.
Green technology and growth can go hand-in-hand and I believe that, with sufficient focus, the UK can meet its net-zero-carbon goal by 2050 and thereby tackle the most enduring threat to our planet. For physicists, it’s an exciting time.
Tiles made of metamaterials could make ground-based telescopes far more sensitive to the cosmic microwave background radiation that forms the “afterglow” of the Big Bang. The polyurethane-and-carbon tiles, which work by sharply reducing the reflection and scattering of stray light, are now being installed in the millimetre-wave telescopes at Simons Observatory in Chile and could also be incorporated into upgrades at other facilities.
The cosmic microwave background (CMB) is the remnant of electromagnetic radiation released around 380 000 years after the Big Bang, when nuclei and electrons first combined to form atoms and space became transparent to light. The Simons Observatory is designed to measure directional variations, or anisotropies, in the polarization of this radiation. Evidence for certain types of anisotropies would strongly support the theory of cosmic inflation, which states that the universe underwent a period of extremely rapid expansion just 10-35 s after the Big Bang, increasing its volume by a factor of up to 108 within a fraction of a second.
Controlling stray light at cryogenic temperatures
The detectors in modern ground-based millimetre-wave telescopes like ones at the Simons Observatory operate at cryogenic temperatures, which enhances their sensitivity by reducing their intrinsic thermal or electronic noise. Over the past few decades, detector technology has advanced far enough that thermal noise is now less of a limiting factor than noise from stray light. This light, which reflects off the side walls of the cryogenically-cooled detectors instead of following the main optical path in the devices, can degrade the image the detector produces through effects known as “ghosting” and “glinting”, as well as reducing the detector’s overall sensitivity.
To control this stray light, telescope designers need materials that absorb millimetre wavelengths at the ultralow operating temperatures of the telescope’s detectors. Finding such materials has proved challenging because most materials developed for cryogenic temperatures have high indices of refraction, and therefore reflect and scatter significant amounts of light. Meanwhile, lower-refractive-index materials, such as those found in commercial microwave absorbers, cannot easily be employed in cryogenic environments.
Wedge-shaped modular tiles
A team led by Jeff McMahon at the University of Chicago and Mark Devlin at the University of Pennsylvaniasupported by the Simons Foundation has now developed a way of controlling stray light using a wedge-shaped tile made from a microwave-absorbing metamaterial. Metamaterials are artificially engineered structures that can be designed in ways that give them properties – such as a negative refractive index – that are rare or nonexistant in natural materials.
The new metamaterial is based on carbon particles loaded with 25% polyurethane by mass. While the bulk of this composite efficiently absorbs light in the microwave region, its surface is highly reflective, so the researchers coated it with an antireflective pyramidal-shaped structure.
When combined with the bulk material, which absorbs almost all incoming photons, this antireflective surface makes the metamaterial tiles highly efficient at suppressing signals from stray light, say study lead authors Zhilei Xu and Grace Chesmore. The tiles’ optical properties remain intact at cryogenic temperatures just above absolute zero.
The researchers made their tiles using injecting moulding, a low-cost technique that easily scales up for mass production. The tiles’ modular nature also means that, unlike conventional painted surfaces, any damage can be fixed simply by replacing the affected tiles. While the shape of the tiles is tailored to the geometry of the Simons Observatory, other geometries, such as flat square tiles, are also possible and would exhibit similar optical performance, the researchers say.
In this episode of the Physics World Weekly podcast we meet physicist Jennifer Rieser who has just moved from the Georgia Institute of Technology to Emory University, where she studies how snakes use tiny structures on their undersides to help propel themselves. Rieser talks about her recent research that suggests that microscopic pits on the bellies of sidewinder snakes help the reptiles achieve their sidewinding motion.
Also on hand is Arpad Horvath of the University of California, Berkeley who is founding editor-in-chief of the new journal Environmental Research: Infrastructure and Sustainability. He chats about the challenges of designing infrastructure that is environmentally sustainable. He also talks about the scope of the new journal and his plans for its future.
This podcast is sponsored by Teledyne Princeton Instruments. To learn more about how the company is changing scientific astronomy sign up to their astronomy webinar at princetoninstruments.com/webinars