Parkinson’s disease, a progressive disorder of the nervous system, affects more than six million people worldwide. It is characterized by symptoms including slowness of movement, rigidity and tremor. A new study from researchers in Spain and the USA suggests that focused ultrasound could be beneficial for patients with asymmetric Parkinson’s disease, in which symptoms are much more severe on one side of the body.
Focused ultrasound is an emerging therapy that offers a minimally invasive alternative to traditional surgical approaches. It works by focusing multiple ultrasound beams onto targets deep within the body, with MRI used to monitor and guide the procedure in real time. The focused sonic energy at the target point can be used to destroy unwanted tissue or interrupt faulty brain circuits.
In a randomized, double-blinded trial, the study team – from Centro Intregral de Neurociencias and the University of Virginia Health Sciences Center (UVA Health) – evaluated the use of focused ultrasound in 40 patients with Parkinson’s disease. All had symptoms not fully controlled by medication or were ineligible for deep-brain stimulation, the main type of surgery used to treat Parkinson’s.
The researchers assigned 27 participants to receive focused ultrasound, while 13 others underwent a sham delivery procedure. The focused ultrasound was targeted onto the subthalamic nucleus in the patients’ brains, on the side opposite to their main motor signs. The subthalamic nucleus is the neurosurgical target usually used for deep-brain stimulation treatments. In this trial, focused ultrasound was used instead to create the therapeutic lesions.
The study assessed participants’ motor symptoms before and after the procedure on a scale of 1–44 (using the Movement Disorder Society–Unified Parkinson’s Disease Rating Scale motor score), with higher scores indicating greater impairment. In the group treated with focused ultrasound, the mean score for the more affected side decreased from 19.9 at baseline to 9.9 at four months. In the control group, the score changed from 18.7 to 17.1.
“This small brain region, the subthalamic nucleus, had a very strong and potent effect on parkinsonian symptoms when we targeted it with precise, focused ultrasound energy,” says Jeff Elias, a neurosurgeon at UVA Health.
Elias notes that clinical adoption of this focused ultrasound procedure will require further technology refinements to ensure reliability and safety. With this in mind, the researchers examined the safety of the new approach by assessing procedure-related complications four months after treatment. Side effects in the active-treatment group included involuntary muscle movements, muscle weakness on the treated side, and speech and gait disturbances. In most cases, these were temporary, but in six patients, some effects persisted a year later.
I recently went on a canal holiday, drifting on a hired narrowboat through the pretty Staffordshire countryside. Travelling by canal is the fastest way to slow down, they say, because the sedate pace, tranquillity and wildlife all give you time to think. As I meandered past factories, potteries and mines, I started to reflect on the Industrial Revolution and the reasons why the British canal network was built.
From today’s perspective, canals seem cataclysmically slow – you’re limited to a top speed of four miles per hour and it takes about 20 minutes to get through a lock. But back in the 18th century canals were a spectacular breakthrough, allowing companies to move raw materials and goods at low cost. A single horse could tow a boat with 50 times as much cargo as it could pull by cart.
The canal heyday didn’t last. Soon came steam engines and railways, which were much faster. They in turn were usurped by cars, lorries and trucks, with the road network providing an even faster, cheaper and more convenient way of delivering goods and services, driving productivity and economic growth. But every mode of transport – even canals – faced initial opposition to their creation, routing and impact.
I’ve read articles about web-server data centres, such as those used by Google and Facebook, being blamed for 2% of greenhouse-gas emissions, which is about the same as air travel. The BBC website even had a recent story suggesting we should send fewer e-mails to “save the planet”, though it added it won’t make much difference as the infrastructure to send e-mails – your laptop, the WiFi and the network itself – are all “on” anyway.
20% of the world’s total electricity consumption may be used by the Internet by 2025. Some may find this appalling, but to me, it’s absolutely fine
The beauty of e-mails is they are so quick and cheap. In the UK it costs 85 pence to post a letter (plus envelope, paper and the effort to get to the post box) whereas an e-mail costs almost nothing (and has a lower environmental impact) and doesn’t take two days to arrive. Of course, when something is nearly free, people consume more of it. Known as the Jevons paradox, it was first applied in the 1800s to coal, but communications are price-elastic too.
According to a recent report from KTH Royal Institute of Technology in Sweden, about 10% of the world’s total electricity consumption is currently used by the Internet. The figure has risen from 8% in 2012 and may reach 20% by 2025. Some may find this appalling, but to me, it’s absolutely fine. The Internet, after all, is driving the next step in productivity and economic growth plus it underpins carbon reduction across the economy. And don’t forget that if all of us drove electric vehicles, we’d need twice as much electricity as now.
Even data centres – those buildings filled with servers and hard disks that are the physical manifestation of cloud computing – are doing a good job. Yes, they require lots of energy: a large centre typically consumes more than 30 GWh per year and has an annual £3m electricity bill – roughly 60% of its running costs. But the operators are therefore laser-focused on energy efficiency. What’s more, over 75% of energy used by the UK’s 450 commercial data centres is certified 100% renewable.
So-called “hyperscale” data centres, which emerged when firms like Facebook, Amazon and Google needed fleets of a quarter of a million servers or more, led to Facebook founding the Open Compute Project in 2011 to share hardware and software solutions to make computing more energy-efficient. The member firms (there are about 200 today) realized it made no sense to use off-the-shelf hardware. Instead, they developed “bare-bones” servers, in which video hardware and connectors were stripped out (as no display was needed) and blinking lights were removed (there was no-one to look at them).
The best “hyperscale” data centres have whittled their power usage efficiency (PUE) down to about 1.2
So whereas conventional data centres have a power usage efficiency (PUE) – total energy needed divided by energy for computing – of 2.0, the best hyperscale facilities have whittled this figure down to about 1.2. Google even boasts a PUE score of 1.12 on average for all its centres, which is not far off a perfect 1.0. Improvements in cooling technology have helped too: Facebook’s Lulea data centre near the Arctic Circle in Sweden uses outside air for cooling and runs on hydroelectric power.
Facebook, Google, Apple and others have all committed to using 100% renewable energy (though rivals such as Baidu, Tencent and Alibaba have not). Indeed, Google is the world’s largest corporate purchaser of renewable energy (and carbon neutral since 2007) and pledges to be carbon free by 2030. Microsoft has even promised, by 2050, to have removed from the environment all the carbon it has directly emitted or consumed since it was founded in 1975.
Greenpeace IT analyst Gary Cook paints a less rosy picture, saying that only about 20% of the electricity used in the world’s data centres is so far renewable, with 80% of the power still coming from fossil fuels. That may be so, but given that Internet companies are so focused on efficiency and pay more to have clean electricity (and deliver carbon-reduction services) we need to do a lot more to make electricity carbon free in the first place. That – and not headlines about cat videos warming the planet – is where the focus should be.
An anti-reflective coating applied to some newer satellites in SpaceX’s Starlink constellation reduces their overall reflectivity by half but is less effective at certain wavelengths – meaning that ground-based astronomical observations are still being impaired by satellites passing through the telescope’s field of view. That is the finding of Takashi Horiuchi and colleagues at the National Astronomical Observatory of Japan, who used the 1.05 m Murikabushi Telescope at the Ishigakijima Astronomical Observatory (IAO) to determine the brightness of the so-called “DarkSat” model at different wavelengths.
SpaceX launched the first 60 small satellites in its planned 12,000-satellite Starlink constellation on 24 May 2019. The intent is that these satellites will work alongside ground-based receivers to create a global broadband network, with the humanitarian aim of making the Internet accessible for people throughout the world. However, low Earth orbit satellites like the ones in Starlink often appear as streaks in astronomical images taken from Earth-based telescopes, and astronomers’ concerns were heightened when the new satellites proved to be brighter than 99% of the approximately 200 artificial objects that were previously visible with the naked eye.
In response, the third round of 60 Starlink satellites, which SpaceX launched on 7 January 2020, included some satellites with a special anti-reflective dark coating. The IAO astronomers set out to compare the reflectivity of this modified satellite with the “standard” STARLINK-1113 version using the Murikabushi scope’s MITSuME system, which allows for simultaneous observations in the green, red and near-infrared bands. They also compared the brightness of reflected sunlight from the satellites to the known brightness of nearby reference stars.
The results, Horiuchi says, were mixed. “The darkening paint on DarkSat certainly halves reflection of sunlight compared to the ordinary Starlink satellites, but [the constellation’s] negative impact on astronomical observations still remains,” he says. Horiuchi adds that while the mitigating effect is “good in the UV/optical region” of the spectrum, “the black coating raises the surface temperature of DarkSat and affects intermediate infrared observations”.
Putting a visor on it
Starlink’s more recent launches, in June and August 2020, featured yet a third type of satellite. The newly developed “Visorsat” model has eaves to further mitigate its reflectivity and these are expected to be more effective than the coating on DarkSat. However, Horiuchi suggests that it would also be a good idea to raise the operating altitude of the Starlink satellites. Satellites in a rival constellation operated by OneWeb are darker, he notes, because their orbital altitude is higher, at 1200 km.
“We think it is important to discuss with the astronomical community of ground-based observations and proceed with the necessary verification when such a problem occurs or is expected,” he says. While astronomers hope that Visorsat will be less bright than its predecessors, Horiuchi suggests that discovering the implications and determining the best mitigation techniques for current and future missions will require researchers, the public and SpaceX to work together. “Dark skies with beautiful stars and nebulae are the treasure for all people in the world,” he says. “Astronomers need to communicate with the public towards keeping the shared treasure.”
A new multi-layered topological insulator has enabled researchers in the US to achieve fast, highly efficient currents of electrons with no energy loss. Cui-Zu Chang and colleagues at Pennsylvania State University say they have exploited the quantum anomalous Hall (QAH) effect to create a “multi-lane highway’ for electrons, in which the current can be finely tuned. Through further improvements, their design could lead to new advances in quantum computing and small-scale electronic circuits.
First observed experimentally in 2013, the QAH effect is a key feature of some topological insulators – materials that are electrical insulators in the bulk, but excellent conductors on their surfaces or edges. Specifically, the effect is relevant for 2D topological insulators doped with magnetic impurities. Even in the absence of magnetic fields, electrons in these materials will flow in one direction along the edge of a sample, with virtually no energy dissipated as heat. This property is analogous to a divided highway where traffic flows freely in both directions on opposite sides of the road. Recently, physicists have been keen on using this effect to increase the speed and efficiency of information transfer in electronic circuits. Because this free flow could preserve quantum information encoded in electrons, the QAH effect could prove useful for use in future quantum computers.
Chang’s team created a stack of QAH insulators, containing alternating layers of magnetic and undoped non-magnetic topological insulators. Their aim was to increase their material’s “Chern number”: a value defining the number of channels along the edge of a sample that are fully topologically protected. While the Chern number of a conventional QAH insulator is one, the researchers achieved a value of five in their new design. Rather than a simple road, this structure was comparable to a multi-lane highway, where electrons could flow along five separate channels in each direction.
Fine tuning
Having demonstrated this effect, Chang and colleagues also showed how the Chern numbers of QAH insulators can be tuned – either by varying the doping concentration of the magnetic layers or changing the thicknesses of the insulating layers. Despite these modifications, the team was able to maintain zero energy dissipation along each edge channel, even with high amounts of electron traffic.
A shortcoming of the current design is that devices must be chilled to near absolute zero, precluding practical applications. The team is now developing more advanced materials that could operate at higher temperatures. They are also looking at ways to tune the Chern number in real time. If these efforts are achieved, multi-layered QAH insulators could find uses in areas including high-capacity, small-scale electronics. The materials could even be used in future quantum computers where electrons are used to transfer quantum information along numerous different channels.
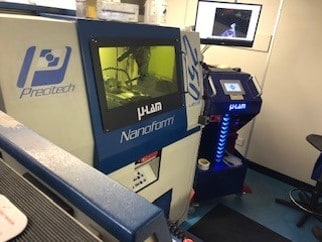
Innovative optical design and high-precision component manufacturing are at the heart of a UK industry collaboration that’s seeking to address the pervasive problem of edge corrosion in fabricated steel products – and in particular the steel plates destined for use in heavy-duty construction equipment such as excavators, dumpsters, backhoe loaders and the like. The EDGETECT2 R&D consortium, which is funded to the tune of £1 million by Innovate UK, the UK innovation agency, will action the findings from a previous feasibility study to develop next-generation optical components that are able to “fine-tune” the materials-processing capabilities of the high-power CO2 lasers and fibre lasers used for cutting and fabrication of high-added-value steel parts.
While that’s the technology end-game, the enabling materials science presents some considerable challenges for the EDGETECT2 project team. The application of paints and other anti-corrosion coatings over sharp steel edges typically results in the protective film pulling away during drying and curing – a phenomenon rooted in surface-tension effects. This, in turn, can lead to inadequate corrosion protection and rusting of the underlying steel surface, and especially so in the harsh conditions common to all construction sites.
Despite this effect being a well-known issue within the coatings industry, the commercial reality is that most laser-cutting processes are built for speed and throughput, resulting in highly sharp edges on processed steel plate. What’s more, no in-line technique exists to produce an edge geometry optimized for final coating, while manual edge-dressing processes are often too costly and time-consuming for the production environment.
From design to manufacture
The answer to this conundrum, it seems, may lie in a new class of dual-focus zinc-selenide (ZnSe) lenses being co-developed by two of the EDGETECT2 partners: LBP Optics and its parent company ULO Optics, a diversified UK optical components group specializing in the design and manufacture of infrared laser optics, thermal imaging optics and beam-delivery systems. The hope is that the ZnSe lenses, which represent a new addition to the LBP Optics product portfolio, will ultimately be incorporated into industrial laser systems to yield a cutting process that generates rounded edges in finished steel plates, such that the paint layer will be more even and retain an enhanced thickness at those edges.
“We work regularly with customers at the forefront of technology in their respective industries – from laser system OEMs to military, defence and aerospace contractors,” says Graham Allberrey, diamond turning consultant at LBP Optics. “To support the EDGETECT2 consortium, we are leveraging our recent investment in a state-of-the-art laser-assisted diamond-machining tool – one of only two such machines in the UK – so that we can achieve extended tool life on crystals such as zinc selenide and zinc sulphide, also cut materials such as fused silica that are otherwise unmachinable.”
Working alongside the two optics vendors in the EDGETECT2 collaboration are a global manufacturer of construction equipment and four other industry partners: Ultrasonic Cleaning Systems, which specializes in the preparation of cut steels prior to painting; Valspar Powder Coatings, an industrial paint and coatings manufacturer; Laser Expertise, a UK laser cutting and fabrication firm; and TWI, an independent research organization that focuses on engineering, materials and joining technologies.
Optical engineering
Twelve months into the EDGETECT2 work programme, which runs until April 2022, Allberrey and his team at LBP Optics have just delivered the first batch of prototype dual-focus ZnSe lenses. The components are based on a v1.0 design conceived by Nick Ellis, technical director at ULO Optics, and comprise a central portion of the optic shaped as per a conventional spherical lens to get the laser beam to a cutting focus. Meanwhile, the outer radial region of the lens incorporates a so-called “axicon”, a shallow conical surface to create a low-power, ring-shaped beam pattern intended to soften the edge of the cut steel.
Precision engineering: the LBP Optics facility in Stevenage, UK, houses seven diamond-machining systems, including two full CNC machines and a state-of-the-art laser-assisted diamond-machining unit. (Courtesy: LBP Optics)
Evaluation of the lenses is taking place on an R&D CO2 laser system at Laser Expertise. “This is a first-pass lens design and we’re expecting one or two more iterations at least,” says Ellis. “The lens will change the shape of the focused laser beam to divert some energy away from the main cutting area. Our hope is that this clever optical manipulation will soften the adjacent material and create a more rounded edge profile.”
In parallel, work is underway to develop a similar dual-focus lens for integration into a fibre-laser cutting system – in this case, to replace the optical window that’s used to prevent workpiece backspatter damaging the laser’s expensive optical subsystems. The material of choice in this application is fused silica, another exceptionally tricky substrate that will require the specialist capability of LBP’s laser-assisted diamond-machining tool. “We think the optical physics will be pretty much the same for both the CO2 and fibre laser systems, so if we get this dual-focus lens optimized for one laser technology we expect to be able to get it working on the other,” adds Ellis.
While EDGETECT2 is focused very much at the industry sharp-end, Allberrey points out that ULO Optics and LBP Optics also serve a diverse base of scientific customers carrying out applied optics R&D in a university setting. “EDGETECT2 is a great example of how we collaborate closely with all of our customers – industrial and academic – from the outset of a project,” he concludes. “We can machine a wide range of complex shapes to an extremely high degree of accuracy, such as the cylinders, torics and aspheric lenses that are being used more frequently in advanced laser systems.”
Diamond machining: a core competency
After years of collaboration, LBP Optics purchased the Stevenage-based diamond-machining specialist Symons Mirror Technology (SMT) in August 2019.
The SMT acquisition means that, in addition to its established range of industrial and scientific mirrors, LBP Optics is now able to produce a broader portfolio of advanced optics with extreme precision (including cylindrical, spherical, ellipsoidal, toroidal, polygons, pyramids, aspherics and infrared domes).
The LBP Optics Stevenage facility houses seven diamond-machining systems, including two full CNC machines capable of removing material from a range of substrates to create freeform optical surfaces (i.e. non-symmetric along any axis).
Production capability also includes a state-of-the-art laser-assisted diamond-machining unit, in which a CO2 laser beam is focused just beyond the diamond tool tip to soften the substrate material and make it more “plastic” (resulting in less shear as the diamond cuts and minimizing subsurface damage in the optical material).
Typical specifications (material-dependent): surface roughness, 5 nm; surface accuracy, λ/4 at 633 nm over 100 mm diameter; roundness, 0.1 micron; angle accuracy, 2 seconds of arc.
Non-alcoholic fatty liver disease (NAFLD) affects over one billion people worldwide. However, patients are typically asymptomatic in the early stages of the disease. This means that NAFLD often remains undetected until it progresses to non-alcoholic steatohepatitis (NASH), a far more aggressive condition that can ultimately lead to liver failure.
While NASH causes permanent liver damage, NAFLD is treatable through lifestyle changes and medication. Creating a diagnostic test that allows for widespread screening could help to identify those at risk of NASH before the damage is too severe.
Researchers from Massachusetts Institute of Technology have developed a portable nuclear magnetic resonance (NMR) sensor that grades liver tissue according to its fat content. Described in Nature Biomedical Engineering, the device tracks water as it diffuses through the liver. The rate of diffusion reveals how much fat is present in the organ, providing a quantitative metric of NAFLD, even in the early stages of disease progression.
Using NMR as a predictor for fatty liver disease
A healthy liver stores little to no fat. By contrast, NAFLD is characterized by abnormal fat retention within liver cells, or steatosis.
Excessive steatosis may trigger NASH, causing inflammation and fibrosis (scarring). The severity of fibrosis can be measured using a biopsy, but this is highly invasive and ineffective if a non-fibrotic portion of the liver is tested.
The single-sided sensor, just 7 kg in weight and small enough to fit on a table, is capable of performing localized magnetic resonance measurements on live mice. (Courtesy: Nat. Biomed. Eng. 10.1038/s41551-020-00638-0)
An alternative approach, and the method used by Michael Cima and his team, is to evaluate the progression of NAFLD using NMR. NMR is particularly sensitive to changes in tissue composition caused by steatosis and fibrosis. The compact sensor created by the researchers looks to combine the diagnostic power of traditional (but bulky) MRI scanners with the portability needed for routine NAFLD/NASH screening.
The researchers use a technique called diffusion-weighted multicomponent T2 relaxometry to monitor the magnetic properties of water – specifically its 1H atoms – as it diffuses through the liver. When a sample is placed on the surface of the sensor, the proton spins align with the remote magnetic field generated by the permanent magnet. The protons are subsequently knocked out of alignment using a specific radiofrequency pulse sequence and the resulting transverse magnetization is recorded by the transceiver coil.
This magnetization decays as the water diffuses through the sample. How quickly this relaxation occurs depends upon the degree of steatosis and scarring – water diffuses more slowly through fatty, fibrotic tissue.
Using multiexponential fitting to process the decay signal, the researchers can correlate the relaxation time with the amount of fat contained within the sample.
Potential for point-of-care diagnostics
When testing the sensor in vivo in a diet-induced mouse model for NAFLD, the researchers reported a steatosis grading accuracy of 87%. The results demonstrate how, in principle, the sensor could be used to track the progression of NAFLD to NASH. The team also tested their method on human liver samples and were able to grade steatosis with 93% accuracy.
Currently, the model is limited to a penetration depth of 6 mm. To enable non-invasive imaging of patients, changes to the geometrical design of the sensor are needed. Such changes must, however, be made without compromising the portability, the team warn.
The implications of using the sensor in patients could go beyond staging the onset of NAFLD and NASH. “Having this type of diagnostic available could also aid in drug development efforts, because it could allow doctors to more easily identify patients with fibrosis and monitor their response to new treatments,” says Cima.
The observation of tiny deviations in the arrival times of radio pulses from neutron stars could be our first glimpse at gravitational waves from merging supermassive black holes – according to astronomers working on the NANOGrav pulsar timing array. The team has scoured 12.5 years of data from two radio telescopes for evidence of gravitational waves created by the mergers of large numbers of pairs of supermassive black holes throughout the history of the universe. Although this preliminary observation is far from conclusive, the astronomers are encouraged by the result and believe that the existence of a cosmic gravitational-wave background could soon be confirmed by observing more pulsars over longer periods of time.
Supermassive black holes are found at the centres of most galaxies – including the Milky Way – and have masses that are millions or even billions times that of the Sun. As galaxies evolve and merge, supermassive black holes can orbit each other and eventually merge – broadcasting gravitational waves. These mergers contribute to the cosmic gravitational-wave background, which is believed to be a noise-like cacophony of waves that permeates the universe.
Measuring this background would provide astronomers with a wealth of information about how galaxies form and evolve. However, the very low frequency gravitational waves from supermassive mergers cannot be detected with the existing LIGO–Virgo gravitational wave observatories.
Celestial clocks
Fortunately, millisecond pulsars offer a way of probing these gravitational waves. Pulsars are rapidly rotating neutron stars that beam pulses of radiation towards Earth. Their pulse frequencies are extremely stable – indeed, they act as “celestial clocks” with stabilities that rival that of atomic clocks.
The NANOGrav pulsar timing array monitors signals from 45 different pulsars in different locations in the sky. If a gravitational wave travels between Earth and a pulsar (or vice versa), the distance between us and the pulsar will expand and contract slightly. Pulses travel at the speed of light, so during the contraction pulses will arrive on Earth sooner than expected, whereas during the expansion pulses will arrive later.
This arrival-time deviation is dependent upon the angle between the direction to the pulsar and the direction of travel of the gravitational wave. So, a comparison of arrival times from an array of different pulsars should reveal the effect of gravitational waves. Measuring this effect, however, is very difficult because the deviations are on the order of a few hundred nanoseconds and occur over timescales of years.
On the curve
A powerful way of searching for this effect is to measure correlations between the arrival times of pulses from pairs of pulsars. When plotted as a function of the angle between the pulsars, the result is the “Hellings–Downs curve”. This curve is independent of the direction of the gravitational waves so it can be used to look for evidence for the cosmic gravitational-wave background – which should include waves travelling in all directions.
Radio signals from the 45 pulsars were observed for 12.5 years using the Arecibo Observatory in Puerto Rico (which has since shutdown) and the Green Bank Telescope in West Virginia. After doing an extensive statistical analysis of the data, the NANOGrav team found tantalizing preliminary evidence something is affecting the arrival times from different pulsars.
“These enticing first hints of a gravitational-wave background suggest that supermassive black holes likely do merge and that we are bobbing in a sea of gravitational waves rippling from supermassive black hole mergers in galaxies across the universe,” says NANOGrav member Julie Comerford at the University of Colorado Boulder.
However, the team is not yet able to conclude that the observed effect is the result of the cosmic gravitational-wave background. In particular, the team was unable to establish correlations between pairs of pulsars.
“We’ve found a strong signal in our dataset, but we can’t say yet that this is the gravitational wave background,” says NANOGrav’s Joseph Simon, who is also in at Boulder.
Scott Ransom at the US’s National Radio Astronomy Observatory adds, “Trying to detect gravitational waves with a pulsar timing array requires patience. We’re currently analyzing over a dozen years of data, but a definitive detection will likely take a couple more. It’s great that these new results are exactly what we would expect to see as we creep closer to a detection.”
It’s eerily quiet on the main CERN site on the outskirts of Meyrin near Geneva, Switzerland. Only a few hundred people are present, a fraction of the 7500 who would usually be here. But today – Tuesday 21 April 2020 – is not normal at all. It’s the first time I’ve been back on site since CERN brought in COVID-related restrictions 40 days ago. I don’t plan to stay for long: I just want to collect 20 hexagonal printed-circuit boards (PCBs) that a company in Taiwan has manufactured and delivered to my office.
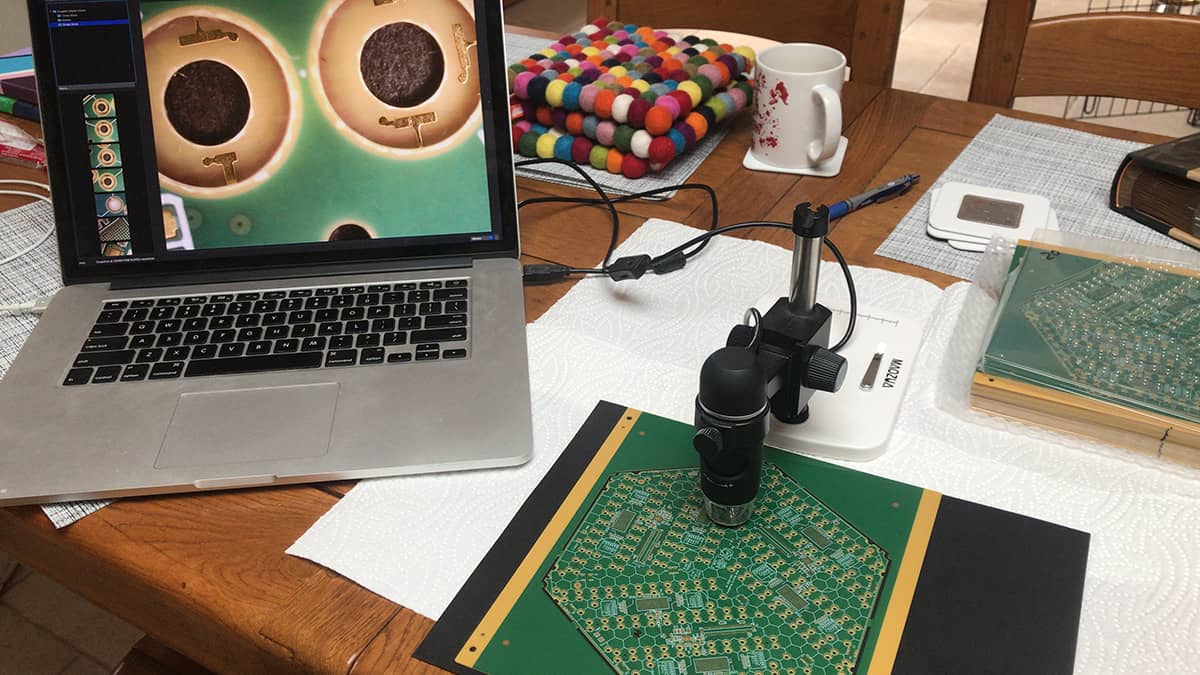
When I get back home, I’ll visually inspect the PCBs before sending them to a nearby firm to solder various components, including a custom-designed, radiation-tolerant prototype readout chip called HGCROC. We have a limited number of these HGCROC chips so before committing to soldering them (an irreversible process) I need to be sure the PCBs are all in order. I’ve therefore set up a makeshift lab on my dinner table, where a simple microscope is connected to my computer via USB (figure 1).
I need to look at fine details, such as the quality of the gold plating on regions that will have wires bonded for connection to silicon sensors, as well as macroscopic qualities such as the flatness of the boards. The microscope is a far cry from the professional equipment I normally use at CERN. But like all physicists, the COVID-19 pandemic has forced me to improvise and adapt. In fact, CERN’s staff, students and users have been as active as ever during the lockdown; we’re just not all in the same place at the same time.
1 CERN at home The simple home set-up used by Dave Barney in April 2020 during the COVID-19 lockdown to examine 20 new hexagonal printed circuit boards as part of the project to develop new calorimeters for the Compact Muon Solenoid (CMS) experiment on CERN’s High-Luminosity Large Hadron Collider (HL-LHC). The boards will eventually be glued to silicon sensors, electrically connected by wires running from gold pads on the boards (two of which are shown on his laptop) to the sensors. (Courtesy: Dave Barney)
Teleworking has become the temporary norm for most of us. Provided we’ve got good network connections, we can carry on doing design, simulation and data analysis. Many people have also been busy developing software and firmware (code semi-permanently written into an electronic component’s memory), testing their efforts remotely on equipment back in the lab. This work has required some people to come in to CERN from time to time to keep the infrastructure safe and operational, and to reset hardware when necessary – an activity I’ve been organizing for the Compact Muon Solenoid (CMS) experiment during the pandemic
Calorimeter challenge
But back to those 20 cm-wide hexagonal PCBs. They’re first-of-their-kind prototypes, designed to read out signals from novel hexagonal silicon sensors onto which they will be glued. Eventually around 30,000 similar PCBs, and their associated silicon sensors, will be required for a device called the High-Granularity Calorimeter (HGCAL). Set to replace the two “endcap” calorimeters of the CMS – one of the four giant experiments on the Large Hadron Collider (LHC) – the HGCAL will be installed during the third long shutdown of the LHC in 2026/27 (see box “The Large Hadron Collider: still going strong“).
The new calorimeter is possibly the most challenging engineering project in particle physics to date, although the same could have been said about the existing CMS – and its companion detectors ATLAS, LHCb and ALICE – when they were being developed more than 20 years ago. Indeed, the LHC has been pushing the boundaries of detector technology for decades – and will continue to do so for at least the next 20 years. That’s because its detectors are always evolving, with components being regularly replaced or added.
When I began working on CMS as a CERN fellow back in 1994, the LHC and its experiments were expected to operate for about 15 years, starting from around 2005. However, CERN’s decision to upgrade the collider to form the High-Luminosity LHC (HL-LHC) will not only extend the facility’s lifetime until the late 2030s but also let it produce up to five times as many collisions per second as now. That’s great for physics but, in practical terms, the huge increase in collision rate will lead to more complex collisions and more radiation. CMS’s endcap calorimeters would simply be unable to cope.
Coping strategy
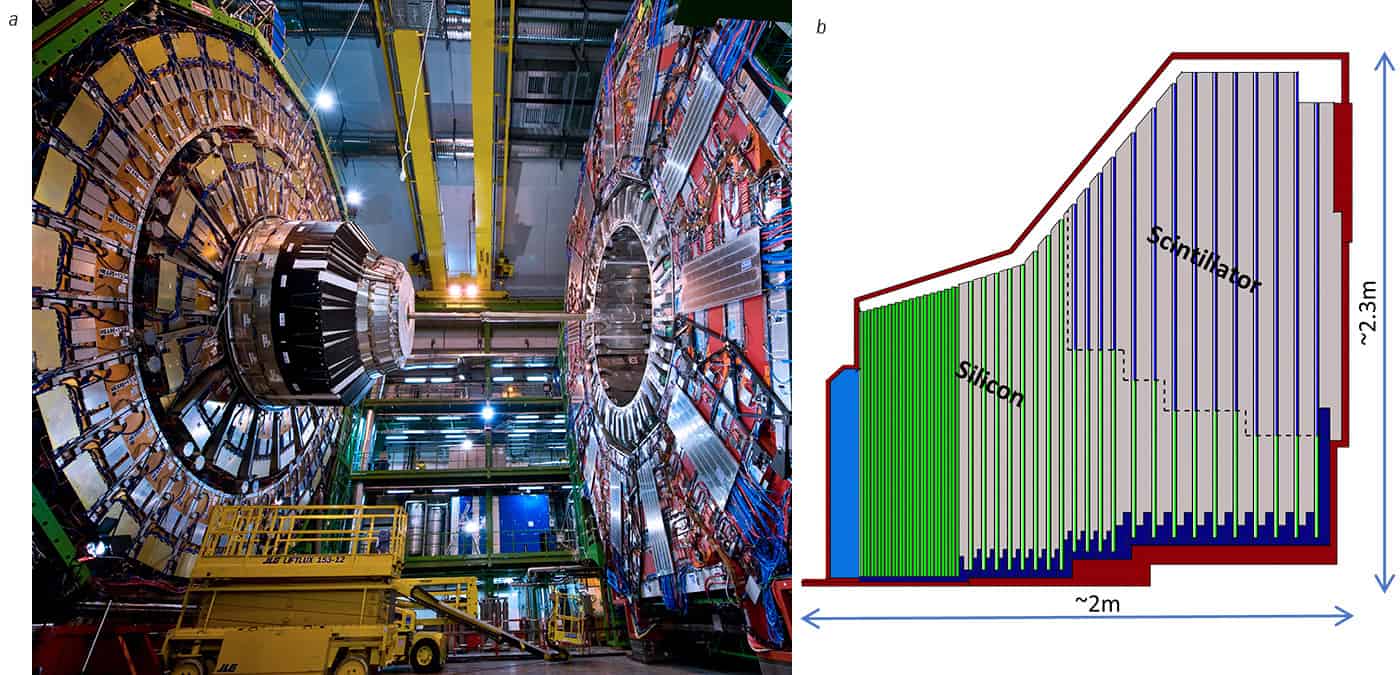
Take CMS’s electromagnetic calorimeter (ECAL), which – along with a separate, hadronic calorimeter – makes up each endcap calorimeter (figure 2). Measuring the energies of photons, electrons and positrons with incredible precision, ECAL is made of transparent lead-tungstate crystals that do two things. First, being so dense, they cause incident particles to deposit energy – mainly through bremsstrahlung and pair-production – and thereby create a shower of secondary particles. Second, they scintillate, producing light in proportion to the number of particles in the shower , with the light detected by devices glued to the ends of the crystals. Dubbed a “homogeneous” calorimeter because it combines both functions in a single material, ECAL has been invaluable to the success of CMS.
Trouble is, lead-tungstate crystals lose their transparency when heavily irradiated, which reduces the amount of light that CMS can detect. How much radiation the crystals receive depends on where they are in CMS. In the central, “barrel” section, the radiation is relatively low and the light loss will be manageable so the crystals will still be used in the HL-LHC. But in in the endcaps, there will be so much radiation that the crystals would go completely dark if retained in the upgraded collider, reducing the amount of light CMS can detect to virtually zero.
2 A new future for the CMS a The CMS detector on the Large Hadron Collider (LHC) includes two “endcaps” – one at either end of a central “barrel section. Each endcap has two calorimeters: an electromagnetic calorimeter followed by a hadronic calorimeter. b To survive the huge amounts of radiation created when the LHC is upgraded, both calorimeters will be replaced by the High-Granularity Calorimeter (HGCAL). This transverse slice through the upper half of one HGCAL endcap reveals its 50 detector layers, with silicon (green) in the regions of highest radiation and scintillator (purple) in the regions of lower radiation. The metal layers in between (grey) produce particle showers. (Courtesy: CERN)
We therefore need to replace the endcap lead-tungstate crystals with something that can withstand the deluge of radiation in the HL-LHC. The situation is very similar for CMS’s other calorimeter: the hadron calorimeter. It measures the energies of protons, neutrons, pions and other quark-filled particles from the light emitted when they strike plastic scintillator tiles, which will also darken with radiation to a point that they simply cannot be used. Again, the barrel part of the HCAL will be fine, but the endcaps need to be replaced
But there’s another issue that people working on CMS need to think about, which is that the HL-LHC will achieve more collisions per second than the LHC by increasing the number of protons per bunch. In fact, when the bunches collide we can expect up to 200 almost-simultaneous collisions (compared to about 40 today). Every “image” that CMS takes of collisions will therefore be more complex, meaning we’ll need detectors that are much more granular – a bit like upgrading the camera on your phone to have more pixels to get sharper pictures. The crystals we currently use in the endcaps have a cross-sectional area of about 3 cm by 3 cm, which are too coarse to distinguish closely spaced particles from complex HL-LHC collisions. What’s worse, there is just one layer of crystals so we gain no “longitudinal” information on how the showers develop (which can help to distinguish different particle types).
Any replacement calorimeter therefore needs two things. It has to be resistant to radiation and it has to have good transverse/longitudinal granularity. Unlike the existing ECAL, what the new HGCAL will do is to separate the particle-shower-creating and the signal-producing functions by having alternating layers of dense materials (for the former) and detection layers (for the latter). Known as a “sampling calorimeter”, HGCAL will have 50 layers of fine-grained sensors in each endcap, made up of a total of about 600 m2 of hexagonal silicon sensors in the higher-radiation regions and 400 m2 of trapezoidal plastic scintillator in the lower-radiation regions.
The silicon sensors will be divided into individual hexagonal “pixels” with areas of either 0.5 cm2 or 1.0 cm2, with the finer granularity being used in the most challenging areas. The scintillating tiles, in contrast, will have lateral dimensions of a few centimetres. Despite being coarser than some particle detectors, such as the “trackers” that trace the trajectories of charged particles, this granularity is unprecedented for a calorimeter. Indeed, the HGCAL will be the most granular calorimeter ever made in high-energy physics. Thanks to the many layers – and the high granularity in each – we’ll be able to disentangle the complexities of HL-LHC collisions.
Integration, integration, integration
These active elements will, of course, need advanced electronics, such as the hexagonal PCBs I mentioned above, plus more than 400 tonnes of copper, lead, tungsten-copper alloy and steel to produce the particle showers. We’ll have to cool the detectors to –30 °C by sending liquid carbon dioxide down pipes embedded in the copper, which will remove more than 100 kJ of heat generated by the electronics every second in each endcap. We’ll need control and read-out functions. And with HGCAL having to fit into a volume of just 60 m3 split equally between the two endcaps, it’s clear that integrating all the components is perhaps the biggest challenge that the HGCAL team faces.
It will be worth it though as each of the HGCAL’s 50 layers will produce detailed 5D images of particle showers and interactions (the three spatial dimensions, plus energy and timing). The timing information will be particularly valuable: with about 200 proton–proton collisions occurring whenever proton bunches in the HL-LHC cross, the collisions will be less than 100 picoseconds apart. So knowing precisely when they hit the HGCAL will let us disentangle particles from different collisions. If, for example, four electrons are seen by CMS in one crossing, they could have been produced by four separate collisions (essentially background noise) or by just one (possibly from a Higgs-boson decay).
Until now, this timing information was not needed at the LHC, but the collisions in the HL-LHC will be so complex that we need to do everything we can to extract the signal from the noise. We’ll also need new software tools, many of which will be based on pattern-recognition and machine-learning algorithms. With the new hardware and software in place, CMS will be able, for many years, to make further precision measurements of rare phenomena, and to discover new phenomena within reach of the HL-LHC.
The Large Hadron Collider: still going strong
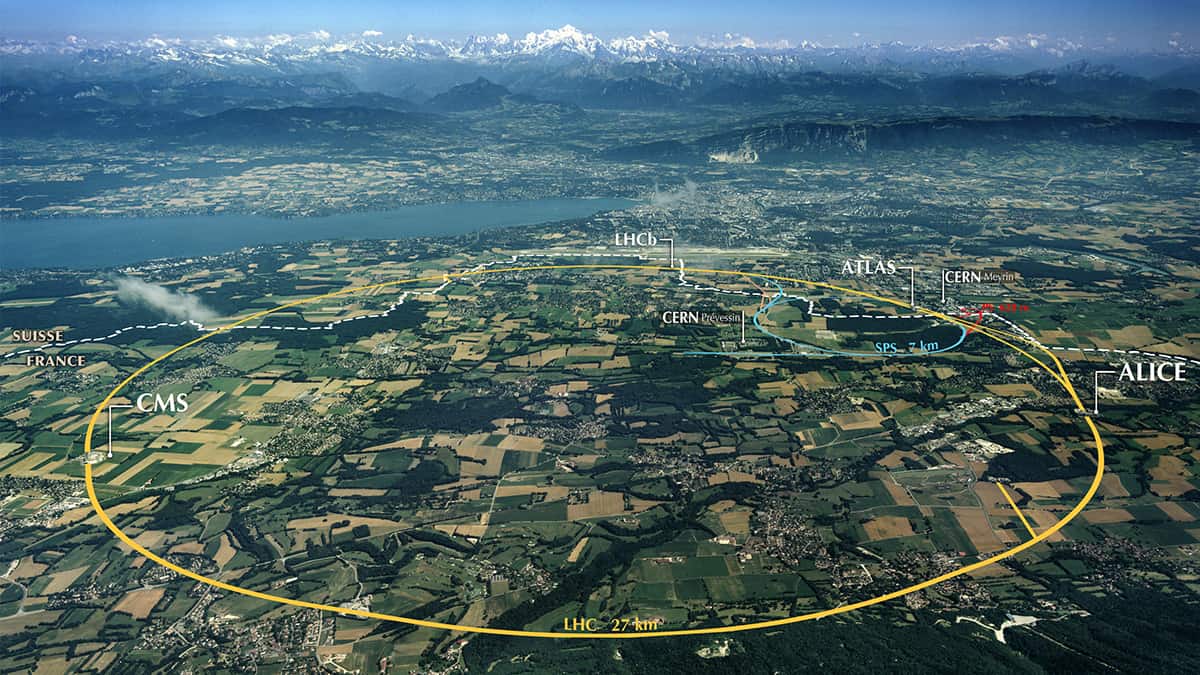
Ring of success Overlooked by the Alps – including Mont Blanc – the Large Hadron Collider (LHC) lies mostly in France, but also crosses the border into Switzerland. Its proton beams collide inside four detectors – ALICE, ATLAS, LHCb and CMS – which are all around 100 m underground (as is the LHC itself). The LHC’s upgrade – the High-Luminosity LHC – is set to begin operating in 2027. (Courtesy: CERN)
The main “tool” for the physicists who work for or visit CERN is the largest and most powerful particle accelerator ever made: the Large Hadron Collider (LHC). It accelerates nearly 3000 bunches of protons (each with about 10 billion protons) to nearly the speed of light in a circular ring 27 km in circumference. Bunches travel in both clockwise and anti-clockwise directions before colliding once every 25 nanoseconds at four locations around the ring.
The LHC is around 100 m below ground and the collision points are the locations of the four giant particle detectors installed in excavated caverns. It’s been running almost continuously for the past decade apart from year-end stops and two long shutdowns. We’re currently in the middle of the second long shutdown, which is due to finish at the end of 2021 and physicists are still analysing data from the three quadrillion (3 × 10¹⁶) proton–proton collisions that the LHC has produced since 2010. Those collisions included signs of Higgs bosons, the discovery of which led to Peter Higgs and François Englert winning the 2013 Nobel Prize for Physics.
Only a few tens of Higgs bosons had been seen when their discovery was announced in 2012 but many more have been observed since then, letting us explore its properties and how it fits into the Standard Model of particle physics. Many other fundamental physical processes have also been studied and, although no signs of “new physics” beyond the Standard Model have been seen, we know much better where not to look for them. Still, it’s getting ever harder to explore the remaining regions of the particle landscape, which is why we need even more collisions.
The LHC will continue operating until the end of 2024, by which time we should have doubled the number of collisions produced so far. But to help in the hunt for new physics, plans are under way to boost the “luminosity” of the LHC – the number of collisions per second – five-fold. This so-called “High-Luminosity LHC” will come online after the third long shutdown in 2026/7, with the upgraded machine set to run until nearly 2040.
The future is bright
Back at my dinner table, most of the PCBs look good, but a few have minor imperfections – which is normal for prototypes of this kind. I send the good boards off for component assembly and when they arrive back at CERN in July, I join some colleagues to set up a customized measuring system that can be operated remotely (figure 3). In typical CERN fashion, we’re a mix of nationalities (British, French, German, Pakistani, Portuguese and Turkish), disciplines (from physics to electronic engineering) and ages (from students to experienced staff).
Functional and performance tests on the PCBs are ongoing but they seem to be working fine. We’re also examining a “full” hexagonal silicon module, comprising a silicon sensor and a previous variant of the hexagonal PCB glued together and stuck onto a tungsten-copper alloy baseplate. Aluminium wires, 50 μm in diameter, are ultrasonically welded to the PCB’s gold pads and to metallic regions of the silicon, connecting them together. Signals from the silicon (created by charged particles passing through) are transmitted by the wires to the PCB and on to the radiation-resistant HGCROC chips. Designed by our colleagues from the Omega group in Paris, the chips amplify, digitize and transmit the signals to the outside world.
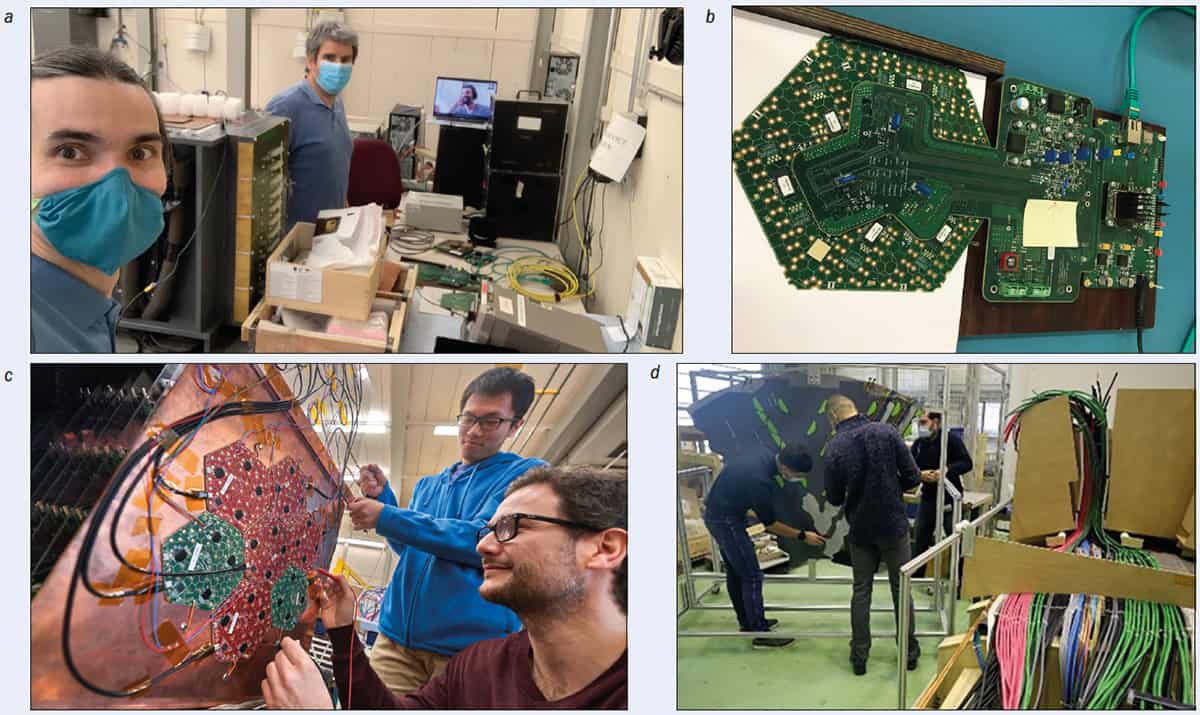
3 Building the CMS’s new calorimetera CERN physicists André David (left) and Dave Barney setting up the test system for the printed circuit boards for the HGCAL detector, with Arnaud Steen from National Taiwan University, connected remotely. b The test system connected to one of the hexagonal printed circuit boards, with the labelled chips on it the HGCROC readout chips. c Hao-Ren Jheng (left), who was then a master’s student at National Central University in Taiwan, and CERN fellow Bora Akgun (right) testing previous-generation hexagonal silicon modules before they were put in particle beams at CERN in 2018. d Karol Rapacz, Harry Perkins and Thomas French – all CERN engineers – working on full-scale mock-ups of parts of HGCAL to understand how the giant jigsaw puzzle of detector modules and their services can fit together in reality. One is a “wedge” containing many hexagonal modules – in this case 3D-printed versions that are being used to route services inside the detector and to understand the complexities and difficulties involved, particularly at the edges of the HGCAL where many cables and fibres overlap. The other mockup (right) shows the larger cables that will feed into the HGCAL in an attempt to understand how they will fit into the available space and interact with other parts of CMS. (Courtesy: CERN)
One of the best ways of testing that the modules perform as we expect is to put them into particle beams, to mimic the conditions of LHC collisions as closely as possible. Indeed, in 2018 we tested 100 such modules in beams of muons, positrons and pions from CERN’s Super Proton Synchrotron (SPS), with excellent results. When such beams aren’t available (and there are none at CERN until later in 2021), we can instead use the signals from high-energy cosmic rays, amplified by the HGCROC and measured by a dedicated test stand. Although the rate of these cosmic rays is small (barely one leaves a signal per square centimetre of silicon per minute), they’re on tap 24 hours a day so we can acquire statistics to measure performance such as the signal-to-noise ratio.
This extensive development and testing of the silicon-sensor modules is just a part of the HGCAL design work that will be required before we move to full production in 2022. Large-scale assembly will begin in 2024 while the HGCAL will be installed in CMS in 2026/27. In fact, if the silicon modules (and their scintillator equivalents) are the “sensory organs” of the HGCAL, the “circulatory” and “nervous” systems – the copper power cables and the optical fibres for controlling and reading the sensors – will be even more challenging.
Many of the ancillary electronics required to make all this work – such as radiation-resistant optical transceivers and high-efficiency DC/DC converters – are being developed by a CERN-led consortium. They will not only be used in the HGCAL but also in other parts of CMS and in the other HL-LHC experiments too. Fitting all the components into place will be a real puzzle for electronic and mechanical engineers given that, in terms of the density and complexity of components, each endcap of the HGCAL is like a 250 tonne, 30 m3 smartphone.
There is also the “brain” of the HGCAL to consider. This is the system of custom-designed electronics and software that will control the detector and process its data. As with all CMS detectors, much of this equipment will be physically near the HGCAL, but in a separate underground cavern. It needs to be close, as the system must decide very quickly – within about 10 microseconds – if something interesting has taken place. If that’s the case, and the data pass further tests, we store them to disc for subsequent, full-scale analysis; if not, the data are discarded forever. Again, much of the electronics is based on common platforms wherever possible, sharing design resources amongst many groups, for the benefit of many systems.
Over the last few years, we’ve made huge progress evaluating the performance of the HGCAL and proving its feasibility. A rigorous and regular review process, with independent referees, ensures that no stone goes unturned and nothing is forgotten. Detailed milestones for everything from the electronics and the mechanics to the safety systems keep the project on schedule and within budget. Despite COVID-19, the reviews have continued and have been “passed” successfully.
But we can’t relax. There’s still a lot more work before we can start mass-producing all the components, assembling them into sub-units, building larger modules (or “cassettes”) from them, adding services and then installing everything into the full-scale detector, before installing it into the CMS in around 2026. Then, of course, there’s the small matter of having to commission HGCAL and run it for 10–15 years.
The final frontier
It’s now 14 July 2020 – Bastille Day in France. I’m back at CERN, sitting on the terrace outside the main restaurant. Normally we’d expect around 300 summer students at CERN right now, but this year the programme has been cancelled due to the pandemic, though some are taking part remotely. I myself was a CERN summer student 30 years ago, arriving in Geneva after studying physics at Imperial College London in the UK. It was an incredible experience – and a few of that year’s students have gone on to play important roles in CMS, past and present.
Karl Gill – who came to CERN from Imperial at about the same time as me and with whom I was an undergraduate and PhD student – is now HGCAL’s project manager. Then there is Luca Malgeri, an Italian physicist who’s currently CMS spokesperson. And most importantly to me there’s my wife Jane Barney – a physicist who helped develop the ECAL crystals in use today in CMS as part of her PhD. I met her on this very terrace when we were summer students and we got married a few years later.
With so many great people, some amazing technological challenges and exciting new physics around the corner, life at CERN is never boring. The pandemic has certainly been challenging over the last year, but we’ve overcome those hurdles by changing and adapting how we work.
The HGCAL has been pushing technological and social boundaries, and for me, building detectors and seeing them work in such extreme conditions has been a thrill and a pleasure.
Vanadium-doped titanium dioxide nanospindles used in combination with ultrasound can destroy cancer cells. (Courtesy: Liang Cheng)
Sonodynamic therapy (SDT) is a promising, non-invasive cancer treatment that uses ultrasound to activate sonosensitizers, which in turn generate reactive oxygen species (ROS) that attack and destroy tumour cells. Researchers from Soochow University in China have developed a new type of sonosensitizer that enhances the amount of damage than SDT can inflict upon tumours without harming normal tissue. Writing in Applied Physics Reviews, they describe how the new sonosensitizer can suppress the growth of human breast cancer tumour cells in mice.
The new sonosensitizer is based on vanadium-doped titanium dioxide (V-TiO2) nanospindles. While TiO2 has been used in the past as a sensitizer, it does not work well because it has a wide band gap in its electronic structure. This causes electrons stripped away by ultrasound to rapidly recombine with the nanoparticles, preventing the generation of ROS. The researchers determined that if they doped the TiO2 nanoparticles with vanadium to form nano-sized spindles, this would reduce the band gap, thus increasing the efficiency of ultrasound-triggered ROS production.
Lead author Xianwen Wang and colleagues also determined that vanadium doping causes the nanospindles to act like tiny enzymes that catalyse the generation of highly toxic hydroxyl radicals from hydrogen peroxide contained within the tumour. This provides an additional method of killing the cancer cells, via chemodynamic therapy. Additionally, they report that the nanospindles cause glutathione depletion, which further increases the oxidative stress generated by the chemodynamic–sonodynamic therapy.
The researchers created high-quality V-TiO2 nanospindles and then coated them with polyethylene glycol to create V-TiO2-PEG nanospindles with good water solubility. Following initial testing, they assessed the cytotoxicity of the nanospindles using both non-cancerous human umbilical endothelial vein cells and breast cancer cells. They confirmed that the V-TiO2-PEG nanospindles exhibited no obvious cytotoxicity to the non-cancerous cells but that the viability of the cancerous cells decreased with increasing nanospindle concentration.
The team next examined the therapeutic efficacy of the nanospindles in the cancer cells and in vivo in tumour-bearing mice. The mice were divided into five groups, which received: no treatment (control group); ultrasound irradiation; injection of V-TiO2-PEG nanospindles; injection of commercial TiO2 nanoparticles plus ultrasound; and injection of V-TiO2-PEG nanospindles plus ultrasound.
Tumours in the control group grew rapidly, while the nanospindle-only and the ultrasound-only groups experienced moderate tumour growth suppression. Tumour growth in mice receiving nanoparticles/nanospindles plus ultrasound was markedly suppressed, with the most severe tumour damage and necrosis seen in animals receiving V-TiO2-PEG nanospindles plus ultrasound. ROS staining revealed that tumour sections in this latter group exhibited the strongest fluorescence, indicating that V-TiO2-PEG nanospindles plus ultrasound irradiation generated more ROS in tumour tissues than nanospindles or ultrasound alone.
The researchers identified V-TiO2-PEG nanospindles in the spleen and liver of the mice and, later, in the animals’ faeces and urine. They did not detect any obvious signs of organ inflammation or damage. “It is worth noting that the V-TiO2 nanospindles are rapidly excreted from the body,” comments co-author Liang Cheng. “This helps prevent any possible long-term toxicity effects.”
“Our all-in-one nano-platform based on V-TiO2 nanospindles with tumour microenvironment modulating properties enhances sonodynamic therapy against cancer,” conclude the researchers.
Entangled pairs of photons have been used by physicists in Germany and Austria to image structures beneath the surfaces of materials that scatter light. The research was led by Aron Vanselow and Sven Ramelow at Humboldt University of Berlin and achieved high-resolution images of the samples using “ultra-broadband” photon pairs with very different wavelengths. One photon probed the sample, while the other read out image information. Their compact, low-cost and non-destructive system could be put to work inspecting advanced ceramics and mixing in fluids.
Optical coherence tomography (OCT) is a powerful tool for imaging structures beneath the surfaces of translucent materials and has a number of applications including the 3D scanning of biological tissues. The technique uses interferometry to reject the majority of light that has scattered many times in an object, focussing instead on the rare instances when light only scatters once from a feature of interest. This usually involves probing the material with visible or near-infrared light, which can be easily produced and detected. Yet in some materials such as ceramics, paints, and micro-porous samples, visible and near-infrared light is strongly scattered – which limits the use of OCT. Mid-infrared light, however, can penetrate deeper into these samples without scattering – but this light is far more difficult to produce and detect.
Vanselow, Ramelow and colleagues circumvented this problem by using pairs of quantum-mechanically entangled photons in which one photon is mid-infrared and the other is either visible or near-infrared. The entangled pairs are generated by firing a “pump” laser beam at a specialized nonlinear crystal developed by the team. This creates entangled pairs of photons – one mid-infrared “idler” photon and one visible/near-infrared “signal” photon.
Idler photons
The nonlinear crystal sits in an interferometer and in one arm of the interferometer, the light is split so the idler photon strikes the object to be imaged whereas the signal photon is reflected by a mirror. The other arm of the interferometer has a detector that measures the signal photons. Because the two photons are entangled, information about the idler photon (and hence the object) can be gleaned from a measurement on the reference photon. This information is used to create an image of the object.
The team tested the performance of their imaging system using samples that included paint layers and alumina ceramic stacks etched with microchannels. They produced both 2D and 3D images of the samples, down to microscale resolutions. Altogether, this improved the signal-to-noise ratio of conventional mid-infrared OCT by a factor of one million. This agreed with the team’s theoretical prediction for their setup’s best possible performance – meaning it was only limited by intrinsic quantum noise.
According to the team, the technology could be used to see inside materials inaccessible to other non-destructive techniques. Applications could include studies of alumina-based ceramics, which are used for drug testing and DNA detection, owing to the well-defined sizes and high densities of their pores. Elsewhere, the updated form of OCT could be used to make real-time images of microscale mixing in liquids, precisely engineered 3D-printed ceramics, and quality control for pharmaceutical coatings.