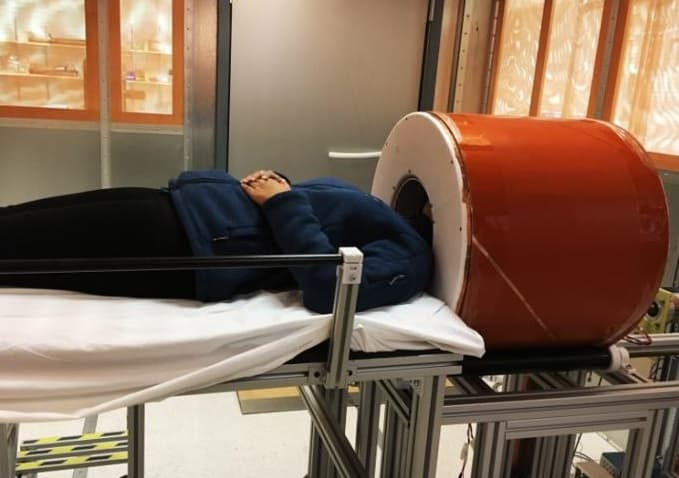
Cancer patients undergoing radiotherapy at Dartmouth-Hitchcock Medical Center are receiving added treatment scrutiny, via real-time monitoring of the radiation dose delivered during their treatments. This treatment verification is enabled by a Cherenkov imaging system, which provides real-time visualization of each radiation beam.
Cherenkov imaging is a novel technique that captures light emissions during radiotherapy. The Cherenkov effect occurs when photon or electron beams interact with tissue, generating light that shows the shape of the treatment beam on the skin’s surface. The intensity of this light is in proportion to the delivered dose. The BeamSite Cherenkov imaging system, developed by DoseOptics, uses time-gating technology to ensure that each linac pulse contributes to the image. Time-integrating software creates images that are overlaid in real time on the patient, providing surrogate maps of surface dose.
These dose maps can be used to visually verify treatment field delivery and patient positioning throughout each treatment fraction. This is not possible using standard quality assurance (QA) measures, according to the research team from the Geisel School of Medicine and Dartmouth Engineering, who developed, validated and commercialized the system.
The Dartmouth team, led by Lesley Jarvis, conducted a study examining the practical utility of Cherenkov imaging in clinical radiotherapy practice. The researchers evaluated the system in 64 patients who received radiotherapy at Dartmouth-Hitchcock’s Norris Cotton Cancer Center. Patients were treated for breast cancer (29), sarcoma/lymphomas (23) and other cancers, using techniques including 3D conformal radiotherapy, total skin electron therapy, arc therapy and total body irradiation. Jarvis and colleagues published their findings in the International Journal of Radiation Oncology, Biology, Physics.
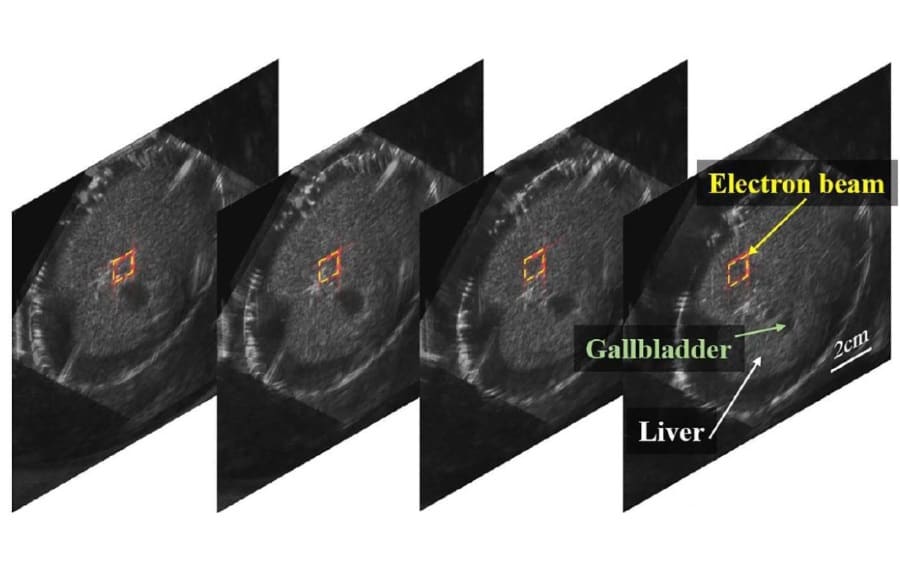
Radiation therapists and radiation oncologists reviewed the Cherenkov images to determine information of clinical benefit and identify treatment incidents. They first noted that the images were useful to monitor the tumour target and adjacent anatomy to ensure appropriate treatment delivery.
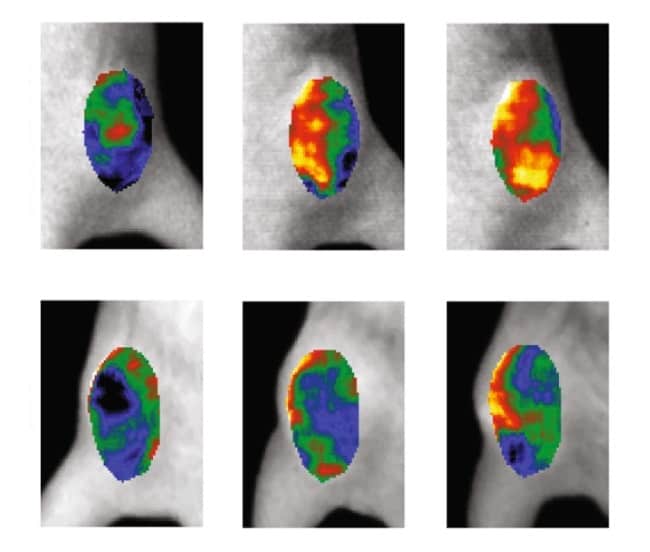
To evaluate day-to-day patient positioning accuracy, the researchers evaluated 129 fractions of imaged treatments of 15 breast cancer patients, using the system’s automated image analysis software. The Cherenkov emissions qualitatively matched the expected surface dose distribution predicted by the treatment planning system. Analysing the delivery accuracy by calculating the mean distance to conformity (MDC) revealed that the inter-fraction MDC was within 7 mm compared with the first day of treatment.
To perform absolute dosimetry with Cherenkov imaging, the researchers applied scintillator discs to regions-of-interest (ROIs) on three patients. The system identified the scintillators in the image and converted the intensity to dose, based on known emission response of the scintillator.
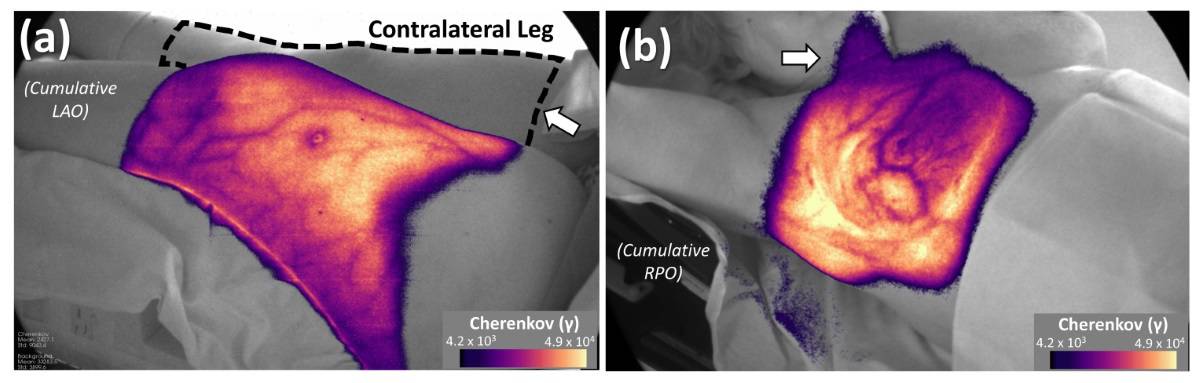
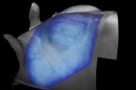
Jarvis and colleagues identified six cases among the 64 patients in which Cherenkov images provided particularly beneficial information. This included identification of unintended dose to the contralateral breast, arm or chin in breast cancer treatments. In extremity sarcoma treatments, Cherenkov imaging confirmed that the contralateral leg did not inadvertently receive dose.
Cherenkov imaging also identified positioning issues, even though these patients had been set up using an optical positioning system that reported positioning within the set tolerance levels. The researchers explain that “typical ROIs for optical surface imaging systems are often focused on a small area and do not detect alignment issues outside of the ROI. This may have the consequence of giving the clinical team a false sense of security.”
In addition to real-time monitoring, Cherenkov images can also be used for post-treatment analysis of accuracy and/or dosimetry. This analysis can be automated for large-scale review of treatment repeatability. Such data can help identify a patient who may require different immobilization due to set-up difficulties.
“In this limited cohort, we found opportunities to improve treatment delivery for individual patients,” write the authors. “Of specific clinical importance, we show that Cherenkov imaging can detect stray radiation dose to tissues. Currently, there is no practical technique available to monitor contralateral breast dose or dose to other adjacent anatomy on a daily basis.”
Algorithm enhances Cherenkov-based dose verification
Co-author Brian Pogue, co-founder and president of DoseOptics, tells Physics World that the research team is now planning a large, retrospective analysis of clinical data of patients receiving radiotherapy at Dartmouth-Hitchcock, to determine the incident rate detection and the value of Cherenkov imaging in daily monitoring of all treatments. He notes that Cherenkov imaging of all radiation oncology patients within the cancer centre began in the autumn of 2020. The BeamSite camera system received 510(k) clearance from the US Food and Drug Administration in December 2020.
“We will compare the value of incident detection at each of our two cancer centres. Only one uses surface guidance tools, so there may be interesting differences in daily patient alignment that Cherenkov imaging may better identify,” explains Pogue. “We are also investigating the ability to match lines between adjacent treatment fields, as well as quantifying absolute dose by using a calibration of the Cherenkov attenuation from a patient’s CT scan. We hope to implement this potentially for quantitative dose imaging.”