A new label-free optical imaging technique based on unscattered light can detect nanoparticles as small as 25 nm in diameter. The technology overcomes several limitations of other advanced methods for imaging tiny particles, and its developers at the University of Houston and the University of Texas M D Anderson Cancer Center in the US say it might be used to study viruses and other structures at the molecular level.
Imaging nanoscale objects via optical techniques is difficult for two reasons. First, the objects’ small size means that they scatter little light, making it hard to distinguish them from the background. Second, individual nano-objects within a close-packed group tend to be separated by distances that are smaller than the diffraction limit for visible light (around a few hundred nanometres) making it impossible to resolve them with conventional methods.
Surface plasmons
In recent years, researchers have developed techniques that go some way towards overcoming these problems. For example, methods such as surface plasmon resonance (SPRI) imaging and localized surface plasmon resonance imaging (LSPRI) rely on propagating light-excited plasmons rather than photons. Plasmons are collective oscillations of the conductive electrons on the surfaces of nanoparticles, and they allow the particles to act like tiny antennas: absorbing light at certain resonant frequencies and efficiently transferring it to nearby molecules so that they shine brighter.
These plasmon-based methods work by detecting the minute changes in the refractive index of an object placed on a metallic thin film. Since most materials have a refractive index that is higher than the ambient medium (usually water or air), SPRI can detect features of the object without having to label them with tracers such as the fluorescent dyes routinely employed in conventional optical imaging.
SPRI, however, still suffers from diffraction-limited resolution in the direction across the sample. This is due to the propagating-wave nature of surface plasmons, which “smears out” the image produced. LSPRI is better in this respect because it relies on non-propagating surface plasmons, which are localized in metallic nanostructures and nanoparticles that are roughly the same size as (or smaller than) the wavelength of the light being used to excite them.
Until now, researchers have mainly used LSPRI in conjunction with dark-field microscopy, which only collects light that is scattered by the sample onto a cone centred around the instrument’s optical axis. While this scattered light produces a bright image of the sample’s features, in contrast to the dark background, the technique often transmits insufficient light. This means it can “miss” some features and be “blind” to anything outside the sensing near-field.
Monitoring changes in the unscattered light transmitted
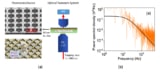
The new technique, developed by Wei-Chuan Shih at the University of Houston and colleagues, addresses the issues currently blighting SPRI and LSPRI. Known as PANORAMA (for PlAsmonic NanO-apeRture lAbel-free iMAging), it uses a glass slide covered with gold nanodiscs. This setup allows researchers to monitor changes in the unscattered light transmitted by the sample (in this work, an ensemble of polystyrene nanospheres) through the slide. They can thus determine characteristics of the sample, such as the number of particles in it and the size of individual particles.
With PANORAMA, Shih notes that there is no need to label a sample since the technique does not rely on detecting the light scattered from a nanoparticle. Another important advantage is that it uses a standard bright-field microscope commonly found in any laboratory. This means it can simultaneously image everything within the objective’s depth of focus with a single (tungsten-halogen) lamp source and a single camera, he explains.
Plasmonic tweezer array traps microparticles
True to its name, the new technique also provides a panoramic view of a sample in both lateral and longitudinal directions, overcoming the lack of imaging depth in both SPRI and LSPRI and insufficient lateral sampling in LSPRI, Shih adds. The bright-field approach also provides much higher light throughput compared to dark-field microscopy.
Smaller than 25 nm?
The researchers think the resolution of their techniques may be even smaller than 25 nm. They say they stopped at this size only because that is the smallest polystyrene nanoparticle they could buy.
The team, which includes researchers Nareg Ohannesian and Ibrahim Misbah in Houston and Steven Lin at the M D Anderson Cancer Center, now plans to employ PANORAMA to analyse functionalized single biological nanoparticles (such as proteins, viruses and extracellular exosomes) for diagnostic applications.
The technique is described in Nature Communications.