Laser-cooled YbOH molecules could aid the hunt for new physics

Physicists at Harvard University and Arizona State University in the US have succeeded in laser-cooling YbOH molecules – a crucial first step towards using these molecules to make precision measurements of the electron’s electric dipole moment (eEDM). Their work was augmented by a related effort, carried out by researchers at the California Institute of Technology (Caltech) and Temple University, to enhance the brightness of a beam of cold YbOH. The results appear in separate papers in New Journal of Physics, which (like Physics World) is published by IOP Publishing. 

Here, two members of the PolyEDM collaboration, Harvard PhD student Ben Augenbraun and Caltech PhD student Arian Jadbabaie, describe the project’s goals and achievements.

What was the motivation for the research?

Despite its many successes, the Standard Model of particle physics is an incomplete theory. Among other deficiencies, it explains neither the nature of dark matter nor why our universe is full of matter but not antimatter. These mysteries could be solved by the existence of new particles and interactions beyond the Standard Model (BSM). Despite many ongoing searches, no sign of BSM physics has been observed in the laboratory. 

If studied at high enough precision, “common” particles, such as electrons, may exhibit minute – but measurable – effects from “new” interactions and particles (those that exist in nature but have not yet been seen in the lab). Some of the best constraints on BSM physics have come from measurements of electrons in molecules that are a few degrees above absolute zero. Extending the current state-of-the-art requires probing large numbers (millions) of molecules over very long times (several seconds) – a task that calls for trapped, ultracold molecules at microkelvin temperatures. Our research tackles the challenges associated with both producing these molecules in large quantities and using a laser to reduce their temperature by many orders of magnitude.

What did you do?

We demonstrated laser cooling of YbOH, a heavy, polyatomic molecule with high sensitivity to BSM physics. We also showed that laser light can be used to enhance the chemical reactions that produce YbOH. 

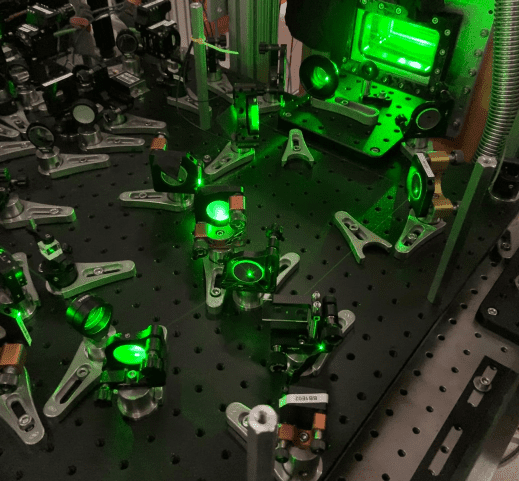
Using a combination of precisely tuned lasers and magnetic fields, we demonstrated laser cooling of a beam of gaseous YbOH in one dimension to temperatures as low as several microkelvin. Because of the complex vibrational motions in YbOH, we needed to apply many lasers in order to prevent loss of molecules to vibrational levels that did not “see” the other laser wavelengths. In this way, we forced the molecules to absorb and re-emit hundreds of photons, exerting large forces on them using the momentum of the photon to cool the molecules. 

Before laser cooling, we produce cold YbOH in a beam using chemical reactions between atomic Yb and OH-containing molecules (for example water or methanol). We were able to make these chemical reactions 10 times more efficient by using laser light (at a different wavelength than is used for the cooling) to excite the Yb atoms to a long-lived state. Our corresponding theoretical computations show that this excited Yb state has enough energy to overcome reaction barriers. 

What was the most interesting or important finding?

YbOH is one of the most massive small molecules and has one of the most complex structures among laser-cooled molecules. Showing for the first time that simple techniques could be extended even to YbOH is an important step forward. The laser cooling is extremely rapid, taking a fraction of a millisecond and requiring the absorption and re-emission of only hundreds of laser photons. The efficiency of this cooling is a very promising sign for extending it in future experiments. 

When using excited-state Yb, the chemical reactions producing YbOH are exothermic, with extra energy available that can heat the molecules. However, we perform the excitation and reactions in a cold environment full of helium gas. We found collisions with the helium effectively thermalize the additional molecules formed by the exothermic reaction. This is particularly useful for laser cooling, which requires a starting point of cold, slow molecules.
Why is this research significant?

Laser cooling of YbOH demonstrates that increasingly more complex polyatomic molecules can be brought under control, including at the single quantum state level. At ultracold temperatures, their additional complexity then becomes a feature, allowing for novel applications in precision measurement and beyond. 

Furthermore, the laser-based chemical enhancement we demonstrate can be applied to other reactions producing a variety of interesting molecules at low temperatures. Corresponding computations could help identify the optimal reactants for molecular production. Chemical enhancement can be a significant advantage for many experiments requiring cold molecules. 

Together, the combination of chemical enhancement and laser cooling will make possible measurements on trapped molecules that would search for BSM physics at scales far beyond those achievable by current particle collider technology. We expect this to extend the current reach of such experiments by several orders of magnitude. 

What will you do next?

The chemical enhancement could be further increased by optimizing the reactants involved and completely filling the reaction volume with the “catalysing” laser light.  

For laser cooling, the next step is to extend the cooling to 3D, which means cooling and confining the molecules to a small spatial volume – holding them in a trap of laser light. This requires laser slowing and the application of more lasers to extend the cooling force to that of nearly 10,000 photon “kicks”, up from the several hundred demonstrated presently. Once trapped, the molecules can be studied over many seconds, allowing their internal properties to be controlled and tracked with exquisite precision.  

The full results of both studies are reported in New Journal of Physics.

Diamond nanothreads could beat batteries for energy storage, theoretical study suggests

Computational and theoretical studies of diamond-like carbon nanothreads suggest that they could provide an alternative to batteries by storing energy in a strained mechanical system. The team behind the research says that nanothread devices could power electronics and help with the shift towards renewable sources of energy.

The traditional go-to device for energy storage is the electrochemical battery, which predates even the widespread use of electricity. Despite centuries of technological progress and near ubiquitous use, batteries remain prone to the same inefficiencies and hazards as any device based on chemical reactions – sluggish reactions in the cold, the danger of explosion in the heat and the risk of toxic chemical leakages.

Another way of storing energy is to strain a material that then releases energy as it returns to its unstrained state. The strain could be linear like stretching and then launching a rubber band from your finger; or twisted, like a wind-up clock or toy. Over a decade ago, theoretical work done by researchers at the Massachusetts Institute of Technology suggested that strained chords made from carbon nanotubes could achieve impressive energy-storage densities, on account of the material’s unique  mechanical properties.

Outperforms carbon nanotubes

Now, a new theoretical study by a team including Haifei Zhan, Gang Zhang and Yuantong Gu at Queensland University of Technology in Australia and the Agency for Science, Technology and Research (A*STAR) in Singapore reveals there may be circumstances in which bundles of carbon nanothreads outperform carbon nanotube bundles in terms of energy storage.

“We expected a good mechanical energy storage capability [for carbon nanothreads],” says Zhang of their results. “But surprisingly we found its energy density can be up to three times the lithium-ion battery in theory.”

First described in 2015,  nanothreads joined a catalogue of carbon nanomaterials that have emerged over the past four decades. Nanothreads are 1D structures with carbon atoms linked by single bonds (like those in diamond) to three other carbon atoms and a hydrogen atom. Where the hydrogen atom is missing, the carbon atom may bond to a fourth carbon atom in an adjacent thread. This bonding contrasts with the hexagonal carbon lattices found in buckyballs, carbon nanotubes and graphene. In these materials, electron orbitals from each carbon atom are shared between just three other carbon atoms.

Space elevator

Since 2015 studies have revealed several ways that carbon atoms can arrange themselves in a 1D carbon nanothread structure. Furthermore, several threads can be bundled together to create a chord with mechanical properties that are comparable to carbon nanotube bundles — which are so strong it was once proposed they could tether extraterrestrial objects from Earth to create a “space elevator”.

“The excellent mechanical properties of fibres of carbon nanothreads make them appealing alternative building blocks for energy storage devices, to power advanced microdevices and systems,” explains Zhang.

The team used molecular dynamics simulations and theory to compare the maximum energy stored under tension, torsion and bending for a specific type of carbon nanotube bundle and two nanothread bundle conformations – one straight and one helical.

Armchair nanotubes

Carbon nanotubes come in different widths and chiralities – the angle the carbon sheet is rolled along with respect to the honeycomb lattice. All these variations affect the nanotube’s properties. The team made its comparison using (10,10) “armchair” carbon nanotubes. These nanotubes are rolled perpendicular to the lattice lines giving half hexagon shapes ten carbon atoms long at the end of the tube. These are wide for carbon nanotubes, but they are also among the most commonly synthesized.

The research identified several drawbacks of using carbon nanotubes for energy storage – and several advantages of using carbon nanothreads. One problem with nanotubes is that they are prone to flatten when twisted or bent, which reduces the energy they can store under strain. In contrast, nanothreads retain their atomic conformation under strain. While individual carbon nanotubes have better properties for energy storage than single nanothreads, this advantage is not maintained when nanotubes are bundled. In contrast, bonds that can form between nanothreads where a hydrogen is missing make them better team players, so that a bundle with 19 nanothreads achieves 2.5 times the energy storage density of a bundle with three threads.

Another drawback of carbon nanotubes is that bundles can only sustain about a third of the torsion of a single nanotube, resulting in less favourable energy storage density in comparison with nanothreads.

“Carbon nanothread bundles could be made into twist-spun yarn-based artificial muscles that respond to electrical, chemical or photonic excitations,” suggests Zhang. “They could be a potential micro-scale power supply for anything from implanted biomedical sensing systems monitoring heart and brain functions, to small robotics and electronics.”

In pursuit of experimental validation of their results, the researchers are now working with scientists from Penn State University, where the world’s first Centre for Nanothread Chemistry has been established funded by the US National Science Foundation.  The collaborative team itself plans to focus its efforts over the next few years building microscale power supply systems based on the results of their research.

The research is described in Nature Communications.

Deep learning improves cardiac images from SPECT-only scanners

SPECT reconstructions

Single-photon emission computed tomography (SPECT) is a diagnostic technique that detects gamma rays emitted by an injected radiotracer to create 3D images of tracer distribution in a patient. It is employed in a range of clinical applications, such as myocardial perfusion SPECT, for example, used to evaluate the heart’s blood supply. To perform quantitative image analysis, however, attenuation correction is essential.

This attenuation correction is usually performed using CT. But while many newer SPECT systems are equipped with a CT scanner, stand-alone SPECT still makes up around 80% of the market. To enable quantitative imaging on these SPECT-only scanners, researchers at Yale University have used deep learning methods to estimate attenuation maps directly from SPECT emission data (Eur. J. Nucl. Med. Mol. Imaging 10.1007/s00259-020-04746-6).

“Current SPECT-only systems without CT normally do not support transmission scanning and therefore are susceptible to attenuation artefacts,” explains first author Luyao Shi. “Being able to estimate attenuation maps from SPECT emission data is expected to increase the diagnostic accuracy for those scanners.”

Map generation

The researchers employed a generative adversarial network (GAN) machine learning framework to train two neural networks: a generator (U-net) that produces synthetic attenuation maps directly from the SPECT emission data; and a discriminator, which discriminates between the synthetic and CT-based maps. As both photopeak and scatter photons contain useful attenuation information, they used emission data from both the photopeak window (126–155 keV) and the scatter window (114–126 keV) as inputs into these neural networks.

The study included 65 subjects, with both normal and abnormal cardiac function, who underwent myocardial perfusion SPECT with the tracer 99mTc-tetrofosmin. All patients were scanned on a SPECT/CT scanner, with CT data acquired immediately after the SPECT scans and converted to attenuation maps. The team used scans from 40 subjects for training and 25 for testing.

A key pre-processing step for deep-learning algorithms is image normalization. For this study, Shi and colleagues employed mean normalization, in which each channel of a SPECT image is normalized by the mean intensity of the entire two-channel image volume. Using this approach, they found that the generated synthetic attenuation maps were consistent with ground-truth CT-based attenuation maps. Among the 25 testing subjects, the globally normalized mean absolute error (NMAE) between the synthetic and CT-based maps was 3.60±0.85%.

The researchers compared the results when using both primary and scatter window inputs (GAN-PS), primary window inputs alone and scatter window inputs alone. They also repeated these comparisons with maps generated using only the U-net model, without the discriminator. For both GAN and U-net, using both primary and scatter inputs produced the closest results to the CT-based attenuation map. Use of only primary window data led to inaccurate body boundary recovery and artefacts, while only using scatter window data resulted in incorrect organ shape.

Luyao Shi and Chi Liu

In routine clinical practice, however, scatter window data are not always acquired. The team note that, if only primary window data are used as input, the GAN model could still generate accurate attenuation maps, while the U-net model led to much larger bias.

“Because of the help of the discriminator, GAN can generate more realistic results, especially when there is limited information,” Shi explains. “We included U-net in our analysis as the baseline to compare with, to show the improvement brought by GAN when only primary window information is available.”

Image correction

The team then used the predicted maps for attenuation correction of reconstructed SPECT images from the 25 test subjects. Images corrected using the CT-based and synthetic attenuation maps were highly consistent, with a NMAE between the two of just 0.26±0.15%. Again, when both primary and scatter window data were used as inputs, both GAN and U-net generated accurate results. However, when only primary windows were used, GAN clearly outperformed U-net.

As the heart is the key organ in myocardial perfusion studies, the researchers performed local region-of-interest (ROI) evaluations on SPECT images corrected with synthetic attenuation maps, looking at the left ventricle myocardium and blood pool. For both GAN and U-net, using primary and scatter data, mean voxel values in these ROIs showed negligible difference from those corrected using CT-based attenuation maps.

These initial results demonstrate the feasibility of generating accurate attenuation maps from emission data for myocardial perfusion SPECT. Next, the team plans to investigate whether SPECT scans from patients at rest or under pharmacological or exercise stress differ, and whether separate networks are needed for each group.

“In this single-site study, we demonstrated the robustness of our method for a single scanner and 99mTc-tetrofosmin tracer. Further investigation on a wide range of imaging protocols, scanner models and tracers will likely enhance the clinical impact,” added corresponding author Chi Liu.

Fluids only get so runny as physicists put a universal lower limit on viscosity

Viscosity is an everyday phenomenon recognizable in the difference between slow-pouring liquids like honey and runny substances like water. Yet the complex molecular interactions that create viscosity make it very hard to calculate theoretically. Now, a pair of physicists in the UK and Russia has taken up the challenge and derived a simple formula that puts a lower limit on the viscosity of all materials. That formula, they say, reflects the quantum-mechanical nature of molecular interactions and involves two fundamental physical constants – Planck’s constant (ħ) and the proton-to-electron mass ratio.

Viscosity acts like a kind of internal friction between adjacent layers of a moving fluid. When water flows through a pipe, for example, there is friction between the faster flowing molecules in the centre of the pipe and slower moving molecules nearer the pipe walls. A calculation of the viscosity of a material from first principles must consider the substance’s molecular composition and structure as well as the temperature and pressure of the system. In fact, viscosity varies over 19 orders of magnitude – from very low values for helium gas to extremely high values for liquids near the glass transition.

Undeterred, Kostya Trachenko of Queen Mary University of London and Vadim Brazhkin of the Russian Academy of Sciences’ Institute for High Pressure Physics near Moscow set out to find an equation that would establish a lower bound on viscosity across all fluids. Their work relies on viscosity’s variation with ambient conditions – the fact that at a given pressure any fluid will have a minimum value at a certain temperature.

Exchanging momentum

For liquids, as the temperature goes up, the constituent molecules vibrate more and weaken the cohesive interactions between them – leading to a loss of viscosity. But in a gas the opposite happens. Because layers exchange momentum through collisions, a higher temperature leads to greater viscosity. So a fluid’s viscosity will be lowest at the transition between liquid-like and gas-like states.

To work out the minimum viscosity of any fluid, Trachenko and Brazhkin considered what happens to a gas as it cools down. They reasoned that during the cooling process the mean-free path of the gas molecules decreases but does not drop below a minimum value roughly equal to the distance at which significant interactions between molecules kick in. That assumption led to a formula for the minimum viscosity in terms of three molecular properties – mass, vibration (Debye) frequency and inter-particle spacing.

The researchers confirmed their calculations by obtaining the same formula after starting with a liquid and working up to higher temperatures. They also found that by inserting suitable values for the three variables their formula yielded minimum viscosities for a range of different fluids broadly in agreement with experimental results – those viscosities lying between about 10-4-10-5 Pascal-seconds. However, to arrive at a formula involving only fundamental constants they had to carry out a few more steps.

First, they worked out an expression for what is known as the “kinematic viscosity” – the ratio of a fluid’s viscosity to its density. The duo set the inter-particle spacing as equal to the Bohr radius (the “radius” of a hydrogen atom) and fixed the cohesive energy between molecules in a liquid to be the Rydberg energy (the energy needed to ionize a hydrogen atom). This allowed them to express kinematic viscosity in terms of ħ, molecular mass and electron mass.

Final flourish

Then, as a final flourish, they invented a new quantity that they call “elementary viscosity” – the product of kinematic viscosity and molecular mass. They found that the lower bound on this quantity – when the molecule in question is a single atom of hydrogen and its mass therefore equal to that of the proton – is an expression involving just ħ and the proton-to-electron mass ratio (as well as π). Numerically, they point out, it is roughly equal to ħ.

“Viscosity is a complicated property varying strongly for different liquids and external conditions,” says Trachenko. “Yet our results show that the minimal viscosity of all liquids turns out to be simple and universal.”

Indeed, the pair’s calculations come close to matching the values obtained with experimental data – the lowest elementary viscosities from empirical data for molecular hydrogen and helium being about 3.5 ħ and 1.5 ħ respectively. Heavier water, meanwhile, has a minimum of about 30 ħ. They also point out that their formula is consistent with the uncertainty principle – which sets a minimum value of ħ for a particle constrained within the Bohr radius.

Quark-gluon plasma

In addition, they say, the result chimes with lower bounds on viscosity previously obtained by using quantum field theory to work out the properties of what is known as a quark-gluon plasma – an exceptionally hot soup of unbound fundamental particles thought to have existed in the very early universe.

On a more practical note, Trachenko reckons that their work might help scientists develop new low-viscosity fluids for use in chemical, industrial or biological processes – such as supercritical fluids for dealing with complex waste. The lower bounds on viscosity, he says, could be useful theoretical targets, while aiming any lower would mean wasting resources.

Not everyone is convinced, however. Thomas Schäfer of North Carolina State University in the US says that the pair’s formula might be a good estimate for what he calls “typical fluids”. But he reckons that assumptions about length being on the scale of the Bohr radius and time being tied to the Debye frequency may not always hold true. In ultra-cold Fermi gases, he says, such as laser-cooled atoms of lithium or potassium, the length and time scales “are quite different”.

The research is reported in Science Advances.

Multidimensional physics you can do at home, gingerbread radiation therapy, making glow-in-the-dark plants

Yesterday I helped my daughter with her GCSE physics homework, and I was rather pleased that I remembered that V=IR and P=IV. While we had great fun working out the properties of various electrical appliances, some of you might want to do more hands-on physics at home.

You are in luck because the Institute of Physics (IOP) is releasing a series of videos called “Do try this at home”. My favourite video so far is presented by the IOP’s Lucy Kinghan and is about warping a 2D landscape (a piece of paper) into 3D and accomplishing something that had appeared impossible. Watch her demonstration above – I have to admit I am still scratching my head about how she did it.

If warping space is not your cup of tea how about baking your favourite piece of physics kit? Lotte Fog, a medical physicist in Australia, has made a “gingerbread LINAC” complete with a gingerbread patient receiving radiation therapy. If you are inspired to bake your own apparatus, be sure to send us a photo at pwld@ioppublishing.org.

Making a glow-in-the-dark plant is probably beyond the capability of most scientists at home. But if you are really keen to try, Karen Sarkisyan, Ilia Yampolsky and an international team have used DNA from a bioluminescent mushroom to create plants that glow much brighter than previously possible (see above video).

I don’t know about you, but I bet we have a few bioluminescent mushrooms lurking at the bottom of the fridge. You can read more about these amazing plants in a scientific paper called “Plants with genetically encoded autoluminescence”.

Quantum computers vastly outperform supercomputers when it comes to energy efficiency

Researchers in the US have created a new energy-based benchmark for quantum advantage and have used it to show that noisy intermediate-scale quantum (NISQ) computers use several orders of magnitude less energy than the world’s most powerful supercomputer when doing a specific task.

As quantum computers become larger and more reliable, the question of whether a quantum computer can perform calculations beyond the reach of even the most powerful conventional supercomputer is becoming increasingly relevant. This ability has been dubbed “quantum advantage” or “quantum supremacy” and it marks the point where quantum computers move from being scientific curiosities to useful devices.

However, measuring quantum advantage is difficult as illustrated by the debate that ensued after Google claimed advantage for its Sycamore NISQ device in September 2019. Google scientists said that Sycamore could solve a specific problem in a mere 200 s, while estimating that a powerful supercomputer would take a whopping 10,000 years to perform the same task. But one month later, physicists at IBM argued this was a gross overestimate and a supercomputer could complete the task in just 2.5 days – essentially negating the claim of advantage.

Fragile qubits

Quantum computers show enormous promise because they can – at least in principle – use the laws of quantum mechanics to perform some calculations much faster than even the most powerful conventional computers. Useful calculations could be done using a relatively small number of quantum bits (qubits) – hundreds or maybe thousands – but creating a quantum computer with more than a few dozen qubits is a difficult task because the quantum states used to create qubits are fragile, short-lived and difficult to control. Devices such as Google’s Sycamore are called NISQs because they have an intermediate number of qubits (Sycamore has 54) and are noisy in terms of imperfect qubit control.

Another challenge for the quantum industry is that there is no agreement on the best qubit technology, with some firms opting for superconducting qubits while others are working on trapped-ion computers. Still other technologies are also under development. As a result, practical quantum computers that solve real-world problems are still a few years away – and benchmarking is essential.

In the meantime, researchers are trying to benchmark the development effort by finding problems that today’s nascent quantum computers can perform more efficiently than the most powerful conventional computers. One task that clearly lends itself to a quantum computer is calculating the output of “random quantum circuits” (RQC). This benchmark was used by Google to make the 2019 claim of quantum advantage. The problem can also be solved by running a “quantum simulator” program on a conventional supercomputer and the crucial question is question is whether the quantum computer solves the problem more efficiently than the most powerful quantum simulator.

Defining efficiency

One sticking point is how to define efficiency, and researchers have usually considered the time taken to solve a problem. In this latest study, Salvatore Mandrà and colleagues at NASA’s Ames Research Center in California, Google and Oak Ridge National lab argue that considering time alone is problematic. Mandrà explains, “A problem that will take you 1 h on a one-core processor will take you 30 min on a two-core processor or 15 min on a four-core processor”.

Instead, Mandrà and colleagues calculated the energy required by both NISQ and conventional supercomputers to solve the RQC problem. They designed a program called qFlex, which they believe to be the most efficient quantum simulator possible. This is demonstrated, explains Mandrà, by the fact that the efficiency of the simulation is almost constant regardless of the details of the problem it is applied to.

The team implemented qFlex on the Electra supercomputer at Ames and on the Summit supercomputer at Oak Ridge – Summit is the world’s most powerful supercomputer. They calculated the energy both supercomputers expended in performing the calculation and compared it to the energy used by a NISQ. The researchers found that their qFlex implementation required 97 MWh to run on Electra and 21 MWh on Summit, whereas the problem could be solved by a NISQ using only 4.2×10⁻⁴ MWh. To put those figures into perspective, the average US household uses 11 MWh of electrical energy per year.

“Lots of papers are developing classical algorithms to simulate quantum systems because there’s a lot of quantum systems around and physicists care about how they behave,” says Daniel Gottesman of the Perimeter Institute for Theoretical Physics in Waterloo, Canada, who was not involved in the research. “The specific focus on quantum supremacy is a moment in time that will probably extend for a few years, but after that it will probably be assumed that we have quantum computers that are better than classical computers, and the idea of classical algorithms to simulate quantum computers will become less and less valuable.”

The research is described in Quantum Science and Technology.  

Avoid, track, recycle: solutions to the problem of plastic waste

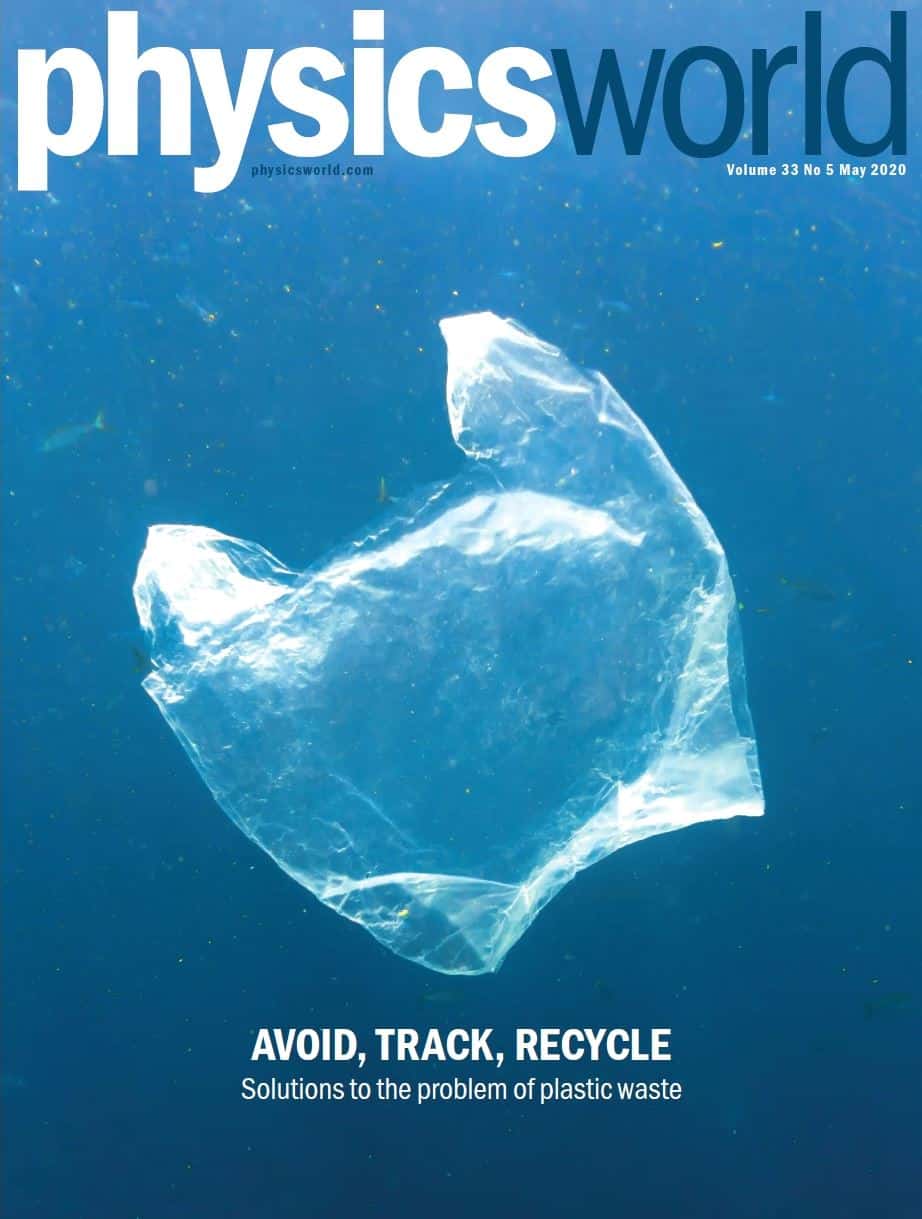
Cover of May 2020 Physics World

Finding ways to reduce, track and recycle the mountains of plastic waste consumed and disposed of each year is the theme of the May 2020 special issue of Physics World, which is now out in print and via the Physics World digital apps for iOSAndroid and Web browsers.

The issue was timed to coincide with the start of a new era, in which print copies of Physics World were no longer going to be sent out wrapped in plastic, but in paper (sadly the disruption caused by the COVID-19 pandemic has put those plans on hold).

Paper magazine wrapping is not a perfect solution environmentally, but it has certain advantages, as you can discover in the feature “Physics World unwrapped”, which explores the science of magazine wrapping. You can also read it online here.

Remember that if you’re a member of the Institute of Physics, you can read the whole of Physics World magazine every month via our digital apps for iOSAndroid and Web browsers. Let us know what you think about the issue on TwitterFacebook or by e-mailing us at pwld@ioppublishing.org.

For the record, here’s a rundown of what else is in the issue.

• Critical research hit by COVID-19 – Major labs have shut their doors in response to the worldwide lockdown, but a few remain open and in some cases are carrying out critical work related to the COVID-19 pandemic, as Peter Gwynne and Michael Banks report

• Physics in the pandemic – Highlights from your experiences around the world

• Philip Anderson: a legend is lost – The Nobel laureate Philip Anderson was a giant of condensed-matter physics, who was unafraid to speak out against what he saw as the excesses of particle physics. Michael Banks looks back

• That’s a wrap! – Physics World will be switching to a paper wrapper, when the COVID-19 pandemic allows, explains Matin Durrani

• Learning from Black Swan events – With COVID-19 causing thousands of deaths worldwide and a global economic crash, Christopher Lavers says that we should have learned from previous crises

• This is the Critical Point – Having written the Critical Point column in Physics World for 20 years, Robert P Crease still worries that physicists don’t realize why the humanities are so important

• Serendipity inaction – Accidental discoveries lie at the heart of many technological innovations. James McKenzie runs through his favourites

Physics World unwrapped – Ever wondered why your print copy of  Physics World is still delivered wrapped in plastic? That’s about to change, but as Susan Curtis finds out, abandoning single-use-plastic magazine wrappers is not as straightforward as it sounds

• The search for the missing plastic – There is a huge amount of plastic waste polluting our oceans – but we don’t know where it is. Marric Stephens investigates what scientists are doing to find the missing plastic

• Plastic that doesn’t cost the Earth – The vast increase in unwanted plastic pollution has galvanized scientists and innovators around the world to develop ingenious approaches to reuse, retrieve and recycle plastic. But significant challenges remain, as Anna Demming reveals

• Money from maths – David Appell reviews The Man Who Solved the Market: How Jim Simons Launched the Quant Revolution by Gregory Zuckerman

• Quantum inheritance and the ongoing quest for meaning – Philip Ball reviews Quantum Legacies: Dispatches from an Uncertain World by David Kaiser

• Shedding light on the interfaces – Joe McEntee talks to surface scientist Karen Syres about striking a balance between teaching and research while also building visibility and connection with the scientific community

• Ask me anything – Careers advice from Carole Mundell, Bath University, UK

• Ministry of Recovery and Discovery – Peter Wright on if he ruled the world

NASA satellite missions track 16 years of Earth’s melting ice sheets

Losses from the ice sheets of Antarctica and Greenland in the last 16 years have far outpaced snow accumulation, leading to around 14 mm of sea level rise since 2003, a research team led by the University of Washington has revealed. The findings – based on elevation measurements taken by two NASA laser-ranging satellite missions – may help refine our understanding of how ice sheets are reacting to climate change.

Traditionally, studies of the changing mass of ice sheets have relied on combining measurements from various airborne and satellite-based missions, often only representing limited snapshots of time. In the new study, however, researchers contrasted data from NASA’s 2003–2009 ICESat (Ice, Cloud and land Elevation Satellite) mission with its counterpart ICESat-2 that launched in 2018 – allowing for a detailed comparison of elevation changes at tens of millions of sites, from which the team could estimate ice sheet mass changes over the span of more than a decade.

“If you watch a glacier or ice sheet for a month, or a year, you’re not going to learn much about what the climate is doing to it,” says lead author and Washington polar scientist Benjamin Smith. “We now have a 16-year span between ICESat and ICESat-2 and can be much more confident that the changes we’re seeing in the ice have to do with the long-term changes in the climate.”

The researchers found that from 2003–2019, Greenland’s ice sheet shed an average of 200 gigatons of ice each year, while Antarctica lost around 118 gigatons. For comparison, one gigaton of ice would fill some 400,000 Olympic swimming pools. Of the resulting sea level rise, two-thirds came from Greenland ice losses.

“It was amazing to see how good the ICESat-2 data looked, right out of the gate,” says NASA’s ICESat-2 project scientist Thomas Neumann. “These first results looking at land ice confirm the consensus from other research groups, but they also let us look at the details of change in individual glaciers and ice shelves at the same time.”

Greenland ice changes

In Greenland, for example, the team found significant ice losses from the thinning of coastal glaciers – such as Kangerlussuaq and Jakobshavn, which both lost between 4–6 m of elevation each year on average. Ice is being lost both from the surface of the glaciers and ice sheets as a product of warmer summer temperatures, but also from their fronts in places due to the presence of warmer ocean water.

Increased snowfall in Antarctica, meanwhile, appears to be causing a thickening of the ice sheet in the content’s interior – but this is being overwhelmed by melting at the edges of the ice sheet. “In West Antarctica, we’re seeing a lot of glaciers thinning very rapidly,” Smith says. “There are ice shelves at the downstream end of those glaciers, floating on water. Those ice shelves are thinning, letting more ice flow out into the ocean as the warmer water erodes the ice.”

Because the ice shelves are already floating, their loss does not contribute to sea level rise – but such has a knock-on effect. “It’s like an architectural buttress that holds up a cathedral,” explains paper author and glaciologist Helen Amanda Fricker of the University of California, San Diego. “If you take away the ice shelves, or even if you thin them, you’re reducing that buttressing force, so the grounded ice can flow faster.”

In West Antarctica – home to some of the continent’s fastest glaciers – the team found that the Thwaites and Crosson ice shelves are being thinned the most, losing ice at an average of 5 and 3 m each year, respectively.

“I would say that the overall findings offer an evolution rather than a revolution of our understanding of current trends in ice sheet mass loss,” comments Andrew Sole – a glaciologist from the University of Sheffield who was not involved in the present study – explaining that the ICESat data broadly support other recent ice sheet mass balance assessments. However, he added, the precision of ICESat-2 measurements compared with radar allows for more accurate analysis of the steeper ice sheet margins where much of the recent loss of grounded ice has occurred – and will likely help us better understand the processes driving these trends and the balance between melting ice shelves and the glaciers that feed them

The research is described in Science.

Clinical experience on an automated QA platform in a busy multicentre department

Want to learn more on this subject?

Iridium Kankernetwerk is a busy oncology department that provides about 5600 radiation-therapy treatments per year across four locations in Belgium. The department was looking to optimize its quality-assurance programme through standardization and automation. In addition, the team wanted to develop an in vivo monitoring programme that would both improve patient safety and meet evolving requirements for radiation treatments.

SUN Nuclear iridium bThe solution of choice is SunCHECK™ Patient from Sun Nuclear. In addition to meeting its departmental goals, SunCHECK has allowed the team to continue reviewing patient plans and performing quality-assurance remotely during these challenging times.

Watch this webinar to hear Evy Bossuyt, a medical physicist at Iridium Kankernetwerk, share her and the team’s experiences.

The webinar includes details of

  • Automation and transit dosimetry: implementing a standardized transit-dosimetry solution in a busy radiation-therapy department;
  • Error detection: using automation and standardization to streamline pre-treatment quality assurance and using in vivo dosimetry to enhance error detection; and
  • Clinical insights: initial experiences from an in vivo programme and insights into possible actions for adaptive planning.

Want to learn more on this subject?

Evy BossuytEvy Bossuyt is a medical physicist at Iridium Kankernetwerk. Iridium Kankernetwerk includes several hospitals in the Antwerp region of Belgium (including GZA hospital group, ZNA hospital group, UZA, AZ KLINA, AZ Nikolaas, AZ Monica, and AZ St Jozef), with 11 linear accelerators in total. The network includes a staff of 14 medical physicists and five physics assistants, and provides about 5600 radiation-therapy treatments each year.

Sun could be in midlife doldrums, survey of stellar activity reveals

The Sun appears to be far less active than other similar stars, an international team of astronomers has discovered. Timo Reinhold at Max Planck Institute for Solar System Research  and colleagues made the unexpected discovery after studying long-term data gathered by the Kepler Space Telescope. Their findings could give astronomers a broader perspective on evolution of the Sun and could mean that our star is in a midlife lull at the moment.

Centuries of observations of the Sun show that the numbers of sunspots changes in reliable, time-varying cycles. More sunspots mean more magnetic activity at the surface of the Sun and more violent events like mass ejections – which can cause solar storms on Earth that can disrupt some technologies. Other main-sequence stars like the Sun are also expected to have similar variations, but until now little was known about how they compared to the Sun.

Spots on other stars are too small to resolve from Earth, however their movements on the surface of a star cause periodic variations in its brightness that can be observed – and this can be used to calculate magnetic activity. For Reinhold’s team, this effect provided a unique opportunity to compare the Sun’s activity with that similar stars using NASA’s Kepler Space Telescope.

Time-varying brightness

Over four years, the instrument measured the time-varying brightness of 150,000 main-sequence stars as it searched for exoplanets. At the same time, ESA’s Gaia spacecraft measured the motions and positions of stars across the galaxy with similarly impressive accuracy.

By combining and analysing these datasets, Reinhold and colleagues identified 369 stars with similar temperatures, masses, ages, chemical compositions, and rotational periods as the Sun. They found that despite these similarities, most of the stars displayed far higher levels of brightness variation that indicate average activity levels around five times higher than that of the Sun. The team noted that this discrepancy could have arisen since the brightness variations of some Sun-like stars may be too subtle for Kepler to detect, eliminating them from their analysis and boosting the average.

Alternatively, this average could be indicative of Sun-like stars, which suggests that the Sun could have gone through similar periods of higher activity in the past. This idea is in line with other research that suggests that towards the middle of their lifetimes, main-sequence stars could shut down their activity cycles while maintaining their rotational speeds. Reinhold’s team now hope to explore these ideas in more detail through upcoming measurements by instruments including TESS and PLATO; potentially leading to new insights into how the Sun will evolve in the future.

The research is described in Science.

Copyright © 2026 by IOP Publishing Ltd and individual contributors