Birds learn from watching TV, eye-catching science images and levitating blood

When faced with potential prey, how do predators know to avoid those that taste disgusting and potentially contain toxic chemicals? According to a study published earlier this week, for some birds at least, watching TV can help. The researchers, from Finland and the UK, showed that by watching videos of other birds eating, blue tits and great tits learn to recognise bad-tasting prey by their markings, without having to taste them first.

Many insects have conspicuous markings and bitter-tasting chemical defences to deter predators. But these warning markings are only effective once the birds learn to associate them with a disgusting taste – a skill that could potentially increase both the birds’ and their prey’s survival rate.

In the study, the researchers showed each bird a video of another bird’s disgust response – including vigorous beak wiping and head shaking – as it ate a bad-tasting “prey” item (almond flakes soaked in a bitter solution) from a paper packet marked with a square. Afterwards, TV-watching birds given a mixture of the bitter almond flakes and plain flakes in packets marked with a cross ate fewer of the disgusting packets.

“Blue tits and great tits forage together and have a similar diet, but they may differ in their hesitation to try novel food. By watching others, they can learn quickly and safely which prey are best to eat. This can reduce the time and energy they invest in trying different prey, and also help them avoid the ill effects of eating toxic prey,” explains first author Liisa Hämäläinen.

Is this a stunning new piece of modern art, or an information-rich scientific image? The Science and Medical imaging competition run by the Institute of Cancer Research (ICR) highlights some of the most engaging and eye-catching images created by ICR and Royal Marsden researchers as part of their cancer research.
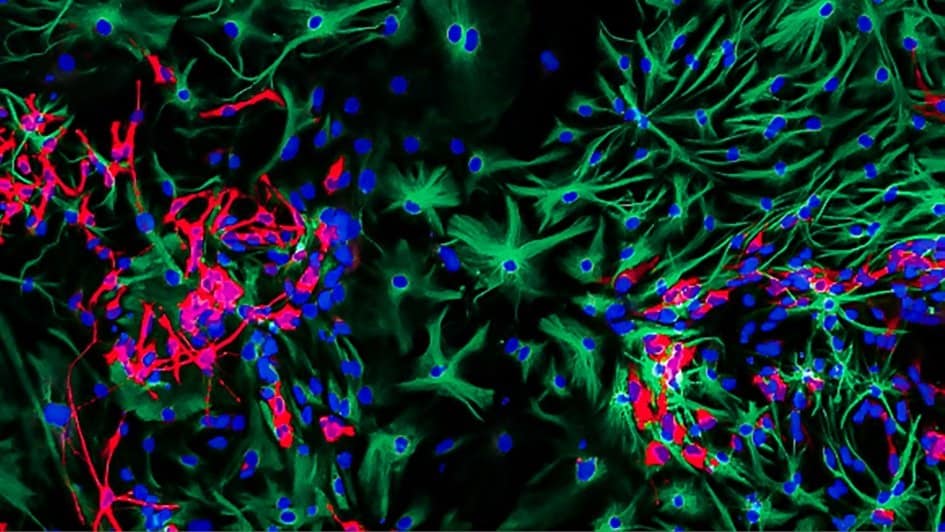
Differentiating brain cancer cells

This year’s winner was “Differentiating brain cancer cells” by PhD student Sumana Shrestha. Taken using confocal microscopy, the colourful image shows neural stem cells from mice that are being used to study the aggressive brain cancer glioblastoma. Impressively, Shrestha also won the public vote, chosen via social media from eight of the competition’s most highly rated images, with a scanning electron microscopy image of dimpled “golf ball-like” microparticles that could be used to deliver drugs into the body.

Other images on the public shortlist included the first ever super-resolution microscopy image of focal adhesions – molecules that help cancer cells move and spread around the body – and a 3D image of an invading melanoma cell. The full selection of winning and shortlisted images can be seen on the ICR website.

Elsewhere, a US/Canadian research team is levitating human blood to detect opioid addiction. The researchers are using magnetic levitation to separate proteins from blood plasma. When separated, plasma proteins with different densities levitate at different heights and become identifiable. Optical images of the levitated proteins can help identify whether a patient has the possibility of getting a disease or becoming addicted to drugs such as opioids.

Sepideh Pakpour

“We compared the differences between healthy proteins and diseased proteins to set benchmarks,” explains researcher Sepideh Pakpour. “With this information and the plasma levitation, we were able to accurately detect rare proteins that are only found in individuals with opioid addictions.” She notes that the team is particularly excited about the possibility of developing a new portable and accurate disease detection tool.

And finally, it’s time to pay tribute to Larry Tesler, the Apple employee who invented cut, copy and paste, who has died aged 74. Now we’re not saying Tesler had anything to do with the recent rise in plagiarism in academic publishing, but who’d have thought those two little keys CTRL-C and CTRL-V could cause such a stir? Now we’re not saying Tesler had anything to do with the recent rise in plagiarism in academic publishing, but who’d have thought those two little keys CTRL-C and CTRL-V could cause such a stir?

Inquiry-led physics lab courses boost student engagement, finds study

Lab sessions designed to emphasize and teach experimentation skills, rather than reinforce lecture content, improve student attitudes towards experimental physics. That is according to a study by researchers from Cornell University and the Colorado School of Mines, which also found that despite the experimentation labs covering half the number of physics topics, there is no difference in students’ exam performance.

In their study, the researchers randomly assigned almost 100 students who had been enrolled in an introductory, calculus-based physics course, to two different types of lab sessions. All students attended the same lectures and discussions, and took identical coursework and exams, but 54 of them attended lab courses designed to reinforce knowledge introduced elsewhere on the course. The other 43, however, were enrolled in lab classes that had specifically been designed to teach experimentation skills (Phys. Rev. X 10 011029).

We actually had trouble kicking them out of class

Natasha Holmes

Students who followed the traditional lab sessions, which closely followed lecture content, saw students being given instructions of experimental procedures and worksheets to complete. However, the experimentation lab students were expected to make decisions about the design and analysis of their experiments, and how to extend them. Over the course of the semester, instructions were reduced and lab sessions did not mirror lecture content at all.

More engaged

To assess the level of student engagement, observers attended lab sessions – recording each student’s behaviour and noting when they left the lab for the day. All lab sessions lasted 115 minutes, but students in the experimentation group stayed for significantly longer than those in the content-reinforcement labs, remaining on average for 118 minutes compared with 91 minutes. The researchers attributed these differences to the structure of the labs. In the content-reinforcement sessions, students could rush through the set tasks and worksheets, while participants in the experimentation labs were expected to repeat, improve and extend their investigations, without a defined end point.

“We think it’s teaching them to have ownership over their experiments, and they’re continuing to investigate,” says Natasha Holmes from Cornell, who was part of the study. “We actually had trouble kicking them out of class.” The labs also encouraged expert-like experimentation behaviours. Indeed, the observational data showed students in those labs were more likely to repeat their experiments to improve them – with or without prompting – and to identify and interpret disagreements between their data and a given model.

Surveys showed that students in the experimentation labs also had more positive attitudes and perceptions of experimental physics. “Compared to the traditional lab, where everyone’s really doing the same thing and just following instructions, we now have all of the students doing something completely different. They’re starting to be creative,” says Holmes.

Despite the experimentation labs covering half the number of physics topics, there was no difference between results in mid-term and end-of-term exams of the two groups. Emily Smith, at the Colorado School of Mines, says that despite decades of dissatisfaction with traditional physics labs, change has been slow due to concerns about the possible impact on students’ learning. “This study shows directly that the change can happen with no impact to students’ understanding of conceptual physics ideas, and with positive benefits to their behaviour and attitudes toward experimental physics,” she says.

Emmanuel Sabonnadière describes technology trends within optoelectronics

Emmanuel Sabonnadière is the CEO of CEA-Leti, a research institute for electronics and information technologies, based in Grenoble, France. During the recent Photonics West conference in San Francisco, Sabonnadière and his colleagues hosted an event to showcase the institute’s latest developments in microelectronics and nanotechnology. Before the event, Physics World caught up with Sabonnadière to find out about the challenges of integrating photonics and electronics, and to get his opinion on trends such as artificial intelligence and quantum technologies.

Mixed ion beams could enhance particle therapy accuracy

Ion beam radiotherapy offers precision dose deposition, with a low entrance dose increasing to a maximum at the Bragg peak and then falling off sharply. This steep dose gradient, however, makes treatments such as carbon-ion therapy highly sensitive to range uncertainties. As such, there’s a clear need for improved treatment verification techniques.

One recent idea is to add a small amount of helium ions to a carbon-ion treatment beam to enable online monitoring during therapy. Fully stripped helium and carbon ions exhibit roughly the same mass/charge ratio, allowing their simultaneous acceleration in a synchrotron to the same energy-per-nucleon. As helium ions have about three times the range of carbon ions (at the same velocity) they travel straight through the patient and can be used for imaging while the carbon-ion beam provides the treatment.

To assess this proposed helium/carbon beam mixing method, a team headed up by Joao Seco at the German Cancer Research Centre (DKFZ) and Simon Jolly at University College London (UCL) has irradiated phantoms with beams of helium and carbon ions at the Heidelberg Ion-Beam Therapy Centre (HIT) (Phys. Med. Biol. 10.1088/1361-6560/ab6e52).

“We wanted to investigate whether the advantages offered by particle imaging could also be exploited for online treatment verification,” explains first author Lennart Volz, who worked on the project in close collaboration with UCL’s Laurent Kelleter. “Range uncertainty is a key challenge in particle therapy and any accurate method for online treatment verification could greatly benefit patients. The mixed beam could be ideal for this, as it would enable you to see what you treat.”

Detecting range modulation

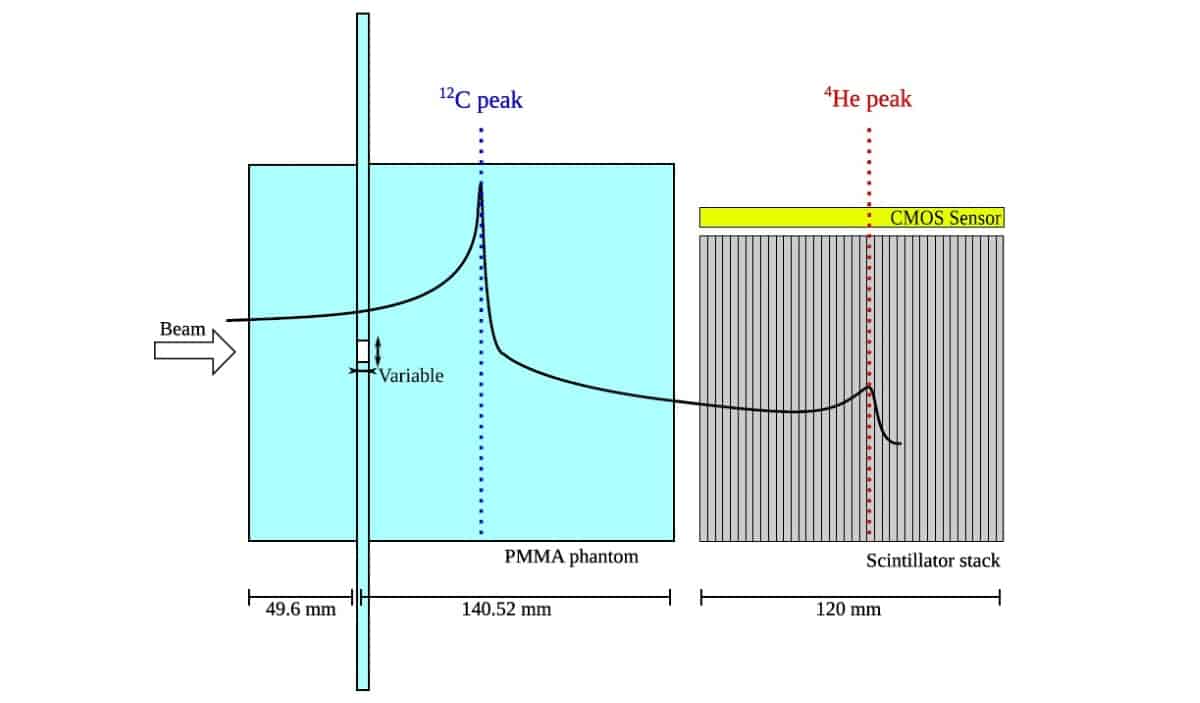
Since the HIT synchrotron is not set up to deliver mixed beams, the researchers irradiated the phantoms sequentially with helium- and carbon-ion beams of similar energy-per-nucleon, using a 10:1 carbon-to-helium ratio. To monitor the range of the helium-ion beam and carbon-ion fragments, they used a novel range telescope developed at UCL, comprising a stack of thin plastic scintillator sheets read out by a flat-panel CMOS sensor.

Summing the scintillation light yield in each sheet and attributing it to the water-equivalent thickness at the centre of the sheet enabled the creation of depth–light curves. The curves of the carbon- and helium-ion beams were scaled 10:1 and then summed to produce a “mixed-beam” signal.

Investigating sensitivity

The researchers assessed the system’s sensitivity using a PMMA slab phantom containing different sized air slits. They used the difference between the measured light output signal and a reference measurement to quantify range changes. Irradiating phantoms with slits of 2 mm thickness and widths of 5 and 2 mm resulted in relative differences of 40% and 17% (from a solid phantom), respectively, in the residual beam range. This was expected as more of the 8 mm FWHM beam (55%) crosses the larger slit than the smaller one (22%). Even a 1 mm thick, 2 mm wide slit could be observed, with a relative difference of 8%.

Clinical scenarios

To examine a more clinically relevant scenario, the team used the ADAM pelvis phantom to study the effect of bowel gas movements on helium-ion beam range. They generated a prostate cancer treatment plan and irradiated the ADAM phantom using three spots from the plan (with the same energy), incident upon: the tumour isocentre, a spot near the rectum and a spot between the two. They inflated a rectal balloon inside the phantom to air volumes of 30, 45 and 60 ml.

For the spot near the rectum, even the smallest air volume in the balloon caused an observable change in helium range. For larger inflations, the team saw a drastic overshoot in helium range as the beam crossed into the rectum and rectal gas. Similarly, for the in-between spot, the two larger inflations created observable signal changes. At the isocentre, the team saw no significant change with balloon inflation. In a Monte Carlo simulation of the experiment, however, the two larger air volumes caused small changes.

Finally, to investigate the effect of small patient rotations on the observed signal, the team used the ADAM-PETer pelvis phantom. They irradiated the phantom rotated by 2° and 4° around its vertical axis. Both rotations led to a noticeable change in the measured mixed beam signal compared with the non-rotated state, with similar but slightly larger effects seen in simulations.

ADAM-PETer phantom

The findings reveal the potential of using a mixed helium/carbon beam to monitor intra-fractional anatomy changes. The ability to detect range modulation from a narrow air gap affecting less than a quarter of the beam demonstrates the method’s relative sensitivity. And for the more realistic cases, the mixed beam could help detect bowel gas movements and small patient rotations.

The researchers suggest that for anatomical sites subject to slow or non-periodic motion, sequential beams could provide useful information, provided that fast switching of ion sources or beam energy is technically feasible. But when treating moving targets with strong range changes, such as lung tumours, an actual mixed helium/carbon beam would be advantageous.

“Given the potential of the mixed helium/carbon beam, the next step is to generate a real mixed beam, which we are investigating in collaboration with the GSI Helmholtz Centre for Heavy Ion Research and HIT,” Volz tells Physics World. “Long-term, we would like to investigate generating high-resolution online helium radiographs with a mixed beam.”

Quantum diffusion of heavy defects defies Arrhenius’ law

“Massively heavy” atoms can move quantum mechanically within a crystalline material at cryogenic temperatures. This result, from researchers in Japan, France and the UK, contradicts the generally-held notion that only hydrogen or helium atoms are light enough to migrate through materials in this way. The study, which was performed on defect clusters containing around 100 atoms of tungsten (atomic mass 184), represents a step forward in our understanding of the low-temperature dynamics of defects and could lead to new applications in materials science and engineering.

A perfect crystal is a purely theoretical concept. Real-world crystals contain defects that can severely degrade the mechanical properties of the materials in which they occur. Understanding the way these defects diffuse and interact is therefore important for a wide range of processes in materials science and metallurgy, including alloying, precipitation and phase transformations.

Defects are bound to so-called static trapping centres (often atoms of impurities within the crystal), and thus need to “de-trap” before they can travel. For elements heavier than hydrogen or helium, de-trapping is thought to occur by thermal activation, and defect diffusion rates typically obey Arrhenius’ law – a century-old empirical rule that describes how the rate of chemical reactions varies with temperature. In a material at very low temperatures, Arrhenius’ law implies that the transport of heavy-atom defects slows considerably and may even become “frozen”.

Studying self-interstitial defects

Experiments by a team of researchers at Shimane University, Nippon Steel, Nagoya University and Osaka University in Japan, the CEA and CNRS in France, and the University of Leeds and Culham Centre for Fusion Energy in the UK have now turned this idea on its head. The team studied a type of defect that occurs when excess atoms of the same type as the ones that make up the material’s crystal lattice become misplaced within the regular stack. These “self-interstitial atoms” (SIAs) cause distortions and stress in the lattice structure, and the researchers studied how clusters of them moved through a tungsten sample at cryogenic temperatures.

The team created both SIA defects and vacancies – that is, lattice sites with “missing” atoms, which are the counterparts of SIAs – by irradiating the tungsten with a high-energy (2000 keV) electron beam at 105 K. They then aged the sample at 300 K, which allowed the SIA clusters to nucleate, grow to nanometric sizes and bind to trapping centres.

At these temperatures, the researchers note that defects are thermally immobile and remain dispersed throughout the sample. Their next step was to illuminate the sample with a lower energy (100-1000 keV) electron beam. The energy of this second beam is too low to create additional SIAs but high enough to athermally move the vacancies around and cause trapped clusters of SIAs to become de-trapped. This de-trapping can occur via thermal and quantum-mechanical mechanisms.

Quantum transport of heavy defects

By measuring the clusters’ motion frequency using in situ transmission electron microscopy, the researchers say they could distinguish between purely thermal motion and movement caused by quantum-mechanical processes. To their surprise, they found that the quantum-assisted de-trapping of the defects leads to low-temperature diffusion rates that are orders of magnitude higher than that allowed by Arrhenius’ Law.

“Our results show that quantum transport, even of heavy defects, becomes dominant below around one-third of the Debye temperature (which is the approximate temperature below which quantum effects may be observed),” says study lead author Kazuto Arakawa. This behaviour, he explains, stems from the quantization of atomic vibrations of the crystal lattice. These quantized vibrations, known as phonons, drive the stochastic fluctuations of objects that are themselves too heavy to move quantum mechanically – a phenomenon that is likely to hold true for low-temperature defect transport in most crystalline materials.

The new finding will impact a wide range of fields across materials science and engineering – wherever low-temperature processes related to defect transport or diffusion are important, Arakawa says. The term “low temperature” is relative: beryllium, for example, has a Debye temperature of 1280 K, so even at room temperatures, the diffusion of beryllium defects is likely to be a predominantly quantum phenomenon.

Developing materials for extreme environments

Arakawa believes the team’s result could be important for understanding and developing microstructures that work in environments with high levels of radiation and/or mechanical shocks, both of which cause defects to form. It may also be relevant in processes such as the irradiation of semiconductors and superconductors, where defects are generated deliberately to manipulate material properties. Finally, Arakawa thinks it could pave the way for materials-processing techniques that exploit quantum-assisted transport and reactions between defects at temperatures close to absolute zero – something that has never been attempted, let alone achieved.

The work could have even more far-reaching consequences, he adds. Until now, most observations of atomic transport in crystals at cryogenic temperatures were interpreted using Arrhenius’ law. The fact that heavy defects move faster than expected at these low temperatures suggests that the materials-science community may need to revisit and reinterpret previous low-temperature experiments.

“Classic observations performed at cryogenic temperatures – for example, the recovery of electrical resistivity of materials exposed to irradiation near absolute zero, or low temperature internal friction studies – could now be analysed in a completely new light,” Arakawa tells Physics World.

The research is detailed in Nature Materials.

A broader range of experiments

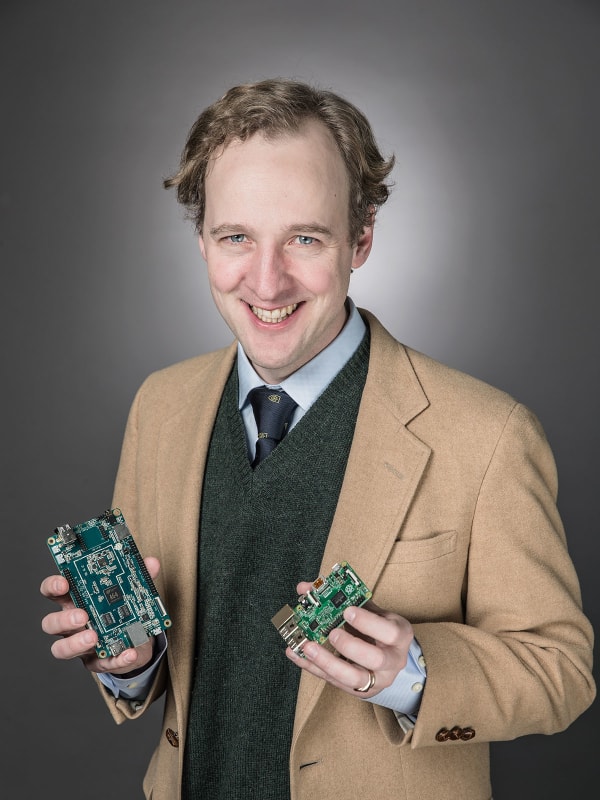
A photo of Anatole von Lilienfeld holding circuit boards

The term “machine learning” means different things to different people. What’s your definition?

It’s a term used by many communities, but in the context of physics I would stick to a rather technical definition. Machine learning can be roughly divided into two different domains, depending on the problems one wants to attack. One domain is called unsupervised learning, which is basically about categorizing data. This task can be nontrivial when you’re dealing with high-dimensional, heterogeneous data of varying fidelity. What unsupervised learning algorithms do is try to determine whether these data can be grouped into different clusters in a systematic way, without any bias or heuristic, and without introducing spurious artefacts.

Problems of this type are ubiquitous: all quantitative sciences encounter them in one way or another. But one example involves proteins, which fold in certain shapes that depend on their amino acid sequences. When you measure the X-ray spectra of protein crystals, you find something interesting: the number of possible folds is large, but finite. So if somebody gave you some sequences and their corresponding folds, a good unsupervised learning algorithm might be able to cluster new sequences to help you determine which of them are associated with which folds.

The second branch of machine learning is called supervised learning. In this case, rather than merely categorizing the data, the algorithms also try to predict values outside the dataset. An example from materials science would be that if you have a bunch of materials for which a property has been measured – the formation energy of some inorganic crystals, say – you can then ask, “I wonder what the formation energy would be of a new crystal?” Supervised learning can give you the statistically most likely estimate, based on the known properties of the existing materials in the dataset.

These are the two main branches of machine learning, and the thing they have in common is a need for data. There’s no machine learning without data. It’s a statistical approach, and this is sort of implied when you’re talking about machine learning: these techniques are mathematically rigorous ways to arrive at statistical statements in a quantitative manner.

You’ve given a couple of examples of machine-learning applications within materials science. I know this is the subject closest to your heart, but the new journal you’re working on covers the whole of science. What are some applications in other fields?

Of course, I’m biased towards materials science, but other domains face similar problems. Here’s an example. One of the most important equations in materials science is the electronic Schrödinger equation. This differential equation is difficult to solve even with computers, but machine learning enables us to circumvent the need to solve it for new materials. Similarly, many scientific domains require solutions to the Navier-Stokes equations in various approximations. These equations can describe turbulent flow, which matters for combustion, for climate modelling, for engineering aerodynamics or for ship construction (among other areas). These equations are also hard to solve numerically, so this is a place where machine learning can be applied.

We have a unique opportunity to give people from all these different domains a place to discuss developments of machine learning in their fields

Anatole von Lilienfeld

Another area of interest is medical imaging. The scanning techniques used to detect tumours and malignant tissues are good applications of unsupervised learning – you want to cluster healthy tissue versus unhealthy tissue. But if you think about it, there is hardly any quantitative domain within the physical sciences where machine learning cannot be applied.

With this journal, we have a unique opportunity to give people from all these different domains a place to discuss developments of machine learning in their fields. So if there’s a major advancement in image recognition of, say, lung tumours, maybe materials scientists will learn something from it that will help them interpret X-ray spectra, or vice versa. Traditionally, people would publish such work within their own disciplines, so it would be hidden from everyone else.

You talked about machine learning as an alternative to computation for finding solutions to equations. In your editorial for the first issue of Machine Learning: Science and Technology, you say that machine learning is emerging as a fourth pillar of science, alongside experimentation, theory and computation. How do you see these approaches fitting together?

Humans began doing experimentation very early. You could view the first tools as being the result of experiments. Theory developed later. Some would say the Greeks started it, but other cultures also developed theories; the Maya, for example, had theories of stellar movement and calendars. All this work culminated in the modern theories of physics, to which many brilliant scientists contributed.

But that wasn’t the end, because many of these brilliant theories had equations that could not be solved using pen and paper. There’s a famous quote from the physicist Paul Dirac where he says that all the equations predicting the behaviour of electrons and nuclei are known. The troubled was that no human could solve those equations. However, with some reasonable approximations, computers could. Because of this, simulation has gained tremendous traction over the last decades, and of course it helps that Moore’s Law has meant that you can buy an exponentially increasing amount of computing power for a constant number of dollars.

I think the next step is to use machine learning to build on theory, experiment and computation, and thus to make even better predictions about the systems we study. When you use computation to find numerical solutions to equations, you need a big computer. However, the outcome of that big computation can then feed into a dataset and be used for machine learning, and you can feed in experimental data alongside it.

Over the next few years, I think we’ll start to see datasets that combine experimental results with simulation results obtained at different levels of accuracy. Some of these datasets may be incredibly heterogeneous, with a lot of “holes” for unknown quantities and different uncertainties. Machine learning offers a way to integrate that knowledge, and to build a unifying model that enables us to identify areas where the holes are the largest or the uncertainties are the greatest. These areas could then be studied in more detail by experiments or by additional simulations.

What other developments should we expect to see in machine learning?

I think we’ll see a feedback loop develop, similar to the one we have now between experiment and theory. As experiments progress, they create an incentive for proposing hypotheses, and then you use that theory to make a prediction that you can verify experimentally. Historically, some experiments were excluded from that because the equations were too difficult to solve. But then computation arrived, and suddenly the scope of experimental design widened tremendously.

I think the same thing is going to happen with machine learning. We’re already seeing it in materials science, where – with the help of supervised learning – we’ve made predictions within milliseconds about how a new material will behave, whereas previously it would have taken hours to simulate on a supercomputer. I believe that will soon be true for all the physical sciences. I’m not saying we will be able to perform all possible experiments, but we’ll be able to design a much broader range of experiments than we could previously.

Cold atoms, a cosmic cold spot, and a tale of Cold War espionage

We often talk about “hot topics” in the podcast, but this week there’s a chill in the air as the Physics World team explores stories about cold stuff.

First up is a discussion of what happens when cold lithium atoms collide with a cold ytterbium ion, as observed by a group of physicists in the Netherlands and described in a recent research paper.

After that, we switch to discussing the “cold spot” in the cosmic microwave background, which was first observed by NASA’s Wilkinson Microwave Anisotropy Probe (WMAP) in 2004 and has been puzzling cosmologists ever since.

We then take a detour into the early years of the Cold War, when the physicist-turned-spy Klaus Fuchs gave the Soviet Union crucial insights into the workings of the first atomic weapons. Fuchs’ story includes many of the trappings of a spy novel, and a new book about his life is a fascinating read – albeit one marred by some annoying editorial lapses.

Finally, the podcast team comes in from the cold with a chat about the strange behaviour of Betelgeuse. The star in Orion’s right shoulder is usually one of the brightest objects in the night sky, but for the past few weeks it’s been much dimmer than usual. Could this dimming be the preamble to a spectacular supernova?

CERN physicists close in on antimatter–matter asymmetry

Physicists have taken another step forward in the search for signs that antimatter behaves differently to matter — and so might explain why the universe appears to consist almost exclusively of the latter. Researchers at the CERN particle-physics laboratory in Switzerland used laser spectroscopy to scrutinize the fine structure of antihydrogen, revealing with an uncertainty of a few percent that the tiny difference in energy of states – known as the Lamb shift – is the same as it is in normal hydrogen.

The fact that the cosmos seems to contain very little antimatter – even though equal quantities of that and ordinary matter should have been produced following the Big Bang – is a major outstanding problem in physics. Generating, trapping and then measuring atoms of antimatter offers a relatively new way of probing this asymmetry. In particular, anomalies in the spectra of antiatoms compared with the known results from ordinary matter could point to a violation of what is known as charge–parity–time (CPT) symmetry.

The ALPHA collaboration at CERN is led by Jeffrey Hangst of Aarhus University in Denmark and is one of the leading groups in the field. It makes atoms of antihydrogen by taking antiprotons from the lab’s Antiproton Decelerator and combining them inside an electromagnetic trap with positrons emitted by a source of radioactive sodium. To be able to study the resulting neutral atoms over extended periods it stores them at the local minimum of a magnetic field created by powerful superconducting magnets, thanks to the interaction of that field with the particles’ tiny magnetic dipole moments.

The ALPHA Collaboration has achieved spectacular progress

Randolf Pohl

ALPHA uses laser beams tuned across a specific range of frequencies to study the energy spectrum of antihydrogen. It has already measured the energy difference between the ground and first excited states (1S and 2S), showing in 2018 that the difference is equal to that of normal hydrogen at a level of one part in 1012. That uncertainty was within three orders of magnitude of the best hydrogen measurements and about five below the level that a theory known as the Standard-Model Extension predicts could reveal CPT-violating effects.

Precision studies

In the latest research, reported in Nature, ALPHA has instead probed fine structure within antihydrogen’s first excited state. It did so by accumulating several hundred cold anti atoms – produced in groups of about 20 every four minutes – and storing these atoms for over two days using a magnetic-field of 1 T. It then used short pulses of ultraviolet light to lift the atoms from their ground state to either the 2P1/2 or 2P3/2 states. As the atoms dropped back down to the 1S state, some (in specific magnetic substates) could no longer be held by the magnetic trap and so annihilated with atoms of ordinary matter in the trap walls.

By identifying peaks in a plot of the number of annihilations against laser frequency, Hangst and co-workers were able to establish the energy gaps between the two 2P states and the 1S state in the presence of the magnetic field. These results had a precision of 16 parts in a billion. Then subtracting the smaller gap from the bigger one, and using theory to work out what the difference would be without a magnetic field, they found that the so-called fine-structure splitting in antihydrogen is equal to that of its matter counterpart to within 2%.

Finally, the researchers subtracted the 1S to 2P1/2 energy from their previously obtained figure for the 1S–2S transition to yield a value for the Lamb shift (the gap between the 2S1/2 and 2P1/2 states). Discovered by Willis Lamb in 1947, this effect arises from the interaction of hydrogen’s electron with quantum fluctuations in the vacuum and was key to the subsequent development of quantum electrodynamics. ALPHA has shown that the Lamb shift in antihydrogen agrees with that of normal hydrogen to about one part in ten.

Writing a commentary to accompany the research, Randolf Pohl at the University of Mainz in Germany says that the ALPHA Collaboration “has achieved spectacular progress” in precision spectroscopy of antihydrogen. Such research, he argues, could in future enable tests of CPT symmetry, quantum electrodynamics and the Standard Model of particle physics.

In particular, Pohl explains that reducing uncertainty in measurement of the Lamb shift to less than one part in 10,000 would allow scientists to demonstrate that the antiproton has a finite charge radius, like the proton. Pushing the uncertainty down even further, he told Physics World, “may eventually help establish CPT violation, if it exists in nature”.

Brain injury diagnosed with a finger prick and an optofluidic chip

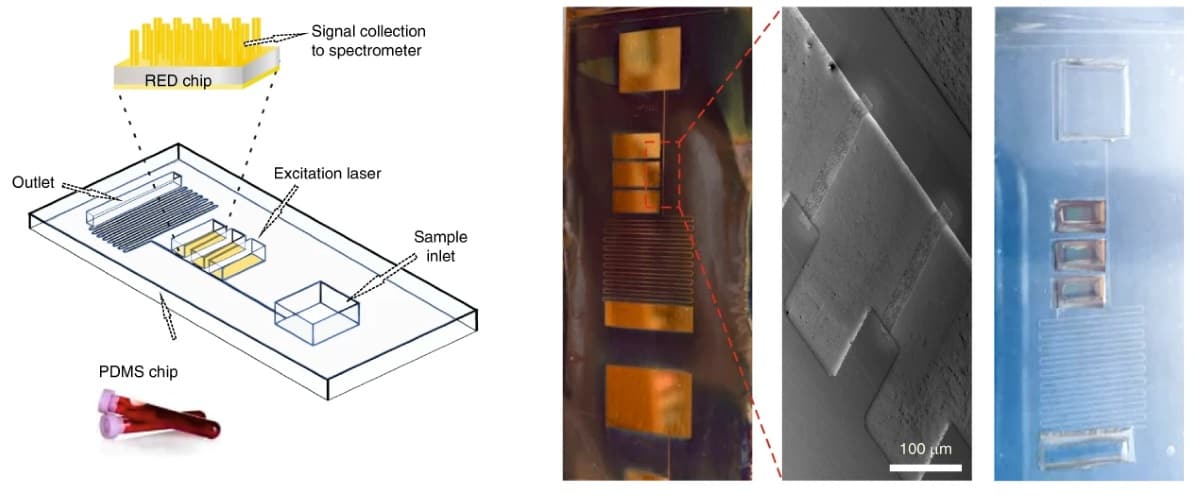
Optofluidic lab-on-a-chip

Researchers in the UK claim to have developed a microfluidic chip that can rapidly tell whether someone has suffered a traumatic brain injury from a finger-prick blood sample. The optofluidic device detects a biomarker linked to brain injury, based on the way that it scatters light (Nat. Biomed. Eng. 10.1038/s41551-019-0510-4).

Identifying a traumatic brain injury – where a head injury disrupts normal brain function – isn’t always easy and time is often critical. But with diagnosis often relying on imaging such as CT and MRI scans, assessing all potential cases can be resource intensive.

To address this, Pola Oppenheimer from the University of Birmingham and colleagues developed a lab-on-a-chip system that assesses levels of a molecule produced by the central nervous system after a brain injury. “The idea is to try to develop a portable point-of-care diagnostic assay that allows us to pick up really early stages, really low concentrations of biomarkers indicating traumatic brain injury,” Oppenheimer tells Physics World.

The device rapidly separates plasma from whole human blood through capillary action. The finger-prick blood sample is added to the chip and then flows along a channel and through a series of combs that filter out red blood cells. The separated plasma then flows into an optical detection area.

The plasma sample is analysed using Raman spectroscopy to detect concentrations of N-acetylasparate, one of the most abundant molecules in the central nervous system. The researchers assessed four potential biomarkers, but decided to focus on N-acetylasparate, as evidence suggests it is an effective, specific indicator of traumatic brain injury.

The team tested the setup using blood samples taken as part of a large study looking at early changes in patients who have suffered a traumatic brain injury. The samples came from 35 people with confirmed severe traumatic brain injury, eight people who had suffered head – but not brain – injuries, and 23 healthy volunteers. In the injury groups, the first blood sample was taken by the ambulance crew at the scene of the accident. Additional samples were taken over the next 48 hours. In total, the researchers tested 221 blood samples.

N-acetylasparate levels were on average more than five times higher in patients with traumatic brain injury immediately after injury, than in the other groups. Concentrations were also significantly higher in the brain injury group compared with patients with head injuries only, eight and 48 hours after injury.

The researchers say that the test clearly discriminated between those with traumatic brain injuries and those with other injuries. Overall, they claim that by testing for elevated N-acetylasparate levels, they were able to identify patients with traumatic brain injury with an accuracy of almost 99% immediately after injury, and around 91% at eight and 48 hours after injury.

As the concentrations are so low in blood plasma, to analyse N-acetylasparate levels using Raman spectroscopy the team had to enhance the spectral readout. To do this, they performed surface-enhanced Raman spectroscopy using special electrohydrodynamically fabricated surfaces for the detection portion of the chip.

The detection surfaces were created by placing silicon wafers between two electrodes. When a voltage is applied to the electrodes the resulting electrical field and electrostatic forces destabilize the smooth silicon wafer, creating a pattern of pillars. By adjusting the nature of the electrical field, this pattern can be precisely controlled and tailored to enhance the light scattering of specific molecules. Once this process is complete, the wafer is given a fine coating of gold.

“We can control the dimensions really nicely, we can control the height and the width and the spacing between the structures, and this allows us to really carefully tune the different morphologies to match the excitation wavelength and get a really good resonance for high signal enhancement,” Oppenheimer explains.

Ultimately the team hopes to create a device that can be used at accident sites to diagnose and triage patients – to help ambulance crews decide which patients to send to major hospitals with neurosurgical facilities.

Oppenheimer tells Physics World that the next step is a medium-sized clinical trial. But she adds that there could be other healthcare applications: “This is quite a versatile technology, so although we validated it for traumatic brain injury, we are now starting work with other diseases.”

The secret to flying carbon-free

A friend of mine recently took his boat across the Atlantic. It was great fun and a real adventure – I particularly loved the photos of dolphins he posted online. But as a practical mode of transport, going by boat just doesn’t cut it in the modern age. Unless, of course, you’re Greta Thunberg, who sailed to New York to make a serious point about the impact of climate change before delivering a powerful speech to the United Nations on the matter.

But when Thunberg was named as Time magazine’s person of the year for 2019, it got me thinking. For all the amazing advances in aircraft technology – flying from Europe to New York is now nearly twice as efficient as going by ship – aviation still has a big environmental problem. Planes spew out carbon dioxide and nitrogen oxides, which form ozone in the upper troposphere. They also emit particulates and leave water-vapour trails, both of which trap heat.

Indeed, the downsides of air travel have led to a rapidly growing “flight-shame” movement, particularly in Europe. In Sweden, for example, passenger numbers are down year-on-year by 11%. A similar fall has occurred in Germany, where the federal government has responded by cutting tax on train travel.

Going green

Thankfully, airlines are seeking to improve their environmental credentials. Last November low-cost carrier easyJet announced it would, from this year, offset carbon emissions from the fuel used for every flight in its network. Other airlines have taken similar steps although none has promised as much as easyJet. The company is also supporting the US start-up Wright Electric, which is producing a range of all-electric planes for short-haul flights.

Airbus, meanwhile, is one of 50 firms to join the Air Transport Action Group (ATAG) – a not-for-profit association that wants to halve the aviation industry’s CO2 emissions by 2050 (compared to 2005 levels). However, these ambitious targets (though I doubt Thunberg would see them as such) cannot be achieved using existing technologies. Members of the ATAG therefore believe that alternative propulsion technologies – including electric and hybrid-electric systems – will be required.

Airbus, along with Rolls-Royce and Siemens, has already developed the E-Fan X – a demonstrator craft in which one of the four jet engines is replaced by a 2 MW electric motor, which has roughly the power of 10 medium-sized cars. When high power is required – at take-off, for example – the system’s generator and battery supply energy together. Unfortunately, today’s batteries are so heavy and bulky that it’s unlikely this plane could be used for long-haul flights, which make up four-fifths of aviation emissions.

The clear winner is hydrogen, which has an energy density of over 140 MJ/kg.

So what’s to be done? Well, we can forget nuclear fuel as a solution: uranium-235 has a huge energy density of 8 x 10⁷ MJ/kg but no-one’s going to want fission-powered planes landing at their local airport and who’d want to get on board in the first place? As for lithium-ion batteries, they have a storage capacity of 0.95 MJ/kg at best – nowhere near the 43 MJ/kg of kerosene. The clear winner is hydrogen, which has an energy density of over 140 MJ/kg. Burning it emits almost no CO2 and few nitrogen oxides. It leaves just a bit of water vapour, which I suspect we can live with.

But hydrogen has problems. It’s highly volatile so you can’t store it in a plane’s wings. Most aircraft designs that use liquid or pressurized hydrogen therefore store it in the fuselage. That in turn means you’d need a larger fuselage (for the same number of passengers) than a conventional kerosene fuelled aircraft, leading to a bigger friction drag and wave drag – and hence higher energy costs.

On the plus side, 1 kg of hydrogen can provide the same energy as 3 kg of kerosene, cutting the gross take-off gross mass of a Boeing 747-400 aircraft from 360 to 270 tonnes. Given that hydrogen is likely to be cost-competitive with kerosene by 2037, I think existing aircraft designs and jet engines could be adapted to run on hydrogen without too much difficulty. Problem is, that date is so far off that, even though kerosene supplies are dwindling, no-one’s in a rush to make the switch fast.

Money matters

What will drive the change to low-carbon flight is economics. Every passenger leaving the UK currently has to pay £26 in Air Passenger Duty (APD) tax for every short-haul flight and £150 for long-haul flights. Introduced in 1993 to offset the environmental impacts of air travel, APD currently brings in £3–4bn to the UK Treasury’s coffers. Ticket prices would only rise further if planes were fitted with hydrogen fuel tanks as these swallow up about a third of the craft’s available passenger space.

To me, shifting the cost of greener air travel to customers is the wrong way of going about things.

To me, shifting the cost of greener air travel to customers is the wrong way of going about things. The EU and UK currently put no tax on aircraft fuel (zero VAT), but if kerosene were taxed it would encourage aircraft manufacturers to develop even more efficient planes and be a catalyst for faster change in the industry. Aircraft and engine makers would also have new revenue streams in the form of refurbishing planes to run on more efficient kerosene engines or even converting existing planes to hydrogen.

According to the UN’s International Civil Aviation, the global air-transport network is expected to double in size by 2030. With 23,000 commercial aircraft in service in 2017, Boeing says we’ll need almost 40,000 new planes over the next 20 years. By 2037 there should therefore be more than 63,000 aircraft in the world. Greener air travel is a problem we need to solve now – not in 20 years’ time.

The challenge is to make hydrogen fuel cleanly and economically and, for me, the only solution is to do so by electrolysing water rather than extracting it from fossil fuels. And if the power used to create, compress or liquefy hydrogen can itself be from carbon-free sources such as renewables or nuclear, then surely hydrogen is the future of carbon-free aviation.

Copyright © 2026 by IOP Publishing Ltd and individual contributors