Despite the advent of radio astronomy in the early 20th century, and the ability to listen to our galactic neighbours, it’s not obvious that anyone wants to be heard, and it’s not obvious that anyone is saying anything. The silence is felt. But this hasn’t stopped scientists entertaining this notion: if there is intelligent life out there, could we understand each other? And if we could, how would we? That’s the crux of science writer Daniel Oberhaus’s new book Extraterrestrial Languages.
Oberhaus gives a comprehensive overview of attempts at designing interstellar messages, contemporarily known as METI (messaging extraterrestrial intelligence) and contrasted with SETI (search for extraterrestrial intelligence). The early endeavours were varied (Morse code, giant solar mirrors), if not outlandish (flaming kerosene-filled craters in the Sahara). But each had value in reflecting the Zeitgeist of the culture that devised it.
More recent ideas include jocular artificial-intelligence chat-bots, self-explanatory computer software and natural language corpora transmitted in binary. Throughout, Oberhaus shows how important both the form and content of METI really are.
Integrating linguistics, philosophy, biology, mathematics and even animal studies, I felt the complexity that a lingua cosmica would rightly entail. Many of the related concepts are easy to understand, such as mathematical Platonism – maths is a language of the universe independent of mind – and the Formalist approach, which says that mathematical phenomena are derived via biased observers.
A mathematical background will therefore help with concepts such as Zipf’s law and Lambda calculus, which, lacking concrete definitions, might disorient readers (though the sizeable appendix will be useful). This doesn’t detract from the accessible tone of the book, however, which touches on landmark attempts at interstellar communication including the Arecibo transmission of 1974, the Voyager 1 and 2 craft launched in 1977, and the Cosmic Call broadcasts of 1999 and 2003 – the latter spurring renewed interest in the search for extraterrestrials.
Each chapter piqued my interest with its technical and practical implications. For instance, Lancelot Hogben’s Astraglossa – the first symbolic system designed for interstellar communication, presented to the British Interplanetary Society in 1952 – raises concerns over whether a message should be self-interpreting given the unfathomable timescales involved in interstellar travel. And, considering the transient nature of human knowledge, how fundamental (i.e. non-human) should the contents of a message be? What would constitute a language of the universe? Each dilemma adds to the “meta” quality of the book, which I found stimulated my reading and was a clear signal of Oberhaus’s scholarship.
The text is meticulously researched and serves as a useful entry to various academic disciplines. Oberhaus swiftly fleshes out each point of contention in METI’s controversial history. This is especially salient in the final chapter on the ethics of METI. Here Oberhaus considers: Is it safe? Is it worth the investment? Who should speak for Earth, and should they tell the truth?
I came away from Extraterrestrial Languages with more questions than answers. But I am sure I won’t be the only reader who will find themselves left with a sense of the nuance and uniqueness of human experience, represented in our attempts at interstellar communication past, present and future.
As part of the Liver4Life project, researchers in Zurich have developed a new machine that can keep livers alive outside the body for up to a week. The development of this machine could reduce waiting times for donor organs and improve the lives of thousands of people on organ waiting lists (Nature Biotechnol. 10.1038/s41587-019-0374-x).
Currently, when an organ is removed from a donor it is flushed with a preservation solution and stored on ice. This will keep it in a good condition for up to 12–18 hours whilst it is transferred to the recipient. However, there is a shortage of healthy organs available for donations and waiting lists can be prohibitively long.
To keep donated livers alive for a longer time, perfusion machines can be used. These keep nutrients flowing through the organ to maintain function. Currently, however, such machines can only keep livers viable for 24 hours when operating around normal body temperature. The Liver4Life project set out to extend this time to one week. To do this, the machine replicates conditions in the body by reproducing key functions.
Replicating the liver’s natural environment
Before trying out their machine with any human livers, the researchers, from University Hospital Zurich, ETH Zurich, Wyss Zurich and the University of Zurich, investigated pig livers. They identified several key functions of the liver that had to be maintained: prevention of red blood cells bursting, glucose metabolism, liver oxygenation, simulation of diaphragm movement and waste removal. All these factors are controlled automatically by the machine, removing the need for physicians to adjust them manually throughout the week.
The machine provides pulsing blood through an artery of the liver, mimicking natural blood supply. This pulsing of the blood flow is essential to prevent red blood cells from bursting, which can damage the liver. Through the blood, the machine delivers nutrients and controls glucose levels and oxygenation, monitoring their levels using a series of sensors.
To remove the waste products produced, the team incorporated a dialysis unit to the machine, which uses an algorithm to automatically adjust the flow and control the concentration of red blood cells.
Finally, in addition to nutrients, the liver also needs to be kept constantly moving to prevent tissue death. To simulate the movement caused by the diaphragm, the team placed a balloon below the liver to create automated movement.
Infographic describing some of the functions designed to replicate the conditions of the body. (Credit: USZ)
The researchers tested the machine’s effectiveness using 10 poor-quality human livers. After one week, six of the original livers maintained their health, and some even recovered to some extent from any injuries caused by the preservation technique.
Success could change lives
“The success of this unique perfusion system – developed over a four-year period by a group of surgeons, biologists and engineers – paves the way for many new applications in transplantation and cancer medicine helping patients with no liver grafts available,” explains senior author Pierre-Alain Clavien.
Extending the window of viability for donated livers could enable poor-quality livers to be repaired for transplant in the future. The next step for the project is to use organs kept alive by the machine for transplant.
If you’re studying physics, you’ll have endless career opportunities to pick from once you graduate. So if you’re weighing up what to do next, the latest annual Physics World Careers guide is here to help you plan your best route – and perhaps introduce you to options you’d never thought of before. The free-to-read 102-page digital guide includes advice on career development, case studies showcasing different paths in academia and industry, as well as a comprehensive directory of employers looking to hire physicists just like you.
If it’s a further foray into academia you’re after, with a master’s or PhD in your sights, then we can help you pick the perfect postgraduate topic. If research into data science and high-energy physics is what you’re interested in, read our interview with CERN openlab’s Federico Carminati, as he lays out the future of particle physics and computing. Don’t forget to follow up with data-science employers, such as Tessella and TPP, which are looking to hire physicists.
And if you’ve still got a long way to go before you graduate, check out the career-development article on “Going the extracurricular mile”, which explores the benefits of finding a placement or internship to see what kind of career might best suit you and your skills.
I hope you find Physics World Careers 2020 useful. And if you want even more, do sign up for our careers newsletter. Sent once every two months, it brings you a mix of case studies, careers advice and practical information from leading employers you might be interested in working for. To sign up, simply sign in to your free Physics World online account and tick the “Careers bimonthly” box.
The built-in RGB camera in a modern smartphone can be used to create a hyperspectral imaging system for analysis and monitoring of skin features. Ruikang Wang and Quinghua He from the University of Washington suggest that the ability to produce images comparable to those from expensive hyperspectral imaging systems may eventually enable widespread use of smartphone-based hyperspectral imaging in low-resource settings and rural areas (Biomed. Opt. Express 10.1364/BOE.378470).
In a hyperspectral image, each pixel contains information regarding a series of narrow wavelength bands. Hyperspectral imaging can be used to determine levels of chromophores with skin tissue – such as haemoglobin and melanin, for example – generating data that help differentiate melanomas from pigmented skin lesions. Variation in melanin may be seen in some skin cancers, nevus and skin pigmentation, while haemoglobin concentration may indicate vascular abnormalities and inflammation.
Hyperspectral imaging systems have been in clinical use for decades, but have a complex design, are expensive and generally limited to use in clinical laboratories. Today’s smartphones typically incorporate RGB cameras with 8 to 12 million pixels and are capable of high-speed photography. To exploit this capability, Wang and He applied Wiener estimation to transform RGB images captured by smartphone cameras into “pseudo”-hyperspectral images with 16 wavebands covering 470–620 nm. They processed the reconstructed hyperspectral images using weighted subtractions between wavebands to extract absorption information caused by specific chromophores, such as haemoglobin or melanin, within skin tissue.
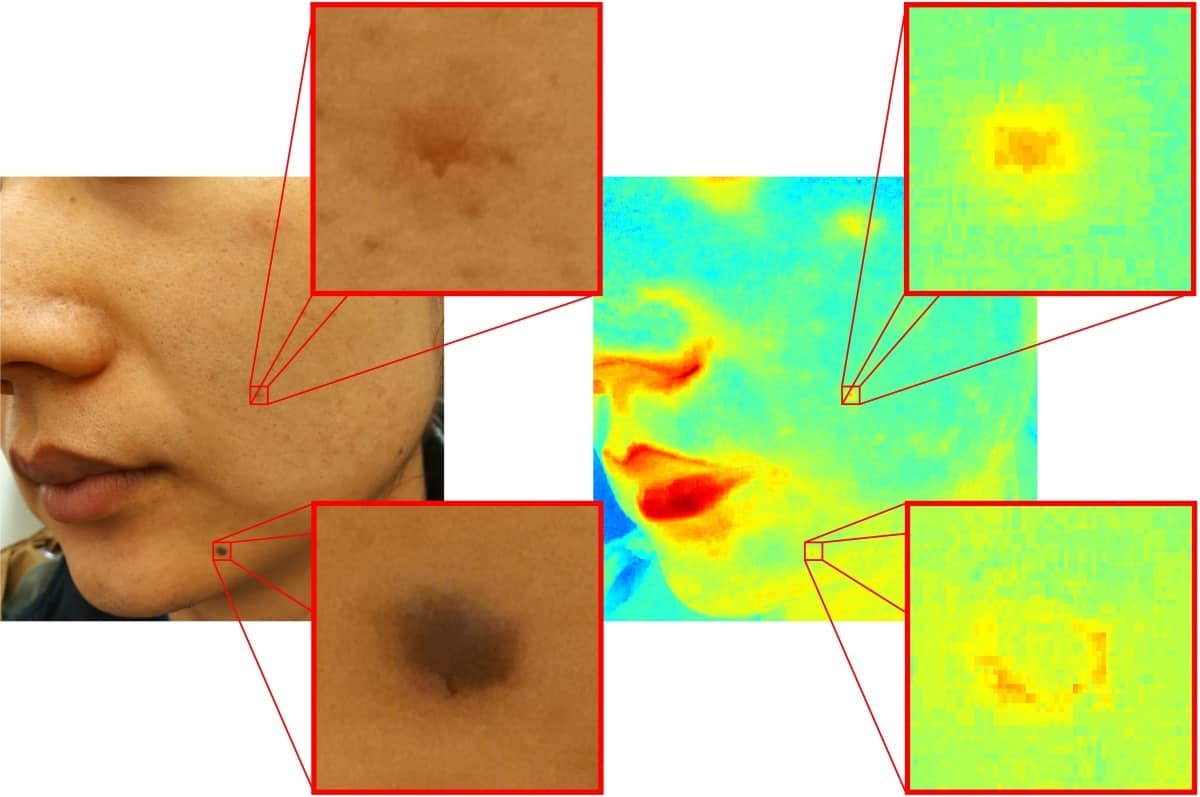
The researchers captured images from two volunteers with redness and moles on their facial skin. They also acquired images in the dark, using the smartphone camera’s built-in flashlight or a fluorescent lamp as illumination sources. Both light sources worked equally well, demonstrating flexibility in terms of using different illumination conditions.
Left: a standard RGB image from a smartphone and magnified details of acne and a mole. Right: blood flow mapping and magnified details. (Courtesy: Ruikang Wang)
As blood vessels are localized within relatively deep skin tissue, light with a longer penetration depth is suitable for detection. To extract spatial haemoglobin absorption information, the researchers therefore applied weighted subtractions between green and red wavebands. Melanin, on the other hand, exists in superficial skin layers, so they extracted melanin absorption data using weighted subtractions between blue and green bands.
Comparing the melanin absorption data with results from a snapshot hyperspectral camera showed that the absorption map created from the smartphone exhibited much better image resolution, because the smartphone camera has many more pixels than the snapshot camera.
Wang and He also examined whether it is possible to evaluate heart rate from a time series of blood information maps, by monitoring changes in blood absorption intensity in the skin. Using a fixed support to keep facial skin stable, they recorded a smartphone video under flashlight illumination.
They extracted the blood absorption map from every frame in the video and summed the signals for each frame. By Fourier transforming the temporal data, they created a plot in the frequency domain and identified a main frequency peak around 1.05 Hz. This matched the 1.05 Hz heart-beat frequency recorded by a pulse sensor for reference.
The researchers also tested the smartphone’s ability to monitor vascular occlusion, by recording images of a volunteer’s finger with pressure from a rubber ring applied for 60 s to create a vascular occlusion. The smartphone video recorded this skin vascular occlusion, as well as restoration of the finger to normal state.
“Compared with conventional hyperspectral imaging systems, which mostly rely on lasers or tunable optical filters, the smartphone-based hyperspectral imaging system eliminates the internal time difference within frames, greatly improving the imaging speed and immunity to motion artefacts,” the researchers write. “Most importantly, our strategy does not require any modification or addition to the existing smartphones, which makes hyperspectral imaging and analysis of skin tissue possible in daily scenes out of labs.”
“In addition to future clinical applications, we envision that smartphone imaging could provide excellent impact on cosmetic consumers and also for the cosmetic industry,” comments Wang.
Wang and He tell Physics World that they are currently developing a smartphone-based app to provide information about blood perfusion, pigmentation, and porphyrin-containing bacteria and collagen content of the skin. They are also currently enrolling a mix of volunteers with various skin colours to check whether there is any skin-colour dependence in the results from their hyperspectral imaging system.
Researchers have efficiently harvested the kinetic energy of falling water droplets for the first time. The team, led by Zuankai Wang at the City University of Hong Kong, demonstrated the conversion through a device that both generates a current and charges a polymer surface as it is hit by falling droplets. Their technology could become an important source of renewable energy, capable of generating electricity in a wide variety of situations (Nature 10.1038/s41586-020-1985-6).
The motion of water, particularly in rivers, has long been an important source of renewable energy. Currently, this hydroelectricity is mostly produced through electromagnetic generators, but these are incredibly bulky, and become highly inefficient when water supplies are low. Alternatively, recent studies have attempted to harvest the kinetic energy of water using electrets – materials that remain charged for indefinite periods of time and can become charged through electrostatic interactions with water. So far, however, this technique has proven to be highly inefficient.
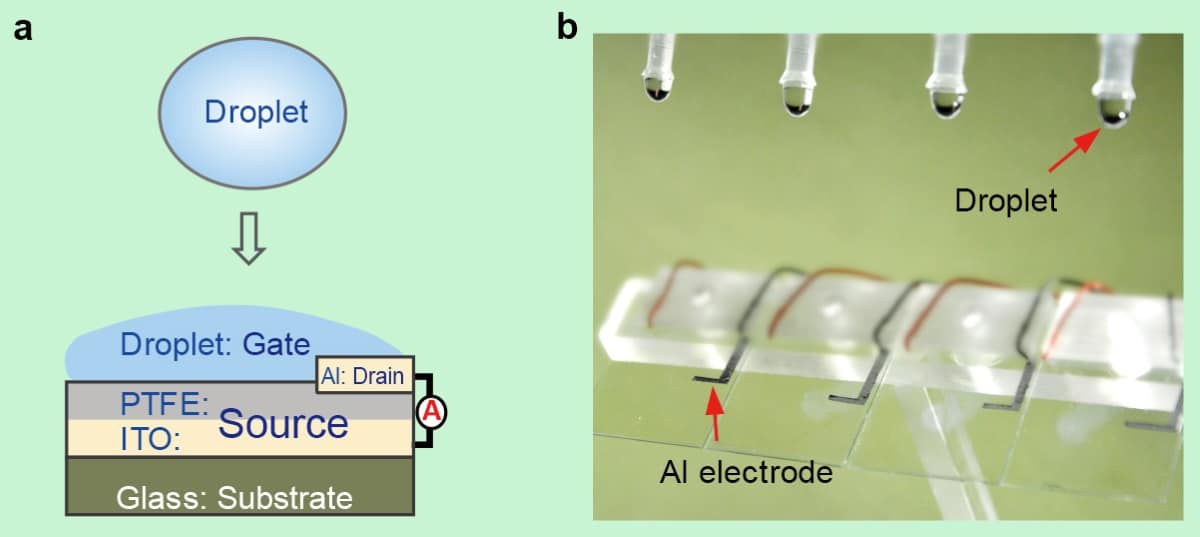
Wang’s team proposed that this performance could be improved through the use of the electret polymer material PTFE, which is known to be a highly stable reservoir for storing densely packed charges. In the researchers’ droplet-based electricity generator (DEG), PTFE is deposited onto a layer of indium tin oxide (ITO), itself deposited onto a glass substrate. Furthermore, the ITO coating is wired to a tiny aluminium electrode, separated from the PTFE by a small gap.
(a) Schematic of the droplet-based electricity generator (DEG). (b) Image showing four parallel DEG devices fabricated on the glass substrate. (Courtesy: City University of Hong Kong/Nature)
As falling droplets hit the DEG, they spread out across its PTFE surface, imparting an electrical charge. In addition, the interaction temporarily bridges the gap between the aluminium electrode and the PTFE/ITO electrode, creating a closed-loop circuit. Since the PTFE’s charge generates an equal and opposite charge in the ITO layer, this allows charges to migrate to the aluminium electrode, generating a current. Then, as the droplet slides off the surface, its area shrinks. This reverses the direction of this current, fully restoring charge to the ITO layer, so the cycle can repeat. After around 16,000 droplets, the PTFE’s surface charge saturates, and the effect stabilises.
By fine-tuning factors including the film thickness, Wang’s team achieved a peak power density of over 50 W/m2 before saturation; as well as an average energy conversion efficiency of 2.2%. Both of these values are thousands of times higher than those reachable in previous electret-based generators – significantly enhancing the DEG’s output voltage and current. Through their experiments, the researchers showed that when just four 100 μl droplets were dropped onto their device from heights of 15 cm, it could power 400 commercial LEDs to light up instantaneously.
Since the DEG harvests electrical energy purely from the kinetic energy of water, the team’s approach could greatly expand the range of possible applications of hydroelectricity. For the first time, the device opens up routes to the generation of renewable energy from sources where water impinges on surfaces periodically – including raindrops and ocean waves. Through longer-term improvements, Wang and colleagues hope that their technology could be applied to surfaces as far-ranging as the hulls of boats, the surfaces of umbrellas and the insides of water bottles.
Over the last 20 years I must have spoken to more than 400 school pupils who want to study physics here at the University of Manchester. One subject that regularly comes up at interview is Young’s double-slit experiments, which clearly interest my prospective students. But when I ask them what the experiments are all about, I’m invariably told they involve using electrons to demonstrate wave–particle duality – one of the cornerstones of quantum physics. That’s curious because Thomas Young performed his experiments in 1804 – long before we knew anything about electrons or the subatomic world.
Young’s original double-slit experiments were in fact the first to demonstrate the phenomenon of interference. When he shone light through two narrow slits and observed the pattern created on a distant screen, Young didn’t find two bright regions corresponding to the slits, but instead saw bright and dark fringes. He explained this unexpected observation by proposing that light is a wave, in opposition to Newton’s idea that light is made of particles. These experiments, and their subsequent explanation, culminated in the classical laws of radiation enveloped by James Clerk Maxwell’s famous equations.
From Young’s double slits to wave–particle duality
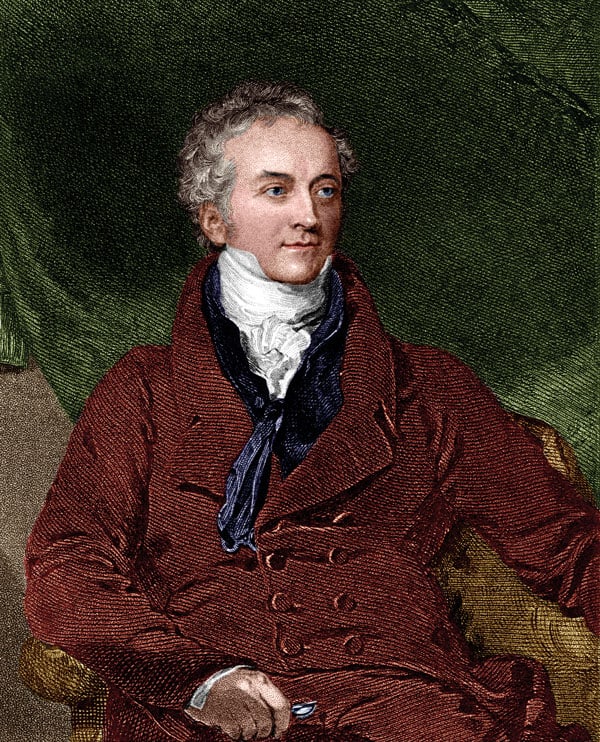
Wave pioneer: Thomas Young. (Courtesy: Sheila Terry/Science Photo Library)
The remarkable success of the wave theory of light, inspired by Thomas Young’s original double-slit experiments of 1804, was marred by two later observations that did not fit the theory. One was the measurement of the radiation density emitted by a blackbody, which could not be explained using the accepted laws of radiation formulated by Lord Rayleigh and James Jeans – the so-called “ultraviolet catastrophe”. This problem led Max Planck in 1900 to develop an alternative theory, which assumed blackbody radiators have discrete (quantized) energies, from which he successfully predicted the experimental data.
The second problem was the photoelectric effect – that light can kick out electrons from a material but only if it’s above a certain frequency. Extending Planck’s ideas, Albert Einstein was able to explain this phenomenon by predicting that the radiation is quantized. This insight also let him predict that the intensity of light depends on the rate at which these particles of fixed energy (later called photons) are detected. Wave theory, in contrast, stated that the intensity should be proportional to the square of the amplitude of the wave. Further work by Ernest Rutherford and Niels Bohr in Manchester led to the development of the “old” quantum theory, which explained the structure of atoms and why their spectra were discrete.
Several years later, Louis de Broglie suggested that if light can be considered as having both wave- and particle-like properties, then perhaps matter also has a dual nature. Experimental evidence supporting this soon followed, from which Erwin Schrödinger, Werner Heisenberg and Paul Dirac developed the modern form of quantum mechanics we use today. Only in the 1960s did the link between Young’s double-slit experiment and wave–particle duality become clear when it was carried out for the first time with an electron beam.
The link between Young’s experiments and wave–particle duality only became obvious last century once the basics of quantum mechanics had been firmly established (see box above). The story began in 1961 – more than 130 years after Young’s death – when Claus Jönsson from the University of Tübingen in Germany machined a set of slits 300 nm wide into copper and then irradiated them with a 40 keV beam of electrons from an electron microscope (Z. für Physik161 454). The resulting images showed an interference pattern, just as Young had first seen with light 160 years earlier. This first double-slit experiment with electrons indicated that an electron beam behaves as a wave. But since Jönsson couldn’t create or measure individual electrons, he couldn’t prove that each electron itself has a wave-like character.
In 1965 Richard Feynman then gave a now-famous series of lectures at the California Institute of Technology, in which he discussed how single electrons fired at a double slit would, in principle, produce an interference pattern – thereby demonstrating the dual wave–particle nature of matter. Feynman did not think his thought experiments would ever be possible, but over the next few decades, advances in manufacturing techniques gradually brought this prospect closer. Eventually, in the mid-2000s Stefano Frabboni and co-workers in Italy demonstrated interference with electrons passing through slits just 83 nm wide (2007 Am. J. Phys.75 1053 and 2008 Appl. Phys. Lett.93 073108).
Using an electron microscope operating at 200 keV, Frabboni and his team were able to reduce the beam current to such low levels that they could predict with a very high probability that no more than one electron was between the source and detector at any given time. But because their detector had various limitations, they couldn’t directly measure interference from single electrons. It was not until 2013 that the first experiments to convincingly demonstrate double-slit interference using single electrons were finally carried out (figure 1).
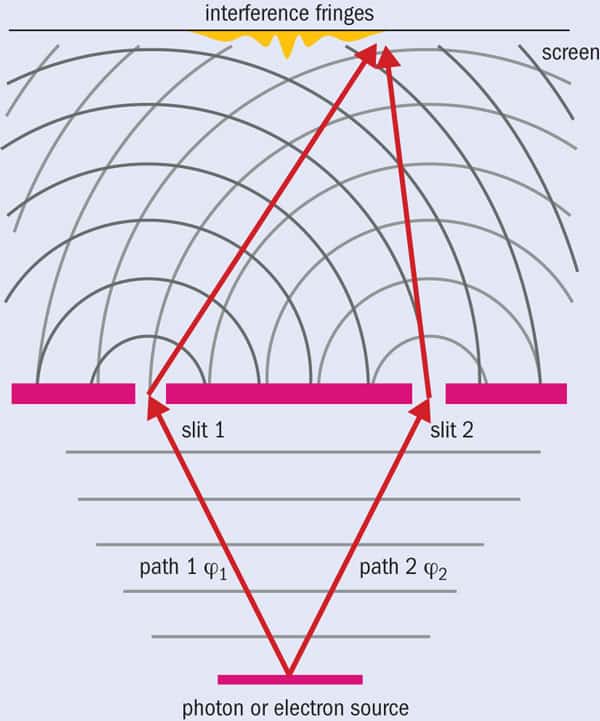
1 Young’s double-slit experiment with single electrons
If you fire single particles, such as photons or electrons, through two slits labelled 1 and 2, the wavefunctions ϕ1 and ϕ2 along each path describe the probability that they will pass through the slits, with the total wavefunction at the detector being ϕdet = ϕ1 + ϕ2. The probability of detecting a particle is then ϕdet2 = ϕ12 + ϕ22 + 2|ϕ1||ϕ2| cos Δξ, where |ϕ1| and |ϕ2| are the amplitudes of the waves and Δξ is their phase difference at the detector. The result is a series of bright and dark bands depending on whether the two wave fronts are in phase (cos Δξ = 1) or out of phase (cos Δξ = –1), meaning either a high or low chance of detecting a particle. But if you close, say, slit 2, then ϕ2 = 0 and you see a distribution of particles due solely to slit 1 (ϕdet2 = ϕ12). If you close slit 1, then ϕ1 = 0 and the distribution is given by (ϕdet2 = ϕ22). You can work out the interference term by measuring the signals from both slits individually, and by then measuring the yield with both slits open.
Working at the University of Nebraska-Lincoln in the US, Roger Bach and co-workers used 62 nm wide slits, through which they fired electrons with a beam energy of just 0.6 keV. This much lower energy, which increased the de Broglie wavelength of the electrons compared with previous experiments, not only produced a wider separation of the interference pattern, but also allowed them to use a channel plate detector that could count single electrons. The experiment also let Bach’s team physically move a mask across the slits so that each could be individually closed, or both could be open.
In these experiments, Bach’s team reduced the intensity of the incident beam so that only one electron was detected each second, thereby guaranteeing (to greater than 99.9999% probability) that only a single electron was present between the source and the detector at any time. The experiment ran continuously for two hours and, initially, the individual electrons appeared to arrive at random points on the screen. But as more and more electrons were detected, an interference pattern with bright and dark regions gradually emerged (2013 New J. Phys.15 033018).
Since each electron was detected before the next was emitted, it clearly could not have influenced future electrons that then passed through the slits. As elegantly stated by Feynman, we therefore have to accept that each electron (and indeed all matter) has both a wave-like nature (to create the interference pattern) and must also be considered as an individual particle (since this is what was detected). It is therefore this double-slit experiment, not Young’s from 1804, that future students at Manchester should be citing when they talk about wave–particle duality.
The new experiments in a single atom
Now if you think that’s about as far as a Young’s double-slit experiment can go, you’d be wrong. In one of those rewarding occasions in science when new discoveries and ideas evolve from seemingly unrelated work, our research group in Manchester recently found an entirely new way to carry out the experiment. The discovery emerged from our studies of the “shape” that atoms adopt when we excite them with laser light and then fire electrons at them. The electrons gain energy as the atoms are de-excited and we catch these scattered electrons at different angles.
We’d known a lot about this “super-elastic” collision process – in fact, we’d studied it for years. But when we used 420.30 nm blue light to excite a particular state in rubidium atoms, known as the 6P state, we were in for a surprise (2019 Phys. Rev. Lett.122 053204). This time we couldn’t find any electrons from the super-elastic collision process. So why, we wondered, was there no signal?
It turns out that the experiment was producing lots of photoelectrons from the laser beam (we could see these even with the incident electron beam off), but they were all at low energies. In fact, these photoelectrons emerged with four different energies in such large quantities that they drowned out the super-elastic signal we were expecting. The photoelectrons came not only from the 6P state, but also from lower states that the atoms could relax back to, including 0.36 eV electrons kicked out of the 5P state (figure 2a).
But what’s this got to do with the double-slit experiment? Well, this is where our new idea came in. We realized that if we fired a second, infrared laser beam with a wavelength of 780.24 nm at the atoms, this light could not only excite the atom to the 5P state, but also ionize the 6P state, producing photoelectrons with an energy of 0.36 eV. This is exactly the same energy as the photoelectrons created when blue light ionizes rubidium atoms in the 5P state.
There are, in other words, two possible paths that produce photoelectrons at this energy (figure 2b). The laser beams effectively “guide” the photoionization process so it goes either through the 5P state with a wavefunction Ψ1 (equivalent to slit 1 in a conventional Young’s double-slit experiment), or through the 6P state with a wavefunction Ψ2 (equivalent to slit 2), or simultaneously via both states. Rather than measuring the intensity of photons or electrons on a screen, we instead count the number of photoelectrons at different angles, θ, relative to the polarization of the laser beams – what’s known as the differential cross-section, DCS(θ).
2 Young’s double-slits with a single atom
(a) Our new version of Young’s double-slit experiment doesn’t involve firing particles through slits but uses lasers to excite rubidium atoms in different ways. Shining blue 420.30 nm laser light excites the atom from the 5S to the 6P state (transition indicated by thick blue arrow). The 6P state then relaxes to two other states (4D and 6S) that in turn relax back to a fourth state (5P) – the relaxations shown by dotted arrows. Additional blue photons (also 420.30 nm wavelength) can then ionize these states, releasing photoelectrons at four different energies (represented by narrow blue arrows), including at 0.36 eV. By using a second, infrared laser at 780.24 nm, we can either excite the rubidium atom to the 5P state or produce a photoelectron from the 6P state (red arrows), also at 0.36 eV. (b) If we set our detector to measure only the 0.36 eV electrons, they come from two possible paths – either via the 6P state ionized by the infrared laser, or via the 5P state ionized by the blue laser. The two paths can be turned on or off, just as we can open or close the slits in a conventional double-slit experiment.
By slightly detuning the frequency of one or other of the lasers, we can turn the pathways on or off, just as we can physically open or close the slits in a conventional Young’s double-slit experiment. Detune the blue laser and you excite only the 5P state, which closes path 2 and gives a photoelectron yield of DCS1(θ) ∝ Ψ12, where θ is the scattering angle. Detune the infrared laser, and you only excite the 6P state, closing path 1 and giving DCS2(θ) ∝ Ψ22. When both lasers are on resonance, both states are excited, and we have to add the wavefunctions to give DCS1+2(θ) ∝ (Ψ1 + Ψ2)2 .
In the same way as for Young’s experiments, we end up with an interference pattern. The interference term DCSinterf(θ) is, in fact, proportional to 2|Ψ1||Ψ2| cos Δχ, where |Ψ1| and |Ψ2| are the amplitudes along each pathway and Δχ is the relative phase shift between the waves at the detector. We can determine DCSinterf(θ) by taking three sets of measurements: one with both lasers on resonance yielding DCS1+2(θ), another with the blue laser off-resonance producing DCS1(θ), and a third with the infrared laser off resonance producing DCS2(θ).
Theory versus experiment
One practical challenge with our new double-slit experiments was finding a way to detect photoelectrons having just 0.36 eV of energy, which is 600,000 times lower than used in the earlier electron-microscope studies. We solved this be carefully eliminating magnetic and electric fields in the experiment that would otherwise have influenced the electrons as they emerged from the atoms, and by building detectors that could select and count single electrons at this energy.
So what did our experiments reveal?
3 From idea to experiment
In our equivalent of Young’s double-slit experiment, we use a beam of rubidium atoms emitted from an oven inside a vacuum chamber. We then fire blue and infrared lasers at the rubidium, feeding the beams vertically into the chamber and rotating their polarization through 360° to determine the number of photoelectrons at different angles. This plot shows the measured “differential cross-section”, DCSinterf(θ), and the “relative phase shift”, Δχ = χ1 (θ) – χ2 (θ) between the two possible ionization pathways that lead to 0.36 eV photoelectrons. If no interference occurred between the pathways, DCSinterf(θ) would be zero, and Δχ would also be 0. The fact that the values are clearly not 0 – and agree with theoretical calculations – shows that the photoelectrons have both wave-like and particle-like properties, thereby confirming wave–particle duality.
If there was no interference between the two ionization pathways – as we’d expect from a classical interpretation of the ionization process – then both the interference term and the relative phase shift should be zero at all angles. But the values were not zero (figure 3). The interference term, for example, varied from –0.14 to –0.56, proving that there was significant interference between the two pathways. The average phase shift, meanwhile, was Δχ = 115°, which is also far from 0. This clearly demonstrated that the individual electrons emerging from each atom must therefore have a wave-like nature, until they are detected as real particles by the detector. In fact, our results were in excellent agreement with calculations carried out by Jonas Wätzel and Jamal Berakdar – two experts in quantum calculations of photo-ionization processes at the Martin-Luther University in Halle, Germany.
Looking to the future, we are now extending and refining our models to study interference in other atoms, for other states and under different regimes. Recently, for example, they’ve been applied to excitation using femtosecond lasers (2019 Phys. Rev. A100 013407). Further theoretical studies show that the interference terms can be dramatically enhanced by choosing atomic states that are close in energy, and indeed there is no reason why the initial state needs to be the ground state – we can equally explore what happens when the process starts with an excited atom. This could help us understand the atmospheres of stars, where the constituent atoms are often in excited states. Further possibilities lie in two-path excitation to highly excited Rydberg atoms, in which the electrons are so far from the nucleus that the atoms are as big as a living cell – and could therefore be used in quantum computers.
The possibilities are limited only by our imagination, which is what makes physics such an exciting and rewarding endeavour.
A new technique that allows researchers to cool ions to ultracold temperatures by placing the ions in contact with an ultracold atomic “buffer gas” has been developed by researchers in the Netherlands. As well as achieving the first experimental detection of quantum effects in collisions between atoms and ions, the research also opens several intriguing new possibilities, such as quantum states comprising both atoms and ions.
Ultracold atomic gases are routinely prepared in laboratories using a technique called forced evaporative cooling. These gases can then be used to cool trapped ions, and physicists had initially hoped that such ultracold buffer gases could cool ions to their quantum ground states. The problem they encountered is that the electric fields needed to trap the ions cause them to oscillate in the trap in a process cause micromotion. This kinetic energy is dispersed in the neutral atoms of the buffer gas, which heats the gas.
After laser cooling was developed in the 1980s, it became possible to cool ions to extremely low temperatures because, as the ions remain isolated from neutral atoms, the technique does not suffer from micromotion. Laser cooling has been used to cool individual ions to their ground state of motion, but unfortunately, isolating the ion sacrifices the potential to explore some intriguing aspects of quantum mechanics. “We can get very cold ions and also very cold atoms,” says atomic physicist Rene Gerritsma of the University of Amsterdam, “so why don’t we let them interact once and see what happens when they start to behave quantum mechanically?”
Heaviest and lightest
In 2012, Vladan Vuletić of Massachusetts Institute of Technology and colleagues showed theoretically that, by increasing the mass of the ion relative to that of the neutral atom, it might be possible to enter the regime at which quantum effects become detectable. “We looked at the periodic table and decided what were the heaviest ion and the lightest atom that we dared to work with,” says Gerritsma. The researchers settled on ytterbium-171 as their ion and as lithium-6 as their atom. They then started working on controlling the shapes of the electric fields in their ionic trap to ensure the ion would behave exactly as they desired in its interaction with the buffer gas and consequently would be cooled as much as possible.
In new work, the researchers demonstrate buffer gas cooling of ions to approximately 100 μK. This is approximately five times lower than the Doppler limit – the coldest temperature achievable by traditional laser cooling. “People used to believe laser cooling could not cool below the Doppler limit,” explains Gerritsma, “but Bill Phillips and other people were awarded the 1997 Nobel Prize for demonstrating that, by taking the quantum mechanics properly into account, you can cool to much lower temperatures.” Gerritsma’s team has not reached the temperatures achievable using this “sub-Doppler” cooling but they have, for the first time, cooled atom-ion mixtures to temperatures at which quantum effects should be detectable.
To look for quantum effects, they considered predictions from theoretical physicist Michał Tomza and colleagues at the University of Warsaw in Poland regarding so-called Langevin collisions, which occur when a colliding atom and ion exchange angular momentum. In classical Langevin theory, angular momentum varies continuously, so the collision rate is independent of angular momentum. However, the Gerritsma’s results showed clear evidence of peaks in the collision rate – evidence that angular momentum was being exchanged in quantized amounts. “I don’t think people are so surprised to see what they see now,” says Gerritsma, “but it’s the experimental breakthrough: we’re right at the border where it becomes quantum and we believe we can get it colder still in the future.” The team is now working to create molecular atom-ion interactions called Feshbach resonances using magnetic fields.
“I think this is a significant advance,” says Vuletić, who was not involved in this latest work. “There’s very interesting physics in studying controlled atom-ion collisions, and for that you need to be cold enough so that only one particular process contributes. The authors have reached this regime and opening this door will be very interesting for future studies. They did everything right and now they just need to overcome some more technical barriers to reach the ultimate limit of the cooling.”
For more than 60 years, physicists have been searching for a miniscule separation of charge within the neutron known as an electric dipole moment. Finding this “neutron EDM” would be a major discovery, in part because it could help explain why matter in the universe did not simply become annihilated along with antimatter at the dawn of time. For the moment this dipole remains hypothetical, but new results obtained after painstaking observations of cold neutrons give us a better idea of just how small it would have to be – lowering the previous upper limit by 40% (arXiv:2001.11966).
Although the neutron has no overall charge, a conundrum that has long baffled physicists suggests the particle nevertheless contains a region that is very slightly positive and another that is ever so slightly negative. That problem is the imbalance of matter and antimatter in the cosmos. The imbalance could be explained via the existence of processes that violate what is known as charge conjugation parity (CP) symmetry, but such violation within the Standard Model of particle physics is too limited to account for the overwhelming dominance of matter that we see around us.
Pointing the way
According to Dave Wark of the University of Oxford in the UK, who was not involved in the latest work, a neutron EDM would be “a signpost” of new physics beyond the Standard Model that might account for the matter-antimatter imbalance. That’s because the phenomenon would violate temporal (T) symmetry, and in turn CP-symmetry (the combined CPT being invariant). While a neutron’s spin magnetic moment would change when the flow of time is reversed, an EDM, if it existed, would not – meaning that the relationship between the two properties would change under such a reversal. (This is also true of other particles, and indeed some groups are hunting a possible electron EDM.)
In searching for the tiny putative effect, physicists rely on the fact that an EDM would cause a neutron’s spin axis to rotate when exposed to an electric field. To pick out this rotation they first place neutrons in a constant magnetic field, which itself sets the spin axes rotating. They then measure the particles’ precession frequency and do so again after applying a large electric field. If the neutrons really do have an EDM then their precession frequency should shift in line with the electric field strength.
Modern experiments use what are known as “ultra-cold” neutrons. These have such a low energy that their de Broglie wavelength is much longer than the distance between atoms, allowing them to be confined inside a material container over relatively long periods of time – typically several minutes. This increases experimental sensitivity. The most precise measurement until now had been made using neutrons from a reactor at the Institut Laue–Langevin (ILL) in Grenoble, France.
In 2006 a group of physicists from the ILL and the University of Sussex and Rutherford Appleton Laboratory in the UK reported an upper limit for the EDM of 2.9 × 10⁻²⁶e cm. That result was then modified very slightly in 2015 – to 3.0 × 10⁻²⁶e cm – after a more detailed analysis of the data by a larger group of researchers.
The latest research has been carried out by a pan-European collaboration led by Guillaume Pignol of the University of Grenoble and Philipp Schmidt-Wellenburg of the Paul Scherrer Institute near Zürich. The new group reused much of the apparatus from the earlier work – which is operated at room temperature – but this time took its neutrons from a spallation source at the Paul Scherrer Institute. It also did more to reduce systematic errors.
As was the case before, the researchers stored neutrons in a chamber also containing atoms of mercury vapour. By measuring the ratio of precession frequencies of the two types of particle they could largely cancel out the effects of any fluctuations in external magnetic fields. But just to ensure they could understand and control the magnetic field as far as possible they also installed a set of caesium magnetometers above and below the chamber. Pignol, Schmidt-Wellenburg and colleagues were able to reduce systematic errors by a factor of five compared to the 2015 result. Collecting data between 2015 and 2016, and performing a series of blind data analyses, they settled on a new, lower upper limit for the neutron EDM of 1.8 × 10⁻²⁶e cm.
Pushing the limit
To push the limit further down, researchers have been developing a cryogenic version of the experiment. The idea is to cool neutrons by scattering them off atoms of superfluid liquid helium, so boosting the density of ultra-cold neutrons as well as allowing longer storage times and higher electric fields. Wark says that this approach could yield sensitivities hundreds of times higher than is possible now, providing, he adds, that systematic errors can be controlled “to such a spectacular level”. Wark adds that the ILL group installed such an experiment but “were unable to get all the many parts of it working simultaneously for long enough to make a sensitive measurement”.
That potentially leaves the door open to a US collaboration building a cryogenic experiment at the Oak Ridge National Laboratory in Tennessee, which may start data-taking in 2023.
An ongoing investigation into the novel coronavirus (2019-nCoV) outbreak has characterized the most common CT findings associated with the virus and identified possible markers of disease progression several days after the onset of symptoms. The findings were published online 6 February (Radiology 10.1148/radiol.2020200274).
The researchers from the US and China examined the imaging findings and clinical data of 51 patients who were admitted to the Shanghai Public Health Clinical Center and confirmed via DNA testing to have 2019-nCoV.
All of the patients underwent at least one CT exam and all but one had some contact with individuals from the city of Wuhan. The median age of the patients was 49 years and roughly half were women. The most common symptoms were fever (96% of patients), cough (47%) and fatigue (31%).
The group, led by Yuxin Shi, identified bilateral ground-glass opacities on the CT scans of almost 90% of the patients – by far the most common imaging finding – confirming reports from earlier studies.
CT scans of a 71-year-old male with the novel coronavirus showing ground-glass opacities with consolidation and reticular and/or interlobular septal thickening upon admission (a), two days later (b) and four days later (c). A chest X-ray obtained six days after admission shows diffusely increased opacities in both lungs (d). (Courtesy: RSNA)
To be specific, the ground-glass opacities were classified as pure in 77% of the cases, associated with interstitial and/or interlobular septal thickening in 75% of the cases, and associated with consolidation in 59% of the cases. In addition, the opacities involved the peripheral lungs in 86% of the patients and the posterior lungs in 80%. They also found that 80% of the patients’ CT scans showed bronchograms and 55% had a consolidation lesion.
Overall, the most common CT findings for 2019-nCoV coincided with the most common findings for other viruses, including the 2009 swine flu virus (H1N1). The distinguishing characteristic for 2019-nCoV was that the imaging findings tended to appear simultaneously in the same patient, with predominant distribution in the posterior and peripheral part of the lungs.
Furthermore, the researchers characterized disease progression for 2019-nCoV by comparing CT features from the first four days of symptom onset to those after the fourth day. Their comparison uncovered a statistically significant increase in the total number of lung findings over time (p = 0.02).
Most prominently, the proportion of ground-glass nodules with consolidation increased from 21% of the lesions in the first four days after symptom onset to 61% after the fourth day (p < 0.001). This statistically significant increase in the percentage of lesions with consolidation was also evident in older patients (50 years or older): 45% of the lesions showed consolidation in the older patients, compared with only 23% in the younger patients (p < 0.001).
This increase in lung consolidation as the disease extended its course indicates that “consolidation lesions could [serve] as a marker of disease progression or more severe disease,” Shi and colleagues wrote.
Finally, the high prevalence of bilateral organizing pneumonia in the patient cohort points to corticosteroids as a viable option to manage 2019-nCoV pneumonia, they concluded.
Terahertz radiation has been used to reduce the timing jitter of ultrashort pulses of relativistic electrons. This was achieved independently by two teams, one in China led by Dao Xiang at Shanghai Jiao Tong University and the other in the US led by Emilio Nanni at SLAC National Accelerator Laboratory. Their work could allow researchers to generate high-quality electron beams at far lower costs than current radio-frequency (RF) techniques, allowing for advanced studies of atomic-scale structures and femtosecond-scale processes.
Electron beams comprising ultrashort pulses are rapidly advancing the capabilities of today’s most cutting-edge imaging techniques. Currently, they are generated using RF techniques, which can compress bunches of electrons so that their “heads” and “tails” are separated by less than 10 fs as they move. Yet as researchers’ demands for ever shorter and brighter pulses continue to grow, the RF equipment used to generate them is barely keeping up. Not only is the apparatus bulky and expensive; it causes the distribution of pulse arrival times at a target to become spread out, increasing the timing uncertainty, or jitter, of the beam. So far, this has hindered the progress of many studies requiring the best possible ultrashort pulses.
Velocity boosts
Using similar approaches, both Nanni’s and Xiang’s teams discovered that bunches of electrons produced by a photocathode can be compressed, and their timing jitter reduced, by replacing RF signals with terahertz waves. Their setups included two terahertz sources that are linearly polarized in parallel directions. The waves interact with electron bunches as they pass through two separate waveguides. During this interaction, each pulse imparts velocity boosts that increase as the beam passes through. This compresses the electron bunches by speeding up their tails more than their heads. In addition, since the same laser is used to drive the photocathode and both terahertz sources, each radiation-bunch interaction is highly synchronized, reducing the jitter of the beam.
In each case, beams were compressed to lengths of under 40 fs – not quite as short as those reachable through RF structures used today for electron pulse generation. However, the jitters produced in both studies were reduced to just around 30 fs – a significant improvement on previous techniques. All the while, the apparatus necessary for this is far more affordable than today’s bulky RF-based generators.
Although the teams did not collaborate, their similar methodologies both clearly demonstrated the unprecedented timing resolution afforded using terahertz radiation. With further improvements, their approach could soon satisfy the growing demand for intense, ultrashort electron beams. Possible applications include ultrafast electron diffraction, which can be used to capture images of atomic-scale structures. It could also be used to study the femotosecond-scale processes that play out within materials including semiconductors, yielding important new insights into their physics.



 If you’re studying physics, you’ll have endless career opportunities to pick from once you graduate. So if you’re weighing up what to do next, the latest

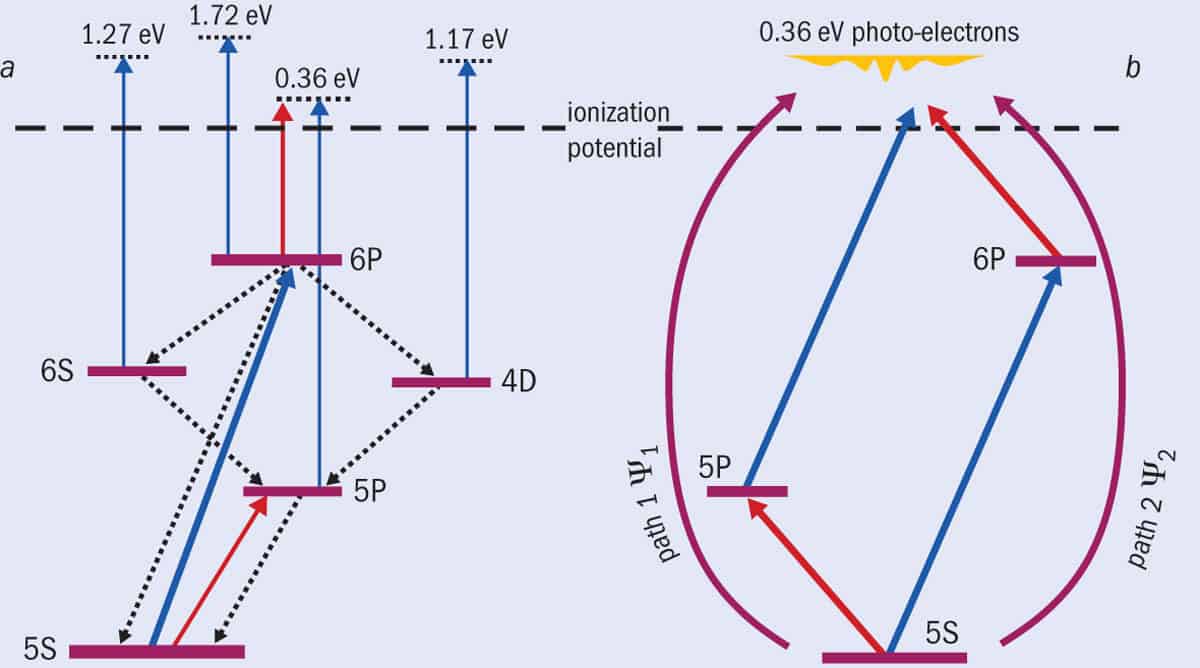 (a) Our new version of Young’s double-slit experiment doesn’t involve firing particles through slits but uses lasers to excite rubidium atoms in different ways. Shining blue 420.30 nm laser light excites the atom from the 5S to the 6P state (transition indicated by thick blue arrow). The 6P state then relaxes to two other states (4D and 6S) that in turn relax back to a fourth state (5P) – the relaxations shown by dotted arrows. Additional blue photons (also 420.30 nm wavelength) can then ionize these states, releasing photoelectrons at four different energies (represented by narrow blue arrows), including at 0.36 eV. By using a second, infrared laser at 780.24 nm, we can either excite the rubidium atom to the 5P state or produce a photoelectron from the 6P state (red arrows), also at 0.36 eV. (b) If we set our detector to measure only the 0.36 eV electrons, they come from two possible paths – either via the 6P state ionized by the infrared laser, or via the 5P state ionized by the blue laser. The two paths can be turned on or off, just as we can open or close the slits in a conventional double-slit experiment.
 In our equivalent of Young’s double-slit experiment, we use a beam of rubidium atoms emitted from an oven inside a vacuum chamber. We then fire blue and infrared lasers at the rubidium, feeding the beams vertically into the chamber and rotating their polarization through 360° to determine the number of photoelectrons at different angles. This plot shows the measured “differential cross-section”, DCSinterf(