Multishelled fullerenes beat graphene at catalysing water splitting

Moving from flat to curved catalytic carbon supports could help reduce the amount and cost of platinum needed for hydrogen production in water splitting. In a new study published in Nature Energy, aimed at improving the efficiency of electrocatalytic processes, a team of scientists led by Li Song and Jun Jiang from the University of Science and Technology of China (USTC) used platinum decorated spherical onion-like carbon (OLC) catalysts with platinum atoms deposited on their outermost surface instead of flat graphene supports. This method reduced the amount of platinum atoms otherwise needed by about 75% while maintaining or improving the rate of the electrochemical hydrogen production process.

Catalysts and Energy

Energy is the fuel for growth and life. Despite centuries of over-reliance on fossil-based energy sources with devastating effects on the planet, more environmentally friendly and renewable options keep emerging as suitable alternatives.

Hydrogen generation by water splitting has long attracted attention due to its zero-emission advantage. Water splitting or electrolysis is a technique employed in decomposing water molecules into hydrogen and oxygen by the passage of an electric current. It requires excess energy to overcome the reaction’s activation barriers; hence, it requires catalysts to increase the efficiency of the chemical process.

Synthesizing spherical carbon supports

In this novel approach, the researchers created OLC supports by treating surface-oxidized nanodiamonds at various temperatures to deoxygenate them. This treatment transformed the nanodiamonds into OLCs at temperatures above 900 °C. They then dispersed platinum (Pt) atoms onto the spherical carbon supports by the atomic layer deposition method, which avoids clustering. Annealing the oxidized nanodiamonds at 1500 °C resulted in multishelled spherical graphene structures – that is, fullerene. These OLC particles have a diameter of about 5 nm and interlayer distances of 0.35 nm.

Reduced amount of platinum

These optimized OLC electrocatalysts utilize only 0.27 wt% Pt to achieve a comparable amount of hydrogen production to that of commercial Pt-carbon catalysts, which have 20 wt% Pt.  Moreover, they improve the hydrogen production rate compared with graphene-supported catalysts with a similar Pt loading.

Complementary computer simulations suggest that the curved carbon structure with platinum atoms deposited on it leads to strong highly localized electric fields. Other researchers have reported similar field enhancements associated with a sharp tip – akin to the effect that makes lightning rods work – in the catalysis of CO2. They suggest the highly localized enhanced electric field makes the water-splitting reaction more efficient.

Immuno-PET could aid patients with inflammatory diseases

© AuntMinnie.com

PET imaging with radiotracers to accurately identify molecules in cancer cells that prevent the immune system from attacking a disease, called immuno-PET, could become an effective tool in assessing inflammatory bowel disease (IBD), according to a preclinical study published in the Journal of Nuclear Medicine.

Australian researchers have shown that immuno-PET has potential in detecting IBD in mice. If successful in human trials, immuno-PET could provide the dual theranostic objective of diagnosing inflammatory diseases while also helping clinicians follow up precision treatment (J. Nucl. Med. 10.2967/jnumed.118.219287).

“Our results provide further evidence of the clinical utility of immuno-PET for IBD diagnosis and monitoring,” wrote lead author Nicole Dmochowska, a doctoral student, and colleagues from the South Australian Health and Medical Research Institute in Adelaide. “Development of these techniques would be of particular benefit to patients who are difficult to scope, including the paediatric population and those that have inflamed or fibrotic regions of the small intestine.”

PET images

The diagnosis and monitoring of IBD, a disease category that includes Crohn’s disease and ulcerative colitis, are critical for many patients. A lack of definitive indications makes it difficult to know when symptoms will reappear, and patients with a long history of IBD run the risk of developing colon cancer.

Currently, IBD assessment is dependent upon endoscopy and colonoscopy, but neither procedure can reach all areas of the small intestine, nor can these procedures provide real-time information on the efficacy of treatment and drugs.

“Therefore, new technologies are required for imaging IBD that are less invasive than endoscopy and can provide information on specific pathologic processes in real-time,” the authors wrote.

What is known is that IBD inflammation activates the body’s natural immune system, which contains immune cells that have the surface receptor CD11b. Those cells secrete IL-1β to generate immune responses.

“However, a direct comparison of antibodies targeted to innate immune mediators and cells has not been done,” Dmochowska and colleagues added. “We aimed to compare immuno-PET of antibodies to IL-1β and CD11b against standard F-18 FDG and MRI approaches to detect colonic inflammation.”

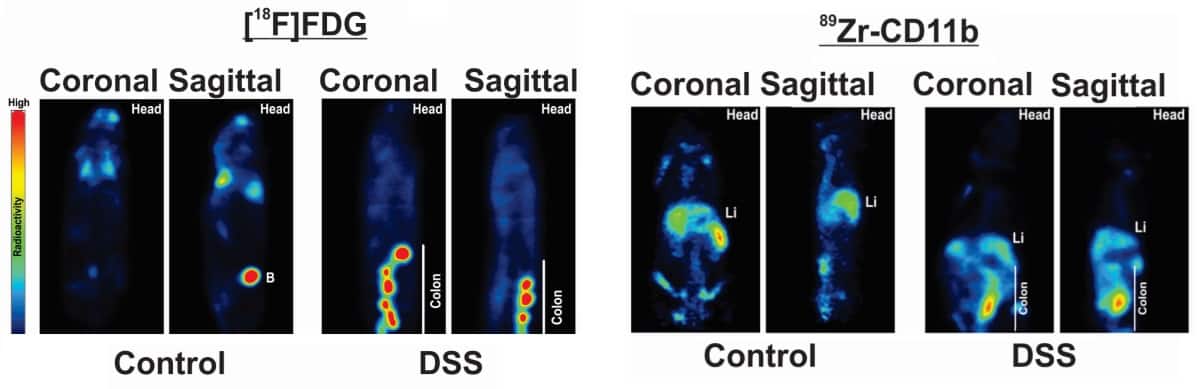
For this study, the researchers looked at two sets of mice: those with ulcerative colitis and a group of age- and weight-matched healthy mice. The team watched the first group daily for signs of acute colitis. They then compared the ability of immuno-PET with zirconium-89 (Zr-89) conjugated antibodies against IL-1β, CD11b, and F-18 FDG, along with MRI, to detect inflammation in colitic mice.

PET images

Immuno-PET images showed that in colitic mice, distal colonic uptake of Zr-89 IL-1β increased by approximately threefold; uptake of Zr-89 CD11b was five times greater, and uptake of F-18 FDG rose by around 3.5-fold. MRI achieved an approximately twofold increase in the T2 signal intensity ratio in colitic mice.

In addition, an ex vivo PET analysis showed the uptake of Zr-89 IL-1β and Zr-89 CD11b increased throughout the entire gastrointestinal tract of the colitic mice, compared with the control mice. Zr-89 IL-1β also was distributed mainly in the gastrointestinal tract, while Zr-89 CD11b spread to more tissue types. Zr-89 IL-1β also correlated with colitis severity, while Zr-89 CD11b showed no such association.

“Our comparison demonstrates the strong potential that immuno-PET of innate immune mediators has for diagnosing and monitoring IBD,” the researchers concluded.

  • This article was originally published on AuntMinnie.com. ©2019 by AuntMinnie.com. Any copying, republication or redistribution of AuntMinnie.com content is expressly prohibited without the prior written consent of AuntMinnie.com.

Compact camera measures light polarization in full

A compact and simple camera that can determine the full polarization of light has been developed by researchers in the US. The device uses a metasurface patterned with nanopillars to split incoming light into its four Stokes polarization parameters and then measures each one simultaneously. The team says that the technology could be used in a wide range of applications including remote sensing and facial recognition.

Put on a pair of polarizing sunglasses – which block horizontally-polarized light – and the world looks a bit different. If you look at the rear windows of some cars for example, you will notice a grid-like pattern that is normally invisible to the naked eye. The glasses are revealing stresses manufactured into the glass to ensure that it shatters safely. This is just one example of how measuring the polarization of light can reveal useful information about a material.

While blocking light of a certain polarization is relatively simple, determining the full polarization of light involves making separate measurements of four “Stokes parameters”. This is normally done using bulky optical systems that have moving parts and limited temporal resolution.

Matrix Fourier optics

To make Stokes measurements easier, Federico Capasso and colleagues at Harvard University have developed a new way of describing how the polarization of light interacts with optical systems. Dubbed “matrix Fourier optics”, the technique was then used by the team to create a nanostructured metasurface of tiny pillars that directs incident light according to its polarization. The metasurface can separate light into its four Stokes components, creating four separate images of an object. These images are then detected simultaneously and the information used to determine the full polarization of the light from the object.

The new device is about 2 cm long and the researchers say that it is no more complicated than a smartphone camera. The team showed that the device can measure the full Stokes polarization of light reflected from a number of different objects. This was demonstrated indoors using artificial illumination and outdoors using daylight.

Depth, texture and shape

“Polarization is a feature of light that is changed upon reflection off a surface,” says Harvard’s Paul Chevalier. “Based on that change, polarization can help us in the 3D reconstruction of an object, to estimate its depth, texture and shape, and to distinguish manmade objects from natural ones, even if they’re the same shape and colour.”

Team member Noah Rubin adds, “This technology could be integrated into existing imaging systems, such as the one in your cell phone or car, enabling the widespread adoption of polarization imaging and new applications previously unforeseen”.

Capasso says that potential applications of the new camera include atmospheric science, remote sensing, facial recognition and machine vision.

The new camera is described in Science.

Text mining could help in the rational design of new materials

Discovering new materials with a particular set of properties can be a slow and inefficient process that involves countless, often “trial-and-error”, experiments by highly trained experts. Materials scientists are now therefore looking to machine learning to help them in their task.

The scientific literature is a real treasure trove in this respect – scientists have been publishing papers for 100s of years and every week dozens more papers come out. Papers are obviously published as text, however, so this collective knowledge is difficult to analyse either by traditional statistical analyses or indeed most modern machine-learning applications, which are “supervised” – that is they need to be trained. Indeed, these programmes require the “hand labelled” input of training data (parameters that define a material’s composition, for example) and a particular output (a material’s electronic properties, for example). At least several hundred materials are needed to construct the training data.

Researchers at the Lawrence Berkeley National Laboratory and the University of California of Berkeley have now found that an unsupervised machine-learning algorithm, called Word2vec, designed to process text and natural language, can learn important materials science concepts by simply “reading” the abstracts of over three million journal articles. The algorithm can identify unreported properties of materials in scientific papers and this literature mining technique could even be used to design new materials in the future, they say.

Information-dense word embedding

The team, led by Anubhav Jain and Gerbrand Ceder, has found that information about material properties in the published literature can be efficiently encoded as information-dense word embedding (numerical representations, or mathematical vectors, of words) without any human labelling or indeed subsequent supervision.

Assigning such embeddings to words in the body of a text in a way that preserves their syntactic and semantic relationships is one of the main techniques in natural language processing (NLP), say the researchers. These word embeddings are usually constructed using machine learning algorithms like Word2vec that make use of information about the co-occurrence of works in a text. When trained on a relevant text, these techniques should produce a vector representing the word “iron”, for example, that is closer to the vector for “steel” than to the vector for “organic”.

The researchers collected 3.3 million abstracts from papers published in the fields of materials science, physics and chemistry between 1922 and 2018. They then processed these to remove papers that were unrelated to inorganic materials science (as determined by a separate machine learning classifier), which left 1.5 million extracts written using a vocabulary of about half a million words.

Positioning each word

They then analysed the texts using Word2vec, which takes a large text corpus and processes it using an artificial neural network to map each word in the vocabulary to a numerical vector, each of which has 200 “dimensions”. Dimensions in this context simply means that each word is represented by a sequence of 200 numbers.

“The key idea here is that words appearing in similar contexts have similar meaning,” explains Jain. These words form clusters within the multidimensional space and Word2vec can then accurately estimate the meaning of words or the functional relationships between them based on the patterns in which the words are employed in the original text.

The researchers found that the algorithm is able to obtain word embeddings that can capture the underlying structure of the periodic table and the crystal structure of metals without being told anything about materials science. It does this by simply analysing the positions of the words in the abstracts and their co-occurrence with other words.

“We found that moving in different directions in ‘word embedding space’ corresponds to adjusting various known atomic properties such as increasing atomic number or increasing electronegativity,” says Ceder. “We are also able to use simple vector addition and subtraction of word embeddings to predict the magnetic properties, crystal structures and symmetries of some materials.”

One example: many words in a text corpus represent chemical compositions of materials and the five materials most similar to LiCoO2 (a well-known lithium-ion cathode compound) can be determined through a dot product (a method to perform multiplication in high dimensions) of normalized word embeddings.

“According to our model, the compositions that are closest to LiCoO2 are LiMn2O4, LiNi0.5Mn1.5O4, LiNi0.8Co0.2O2, LiNi0.8Co0.15Al0.05O2 and LiNiO2, all of which are also lithium-ion cathode materials,” says study lead author Vahe Tshitoyan.

Word associations

The embeddings also produce word associations that correspond to concepts such as “chemical elements”, “oxides” and “crystal structures”, to name but three examples. For example, they can produce solutions such as: “NiFe” is to “ferromagnetic” as “IrMn” is to “?”, where the most fitting response to “?” is “antiferromagnetic”. This result backs up observations made in the first such experiments using Word2vec in 2013.

“Although the algorithm does not perform at 100% accuracy, the fact that it learns in an unsupervised manner is exciting,” Jain tells Physics World. “We are able to use the word embeddings of chemical elements to predict the formation energies of Elpasolite minerals, for instance, with high accuracy, which implies that the chemical knowledge of these materials is embedded in the word vectors.”

Discovering new materials by identifying “gaps”

The researchers did not stop there though: they also showed that their approach can be used to discover new materials by identifying “gaps” in the research literature for functional compounds. They did this by training their machine learning model to predict the likelihood that a material’s name will occur with the word “thermoelectric” in the text. They then searched the text to find materials that had not been reported to have thermoelectric properties but whose names had a high semantic relationship with the word thermoelectric and which therefore might be thermoelectric themselves.

To test their approach, they “went back in time” and retrained their model using only abstracts published before 2008 so that they could compare its predictions with the next 10 years of actual scientific discoveries.

“We found that our model would have predicted some of the best thermoelectric materials discovered in the last decade several years in advance of their actual first report by the materials research community,” says team member John Dagdelen.

“Our findings imply that NLP algorithms can be used not only to extract knowledge that is already in a text, but also to make successful projections about properties that are not yet known. We hope that this will motivate the scientific and NLP communities to collaborate more closely and find even more ways of exploiting all the knowledge stored in the research literature.” 

Towards an analysis of full texts and “out-of-vocabulary” materials

The team, reporting its work in Nature 10.1038/s41586-019-1335-8, now plans to train a model on full texts of scientific articles, rather than just abstracts. “We suspect that more complex NLP algorithms, such as those that are context-sensitive, will be required here,” says Tshitoyan.

Another interesting future direction is to find ways to make predictions about out-of-vocabulary materials – that is, materials not mentioned in texts at all. The approach described in this study could thus be used to unearth previously unrecognized properties of existing materials that could then be exploited in specific applications. Who knows, the next important superconductor or topological insulator may well be found using a machine-learning algorithm.

Battle of the elements final showdown, machine learning and musical amino acids

In this week’s Physics World Weekly, we reveal the element that will join carbon and silicon in the grand final of our Battle of the Elements. Over the past few weeks, Physics World editors have been stating the case for what they believe to be the greatest element of them all. Last week, iron did battle with nitrogen and lithium and we asked you to vote for your favourite via a Twitter poll. Listen to the podcast to see which of those elements make it through to the final then pop over to our Twitter page to vote for the overall winner.

Also in this week’s podcast, Physics World’s materials editor Anna Demming reports from the Japanese embassy in London where she discovered how machine learning is helping materials research. Then we’ve got a rather unusual story about how researchers at MIT are creating music from the properties of amino acids.

If you like what you hear then please subscribe via your chosen podcast app and we’re also available now to follow on Spotify.

Getting to grips with MR image distortion

The inexorable rise of MRI in radiotherapy treatment planning shows no sign of stalling. Superior soft-tissue contrast (versus CT scanning) and the ability to visualize a rich matrix of functional information – including diffusion processes, blood volume and oxygenation, and localized metabolic activity within tumour sites – represent a winning combination for medical physicists and radiation oncology teams. Equally compelling is the fact that MRI interrogates the patient using non-ionizing radio waves, a major plus when treating children  and in cases where repeat imaging scans are needed to track tumour response to radiation treatment.

Current standard-of-care means that MRI is used in tandem with a CT scan for treatment planning, with the patient ideally imaged in the treatment position. The fused CT-MRI dataset provides the MR information needed to outline the tumour volume and organs at risk, while the CT is used for dose calculation. However, the devil, as always, is in the detail – and it’s that detail that matters to CIRS, a US manufacturer of tissue-equivalent phantoms and simulators for medical imaging, radiation therapy and procedural training.

We’re trying to ensure that the geometric fidelity of the MR image is the best we can get when it’s incorporated into radiotherapy treatment planning

Niranjan Venugopal, CancerCare Manitoba, Winnipeg, Canada

At the upcoming American Association of Physicists in Medicine (AAPM) Annual Meeting in San Antonio, US, CIRS will feature a suite of dedicated products – including its MRI grid phantoms and proprietary Distortion Check software – designed to help medical physicists quantify and, in turn, track image distortion issues that can arise in MR images for radiotherapy treatment planning. Such distortion is unavoidable and has its origins in tiny perturbations in the uniformity of the MRI scanner’s magnetic field, caused by the patient and gradients used to image the patient.

Stereotactic QA

Among the early-adopters of the CIRS MRI grid phantoms was Lukáš Knybel, a biomedical engineer at University Hospital Ostrava in the Czech Republic, where’s he’s part of a five-person medical physics team looking after all aspects of treatment planning, dosimetry and QA in the radiation therapy department.

Knybel is particularly interested in quantifying the spatial distortion of MR images used in planning for stereotactic radiosurgery (SRS), a precision-targeted radiotherapy technique that has registered significant success in treating single and metastatic tumours in the brain. “More and more we are using MR images to make contours and prepare the SRS treatments – I wanted to know how precise that MR imaging can be,” he explains.

With this in mind, Knybel initiated a small-scale research study using the CIRS Model 603A SRS grid phantom and Distortion Check software. The 603A is designed specifically for SRS planning and comprises a tissue-equivalent, anthropomorphic design that can be imaged using X-ray, CT and a range of MRI sequences.

“The biggest benefit of this phantom is that you can check the MR image distortion by yourself, without having to rely on the regular machine service carried out by the MR equipment vendor’s engineering team,” he explains. Using the 603A, Knybel can check distortion in the clinic’s MR imaging sequences – and can do that quickly and easily each time the MR scanner is recalibrated and serviced by the manufacturer. “It gives us a QA double-check after the servicing – to be totally sure that we are using high-quality MR images with low distortion,” he adds.

The 603A and Distortion Check are now a fundamental part of Ostrava’s QA workflow for SRS, says Knybel. “Before we had this phantom, we had to trust in the accuracy of the MR images generated by the radiology department. Now we have an added degree of reassurance for the treatment team.”

Knybel cites the powerful visualization capabilities of Distortion Check as a significant benefit, enabling clinical users to quickly identify the biggest areas of spatial distortion in an MR image. In a typical SRS treatment scenario, for example, the region around the cochlea (part of the inner ear) is prone to significant image distortion. “Because of this we’ve changed our QA workflow to target the MR imaging isocentre as closely as possible to the tumour or area of interest, while adjusting our treatment margins to take account of distortion errors,” he explains.

Large-field QA

While Knybel and his colleagues in Ostrava are focused on minimizing the impact of MR image distortion in SRS planning, others are using CIRS’s large-field grid phantom (Model 604) as part of their QA for whole-body MRI in radiotherapy treatment planning. A case in point is Niranjan Venugopal, a medical physicist in the department of radiotherapy physics at CancerCare Manitoba in Winnipeg, Canada.

“MRI is like the ‘golden child’ of imaging – it has within it many capabilities to contribute to the continued improvement of radiotherapy,” Venugopal explains. “However, before we bring any technology into the clinical environment we have to make sure it’s safe and not introducing any unknown errors. If MRI sequences are not optimized they can potentially be a source of error in the treatment plan.”

The work that Venugopal and colleagues are doing with the Model 604 and Distortion Check is to ensure that MRI is deployed robustly in a radiotherapy context. Their goal: to maximize clinical effectiveness in terms of the precision targeting of diseased tissue.

“We’re trying to ensure that the geometric fidelity of the MR image is the best we can get when it’s incorporated into radiotherapy treatment planning,” he notes. “The CIRS solutions allow us to implement a systematic approach to QA of MR spatial distortion with very little effort.”

That QA begins with the commissioning of a new MR scanner and characterization of the machine’s baseline imaging performance versus manufacturer specifications. “A little bit of MR image distortion is forgiven in traditional radiology,” says Venugopal, “but in radiotherapy spatial distortion is unforgiving because it doesn’t allow us to correctly localize the tumour or fuse the MRI data to the planning CT.”

This is where the Model 604 phantom from CIRS comes into its own – and not just during machine commissioning, also for regular QA of MR image distortion over the lifetime of the MRI scanner. “The phantom allows you to make spatial distortion measurements,” says Venugopal, “but the Distortion Check software enables you to track changes in spatial distortion over time.”

Distortion vs time

Venugopal, for his part, was among the CIRS customers involved in beta-testing of Distortion Check prior to the software’s commercial release. Used in conjunction with the CIRS MRI grid phantoms, the software allows users to acquire and upload MR images of their phantom to an online repository.

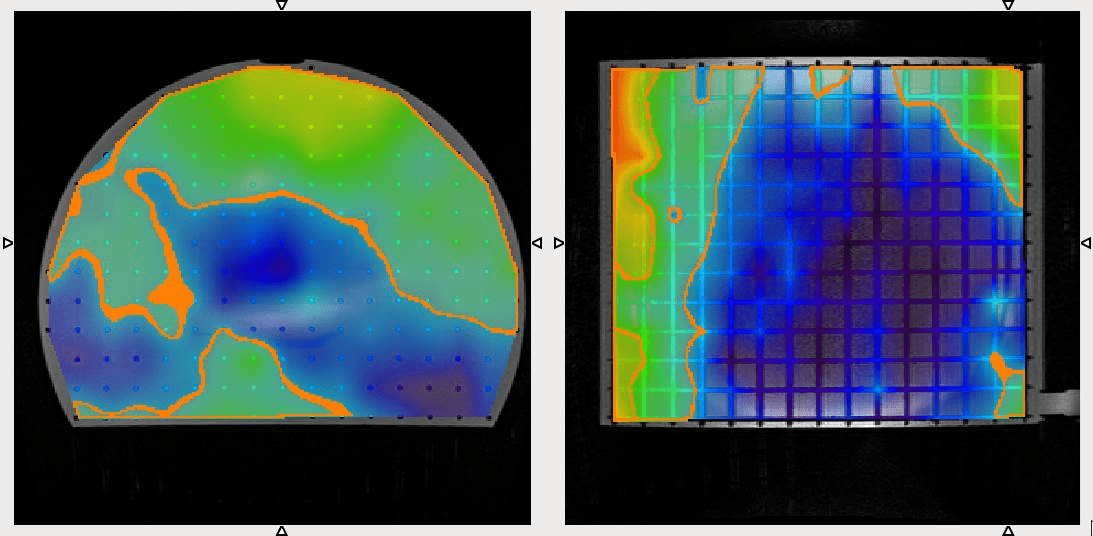
After detecting all grid intersections in the MRI phantom, the software compares the 3D grid points to a template or “ground truth”. Outputs include axial, sagittal and coronal views of the image distortion as well as a 3D scatter plot to view the data.

If needed, MATLAB format files containing detected grid intersections and registered CAD references can be downloaded to analyse the results in more complex algorithms. To further help take meaningful decisions, it is possible to generate an overlay of the distortion magnitude, which can be used with the phantom scan or with a patient’s scan.

“The analysis allows you to compare your current MR image versus the ground truth,” adds Venugopal. “Moreover, Distortion Check saves the distortion data over time so that users can track changes and establish thresholds for image distortion over multiple MR scanning techniques.”

MRI phantoms: a closer look

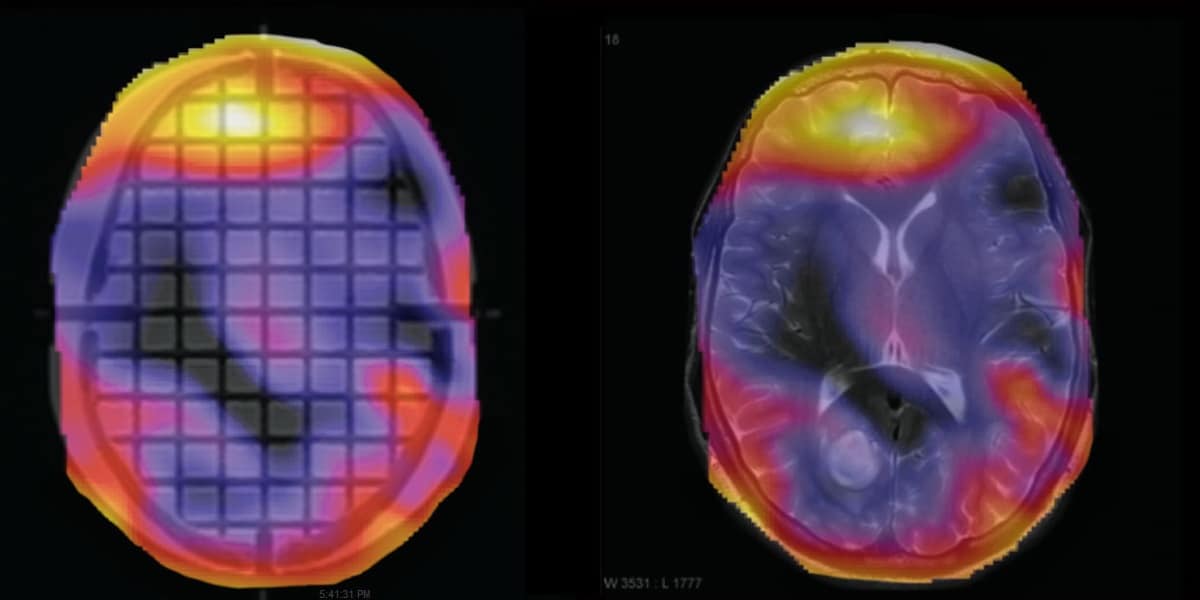
The CIRS Model 603A is a tissue-equivalent anthropomorphic phantom designed specifically for the assessment of MR image distortion in SRS planning (below). The entire intracranial portion of the skull volume is filled with an orthogonal 3D grid of 3 mm diameter rods spaced 15 mm apart. Five extended-axis rods intersect at the reference origin of the grid. The end of each extended axis is fitted with CT/MR markers allowing for accurate positioning with lasers and coregistration of CT and MR image sets. The 603A can also be used in CT/MR image-fusion studies. (Courtesy: CIRS)
 

The CIRS Model 604 is a large-field grid phantom for whole-body MR distortion QA (below). Comprising a leak-proof PMMA cylinder (330 mm diameter, 300 mm long), the Model 604 is filled with an orthogonal 3D grid of 3 mm diameter rods (spaced 20 mm apart) to provide complete geometric data throughout the imaging volume. The phantom is marked for ease of alignment to positioning lasers and is designed for use with both curved and flat gantry tables. (Courtesy: CIRS)

The CIRS Model 604


New Zealand pulls out of the Square Kilometre Array after benefits questioned

The New Zealand government has announced that it will pull out of the Square Kilometre Array (SKA), an ambitious international project to build a vast radio telescope spread out over two continents. The decision comes in the wake of numerous delays and rising costs, as well as heated discussions within New Zealand about the wisdom of spending billions on a project that, it fears, would benefit few astronomers.

As its name suggests, the SKA is a facility intended to have a total collecting area of 1 km2. That will be achieved by spreading out thousands of individual dishes in southern Africa as well as around a million wire antennas in Australia . SKA is designed to provide astronomers with unprecedented views of the first stars in the universe and observations of gravitational waves via the radio emissions from pulsars, among other things.

However, it is not clear when the complete observatory – with a likely price tag of several billion Euros – will see the light of day. As such, scientists are for now concentrating on building a much smaller preliminary facility known as SKA1. But even that is proving troublesome. The project’s organisers are struggling to contain SKA1’s costs below a ceiling imposed by member countries – currently €691m – while the start of scientific observations has been pushed back repeatedly – from an initial date of 2017 to now around 2027.

To stop supporting this team is to risk losing their specialist skills and expertise

Willem van Straten

New Zealand is currently one of 10 full member countries that currently make up the SKA Organisation, which coordinates the telescope’s design and is based at Jodrell Bank in the UK. However, the country has now decided not to take part in building the project, which is due to begin in 2020. The plan was that New Zealand would have been an associate member of the SKA Observatory —  an intergovernmental body also housed at Jodrell Bank that will oversee construction of the facility. The group was formed in March when Australia, China, Italy, the Netherlands, South Africa and the UK signed a treaty in Rome. Of the other three existing members, India and Sweden are preparing to sign up while Canada may instead become an associate member. One non-member nation — Portugal — also signed the treaty too.

A political effort

New Zealand’s decision to quit SKA was announced by its Ministry of Business, Innovation and Employment on 2 July  after concluding that the benefits of continued membership “are not sufficient to account for its cost”. Government official Simon Rae says the ministry estimated that ten years of associate membership would have cost up to NZ$40m when factoring in the NZ$20m-30m that it would have been needed to expand the country’s radio astronomy community. Joining the construction phase, he explains, “would only make sense if New Zealand could sufficiently utilise a share in the completed radio telescope”.

One prominent critic of the SKA, Richard Easther, a cosmologist and head of physics at the University of Auckland, maintains that New Zealand’s involvement in the project was not driven by science. Instead, he argues, the motivation was “a political effort to deepen our relationship with Australia, with the spending then being justified in terms of the spinoffs”.

Easther argues that the case for joining was significantly weakened after New Zealand’s bid to host some of the telescope’s dishes (alongside Australia) fell through when it was decided in 2012 to divide the project between Australia and South Africa. The subsequent delays and downsizing only made matters worse, he says. “The two-stage deployment was always part of the plan, but the timeline has stretched to the point where it amounts to a stealth-downsizing,” he says. “There is no realistic plan to fund or deploy SKA2, so it is off in the never-never.”

Easther has been in the middle of an unusually personal spat with some staff at the Auckland University of Technology (AUT). Andrew Ensor, an AUT computer scientist who is director of the New Zealand SKA Alliance, wrote an e-mail to technology journalist Peter Griffin warning him of Easther’s “single handed attempts to destroy NZ’s involvement and reputation in the SKA” and suggesting that the astrophysicist seek “medical help” rather than media attention.

Some New Zealand astronomers share Easther’s scepticism of the SKA, with 11 having joined him in writing a letter in December 2017 criticizing membership of the project. But others are disappointed. Willem van Straten, a radio astronomer at the AUT, argues that involvement would have “brought numerous opportunities for learning and discovery to New Zealand”. He describes the government’s assessment as “very short-sighted and pessimistic”, particularly given the involvement of numerous engineers and computer scientists in the project. “To stop supporting this team is to risk losing their specialist skills and expertise,” he says.

At least five countries must ratify the intergovernmental treaty before it can come into force. According to SKA Organisation director-general Philip Diamond, treaty signatories expect to do so by around spring next year. However, he refuses to be drawn on which countries, if any, have so far pledged specific funding. He says he is “very optimistic about the state of the project” but adds that he and his colleagues are “engaged quite heavily in negotiations at the moment”.


Timeline: The Square Kilometre Array

2006

Southern Africa and Australia are shortlisted to host the Square Kilometre Array (SKA) beating off competition from Brazil and China. Due to be completed in 2020 and cost €1.5bn, the facility would comprise about 4000 dishes, each 10 m wide, spread over an area 3000 km across

2012

The SKA Organisation fails to pick a single site for the telescope and decides to split the project between Southern Africa and Australia

Philip Diamond is appointed SKA’s first permanent director-general replacing the Dutch astronomer Michiel van Haarlem, who had been interim SKA boss

2013

Germany becomes the 10th member of SKA, joining Australia, Canada, China, Italy, the Netherlands, New Zealand, South Africa, Sweden, the UK

SKA’s temporary headquarters at Jodrell Bank in the UK opens

SKA members propose a slimmed-down version of SKA known as SKA1. With a cost cap of €691m, it would consist of 250 dishes in Africa and about 250 000 antennas in Australia

2014

Germany announces it will pull out of SKA the following year

2015

Jodrell Bank beats off a bid by Padua in Italy to host SKA’s headquarters

India joins SKA

2017

Members scale back SKA again following a price hike of €150m, which involves reducing the number of African dishes to 130 and spreading them out over 120 km

2018

The first prototype dish for SKA is unveiled in China

Spain joins SKA

2019

Convention signed in Rome to create an intergovernmental body known as the SKA Observatory

The Max Planck Society in Germany joins SKA

New Zealand announce it will pull out of SKA in 2020

Lindau 2019: Fighting the threats nationalism poses to science

Time flies, and it’s already the penultimate day of this year’s Lindau meeting. One of the things I have enjoyed most about my week is the international mix of attendees. During the coffee breaks and at mealtimes, it’s been a delight to meet and hear the stories of people from countries and cultures all over the world.

Of course, this is nothing unusual for scientists. From highly structured collaborations bound by intergovernmental agreements such as CERN and the Square Kilometer Array, to collaborations between individual labs and researchers that develop organically, close international cooperation is the norm. Lindau, however, is an extreme case; this year, a record 89 nations are represented, in a kind of United Nations of physics.

It certainly feels very much removed from the current social and political climate of a global trend of rising nationalism and populism; the US, UK and Hungary are just three examples. The threat this poses to collaboration in science, and science more generally, was the subject of a wide-ranging discussion organized for the press on Monday afternoon.

Lakshmi Balasubramanian

Panellists included PhD candidates Lakshmi Balasubramanian, who grew up in Dubai and is based in Paris, and Henry Enninful, a Ghanaian based in Leipzig, Germany. Also taking part were Rolf Heuer, former Director General of CERN and now President of the council of the SESAME synchrotron in Jordan, and chemistry Nobel laureate, Konstantin Novoselov.

The tighter immigration controls that often come with nationalist politics are a source of worry for young researchers, Balasubramanian commented – and, naturally, these also have deeper implications for the collaborations themselves. Though she and Enninful haven’t suffered personally, it’s an issue for many of their peers in their home countries.

“There are [Ghanaian] scientists who have collaborations with the UK specifically, or they need to go to the UK for conferences or for training, and they are denied visas,” Enninful elaborated to me afterwards. Iranian German-based PhD candidate Salma Sohrabi-Jahromi, a guest at the event, also told me she misses out on the main conference in her field every other year, when it is held in the US, due to visa difficulties.

“Science has to cross borders,” said Heuer. “And science can only flourish if you have freedom to think.” he added, commenting on the broader risks of nationalist politics to research – and therefore society itself, arguably best encapsulated by the climate crisis. Enninful presciently cited Hungary as an example where academic freedom is under threat. Since the panel, the country’s National Assembly passed a bill to remove 15 academic institutes from the Hungarian Academy of Sciences and put them under government control.

To tackle these problems, Enninful advocated for the scientific community to present a unified front to government. Balasubramanian, meanwhile, argued that scientists should increase their influence by getting more active in politics. In the longer term, education of children is key, she told the audience, in both the value of internationalism in science and to develop the skills for spotting misinformation.

“They’re the ones who are going to run the country in the future,” she said. “[It] should be ingrained at a very young age and not an older age where it’s difficult to change people’s mindsets.”

Heuer agreed. “Young people – old people too – need to learn critical thinking.”

Muons highlight rodent holes and flood risk

In 2017 the ScanPyramids collaboration discovered a hidden chamber inside Khufu’s Pyramid at Giza in Egypt using muon radiography. Now, scientists have employed this technique to check for rodent burrows in Italian river embankments.

“At the moment every evaluation of flooding …[is] estimated only on the possibility of overflow, considering the banks intact and completely stable from a structural point of view,” says Veronica Pazzi of the University of Florence, Italy. “However, chronicles sometimes contradict this widespread claim, reporting inundations after a structure’s collapse.”

Using muon radiography alongside existing survey techniques could reconstruct voids inside embankments in 3-D. That should help engineers analyse the stability of such levees and the risk of floods from levee piping and collapse.

Muon radiography – or muography – is similar to X-ray radiography. “It exploits natural cosmic-ray muon radiation instead of artificially generated X-rays, and muon trackers – instrumentation commonly used in high energy physics – in place of radiographic plates,” says Lorenzo Bonechi of the University of Florence, Italy.

Muon team and detector kit in the field

Cosmic rays from space generate muons in the uppermost layers of Earth’s atmosphere. Like electrons, muons are subatomic particles that are negatively charged, but they’re around 200 times heavier than electrons.

“Depending on their energy, muons can cross from a few metres to hundreds of metres of rock or other materials, being therefore an appropriate tool for the imaging of thick structures, mountains, volcanoes and so on,” says Pazzi.

Banking on the river

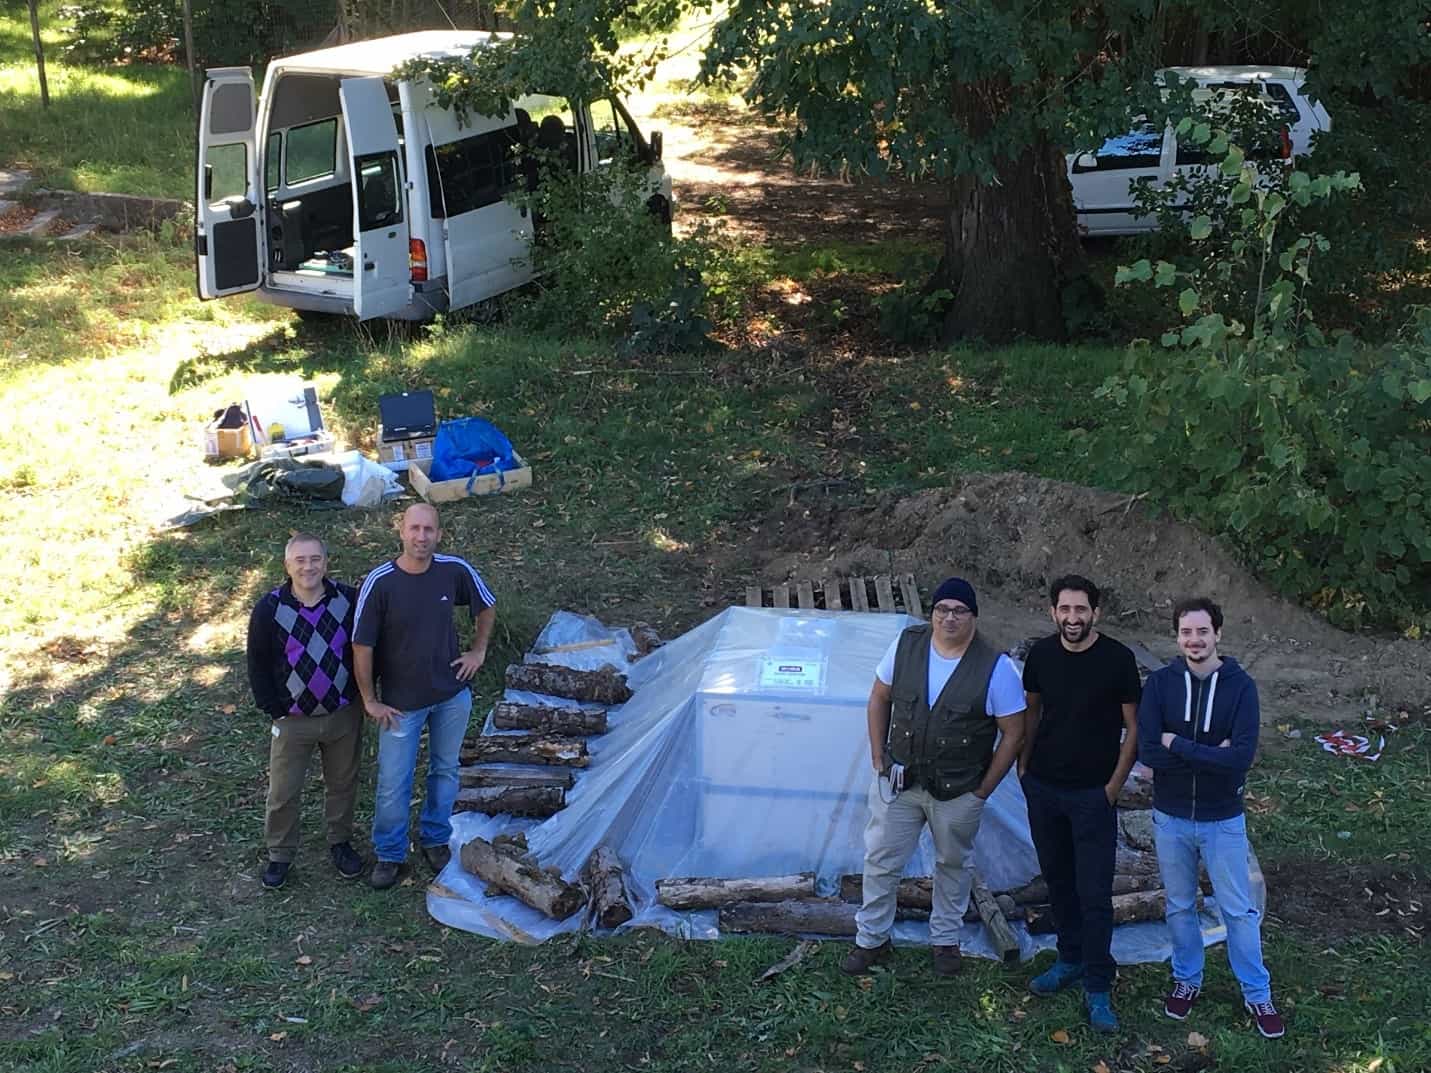
Pazzi’s team of physicists, geologists and engineers installed their Muon Imaging for Mining and Archaeology (MIMA) detector on the banks of the river Arno near Florence, Italy, from July to October 2017, and on the Bure embankment near Pistoia in July 2018. They positioned the kit to the side of structurally damaged portions of the levee, and on top to take “free-sky” reference measurements.

The technique imaged the entrance holes of rodents that had burrowed into the embankment, as well as a nearby tree and mountains in the background. The team also took measurements using electrical resistivity tomography (ERT).

At around 1 metre cubed, the MIMA detector is relatively small so needs a long time to form an image; it took three to four weeks to collect 7000 muon counts. Adding to the difficulties, embankments and their rodent burrows are small targets compared to pyramids or volcanoes, and lie near the line of minimum muon flux.

During these trials, the team worked on ways to install the kit under different access and weather conditions. It now takes just over an hour to install MIMA equipment and the system can then take data undisturbed for months.

Geophysical prospects

“Muon radiography is an advanced field of research to try solving problems that are still not easy to solve using traditional techniques, even with the latest technologies,” says Bonechi.

There are still challenges. “Many possible applications can hypothetically profit…but each single case requires special considerations,” says Pazzi. “The feasibility of the measurement depends on many parameters, like the thickness of the object to be studied, its elemental composition, the configuration of the surrounding materials, the line of sight with respect to the muon detector and the size of the anomalies of interest inside.”

MIMA detector inside a mine

Next the team plans to improve the capacity for data acquisition, processing and interpretation. Combining 2D muography images from several viewpoints would enable 3D muography. And lower-cost instrumentation and more user-friendly software “might lead to a real technology transfer towards industry”.

“Physicists…are working together with geologists, geophysicists, archaeologists and engineers, trying to create a common background of knowledge that leads to the adoption of this radiographic method as a standard method of geophysical prospecting,” says Bonechi.

In archaeology, the technique could avoid the use of invasive techniques in highly fragile sites or areas not yet studied, reducing exploration costs and maximizing work times, the researchers say.

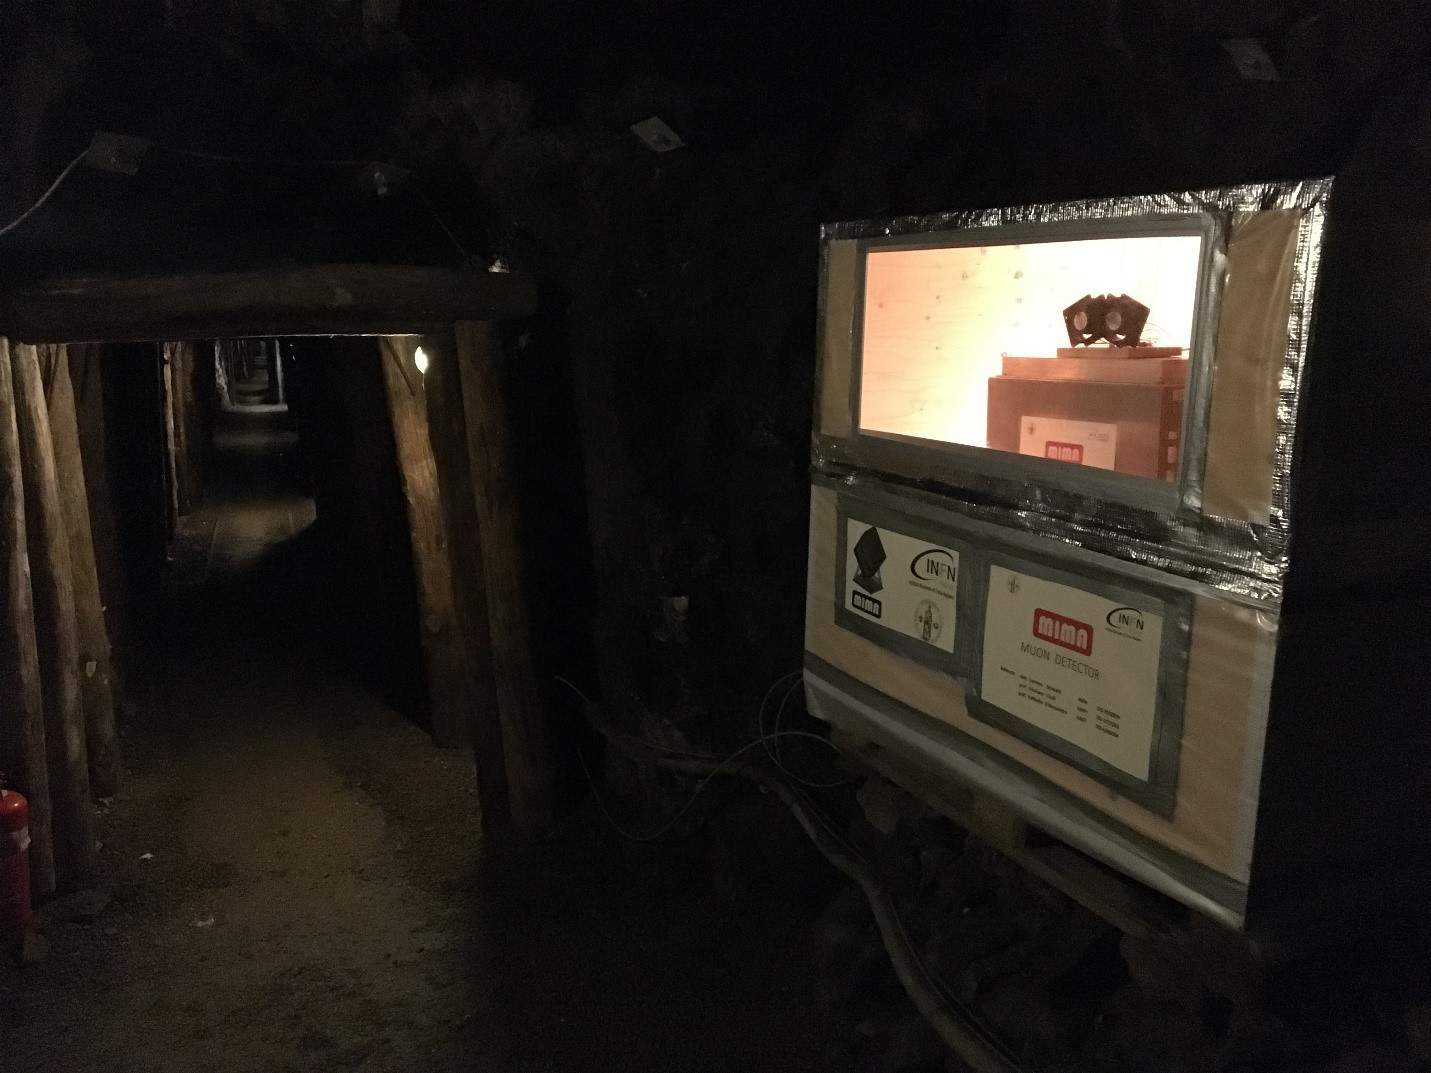
“We are already carrying out new studies inside a mining site for the search of pits of Etruscan age which might explain an anomalous penetration of radon in the main gallery,” says Pazzi. “We are also evaluating the possibility to use muon transmission radiography for understanding the internal structure of architectural works. We finally foresee new tests in the field of hydrogeological risk.”

Pyramids and volcanoes

In 2017 another team used muon imaging to discover a void hidden deep within Khufu’s Pyramid at Giza, Egypt. As Physics World reported, this was not the first use of muons to study the interior of pyramids. In the 1960s the American physicist and future Nobel laureate, Luis Alvarez, placed a muon detector in a chamber in the nearby Pyramid of Khafre. He showed that there are no other large chambers in that pyramid.

More recently, Arturo Menchaca of the National Autonomous University of Mexico installed a detector inside the Pyramid of the Sun at Teotihuacan near Mexico City. Physics World‘s James Dacey and Matin Durrani visited the experiment in 2015, where they recorded the podcast “Inside the particle pyramid“. Dacey recounts how the intrepid pair crawled into the interior of the pyramid in “Particle-physics lab beneath a Mexican pyramid“.

Elsewhere in Mexico, a team including Menchaca tried to image the interior of a volcano using muons. See “Monitoring a smoking giant“.

Pazzi reported the riverbank team’s findings at the European Geosciences Union General Assembly in Vienna.

Polarized radio waves reveal magnetic nature of gamma-ray burst

Polarized radio waves originating from a gamma-ray burst (GRB) have been detected for the first time.  The discovery was made by an international team of astronomers led by Tanmoy Lasker at the UK’s University of Bath and provides important information about relativistic jets associated with GRBs and the patchwork of magnetic fields between stars.

GRBs are extremely energetic explosions that are believed to occur when a large star collapses to form a black hole or neutron star. They can last for milliseconds to hours and emit vast amounts of electromagnetic radiation – briefly shining billions of times brighter than the Sun. Most of the explosion is thought to be focused in two narrow jets of matter that blast out at nearly the speed of light in opposite directions, but astronomers know very little about the astrophysical processes involved in forming these jets.

One popular theory is that the jets are structurally supported by magnetic fields that permeate interstellar space. These fields exist in mosaic-like arrangements of patches; each of which contains a field pointing in a different direction.

Ideal opportunity

An ideal opportunity to test this theory came in January 2019, when NASA’s Swift Observatory spotted GRB 190114C, which is a GRB located 7 billion light-years away. For several hours following the burst, two radio telescopes (the Atacama Large Millimetre/Sub-Millimetre Array in Chile and the Very Large Array in the US) captured signals from the object.

As the jet blasted out into space it produced a huge radio signal, which should be polarized to a certain extent by the magnetic-field patches encountered by the jet. As the jet moves outward, its radius expands and it encompasses more patches (see video).  Because the magnetic patches have random relative orientations, the overall polarization of the radio waves should decrease as the jet expands and covers more patches.

Now, Lasker’s team have combined and analysed the measurements of the two telescopes to reveal for the first time how the linear polarization of the radio waves changes over time as the forward shock of the jet quickly advanced and cooled.

No magnetic doughnuts

In the hours following the burst, the degree to which the signal was polarized decreased from around 0.8% to 0.6%, while the angle of polarization rotated through around 50⁰. These values allowed Lasker and colleagues to set new boundaries on the extent of each magnetic field patch; concluding that each one is similar in size to the solar system. In addition, the observed rotation ruled out the possibility of large-scale, doughnut-shaped axisymmetric fields being responsible for GRB jets, as some previous studies have predicted.

In future studies, the researchers hope to further explore the magnetic structures supporting GRB jets by combining their results with X-ray and visible light observations of GRBs. They will also aim to use these insights to study the properties of the shockwaves at the fronts of GRB jets.

The research is described in The Astrophysical Journal Letters.

Copyright © 2026 by IOP Publishing Ltd and individual contributors