Nanoparticles home in on infectious diseases

The microscopic world is a messy and sometimes dangerous place. Bacteria, viruses and other organisms lurk on every surface, and while most of them are harmless – even beneficial – to humans, the task of detecting and classifying the ones that aren’t has long been a cornerstone of the public health system. Whether it’s a doctor seeking a rapid, definitive diagnosis of an infectious disease, a manufacturing manager monitoring for bacterial hazards in a food-processing plant, or a government agency formulating a response strategy for bioterrorism – all are able to call on an array of tried, tested and sensitive techniques for isolating and identifying harmful micro-organisms.

This big picture might seem broadly reassuring, but a closer look reveals that these existing methods for pathogen detection suffer from significant drawbacks. Some of the more sophisticated approaches – for example, immunology-based techniques or tests to identify a micro-organism’s genetic material – require costly equipment and specialist operating staff. Others, such as the ubiquitous microbial culture, have response times of days, rather than the hours or minutes that might save lives in a crisis.

In short, there’s plenty of room for improvement, and anyone – be it an academic research team, a start-up company or an established manufacturer – who can push the technology forward stands to make significant commercial as well as clinical gains. One promising strategy for doing this revolves around a class of nanoparticles that react in detectable ways when exposed to hazardous pathogens. Although still in the early stages of development, these “bionanosensor” technologies combine rapid response times (making it possible to identify pathogens in minutes rather than hours or days) with the potential for cheaper diagnostics at the patient’s bedside, while also matching the sensitivity and reliability of conventional methods.

Proof of principle

Karen Faulds, a chemist at the University of Strathclyde, UK, is at the forefront of the burgeoning research effort on nanoparticle diagnostics. She and her team at Strathclyde’s Centre for Molecular Nanometrology are developing a bionanosensor for pathogen detection that combines silver nanoparticles with a laser-based sensing scheme called surface-enhanced Raman scattering (SERS).

The Strathclyde team’s assay uses magnetic nanoparticles to isolate bacterial pathogens en masse from the sample matrix. After adding silver nanoparticles that have been functionalized with strain-specific antibodies, the researchers then use SERS to detect in real time which classes of bacteria are present. Like conventional Raman scattering, SERS exploits the inelastic scattering of photons incident on a material’s surface. However, for target molecules attached to or near the surface of the noble-metal nanoparticles, SERS offers orders-of-magnitude increases in detection sensitivity. It also produces sharp, molecularly-specific spectra that enable researchers to discriminate between several species of pathogen in a single sample – a capability known as multiplexing.

In a series of proof-of-concept experiments, carried out in collaboration with Roy Goodacre (then at the University of Manchester, now the University of Liverpool), Faulds and her colleagues Duncan Graham and Hayleigh Kearns demonstrated the potential of the SERS/nanoparticle scheme for isolating and detecting three common bacterial pathogens (E. coli, Salmonella and methicillin-resistant Staphylococcus aureus, or MRSA) from the same sample matrix, at concentrations as low as one colony-forming unit per millilitre sample. Although this is still foundational research, the long-term clinical opportunity is clear. “The sensitivity will allow rapid detection without having to carry out lengthy culture steps,” explains Faulds. In her view, the main challenges lie in scaling up nanoparticle synthesis and functionalization, as well as engineering a single instrument to separate and detect bacteria.
Stream Bio fluorescent molecular-imaging probes

Faulds and her colleagues already have other pathogen targets in their sights. In particular, they are exploring a similar approach for detecting biomarkers related to sepsis. This life-threatening condition arises when the body’s immune response to infection turns on its own tissues and organs. Because the early symptoms of sepsis can mimic other illnesses, diagnosis is often delayed until the patient is seriously ill. In these cases, it is crucial for doctors to identify the responsible pathogen quickly, so that appropriate, life-saving treatment can begin.

The group’s research programme has diversified in other respects as well. Last year, Faulds and her colleagues received a grant from the UK Biotechnology and Biological Sciences Research Council (BBSRC) to evaluate their SERS/nanoparticle sensing scheme for detecting bacteria in the genus Listeria. Listeriosis – an infection caused by ingesting Listeria in contaminated food – is one of the most severe forms of foodborne infection, with an overall mortality rate of 30%. This rises to 40% in vulnerable individuals such as patients with weakened immune systems, the elderly, pregnant women and fetuses. While outbreaks are very rare, owing to strict hygiene standards in food-processing plants, current methods for detecting Listeria are far from optimum, with the growth of a bacterial culture in an offsite lab taking up to seven days.

The SERS/nanoparticle scheme could, in principle, reduce that detection time to a few minutes. By the end of the three-year project (mid-2021), Faulds and her team aim to be able to test swabs that have been taken from food-processing areas in a factory setting. However, not everything about such tests will be entirely realistic – and that, Faulds explains, is exactly as it should be. “Fortunately for us consumers, the rigorous cleaning protocols are so good, and these areas so clean, that it is likely we will need to spike the samples to get a positive result,” she says.

As for commercial opportunities, Faulds believes they are still some way off. In addition to improvements related to the nanoparticles themselves, firms would need to develop a user-friendly device in which the detection assay and a portable SERS instrument work together in a seamless way. Even so, the Strathclyde project has already attracted support from two industry partners. Wasatch Photonics, a US optics manufacturer, is providing SERS instrumentation and know-how on the optical sensing configuration. Meanwhile, Bradgate Bakery, one of the UK’s largest sandwich manufacturers, is supplying both financial support and guidance on the testing requirements for a chilled-food production environment.

Manufacturability, scalability, stability

While academic scientists like Faulds are, for now, focused on proof-of-concept research, early-stage start-ups are refining their technologies and processes with manufacturability and scalability in mind. Among that cohort is Stream Bio, a UK venture that is eyeing up a range of bioanalytical applications for its portfolio of highly fluorescent molecular imaging probes.

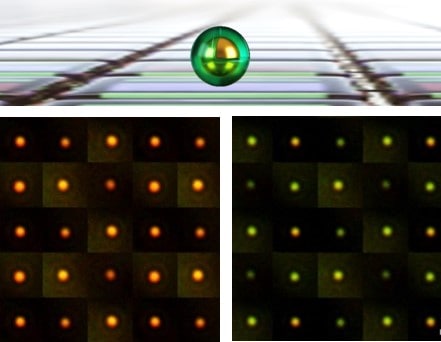
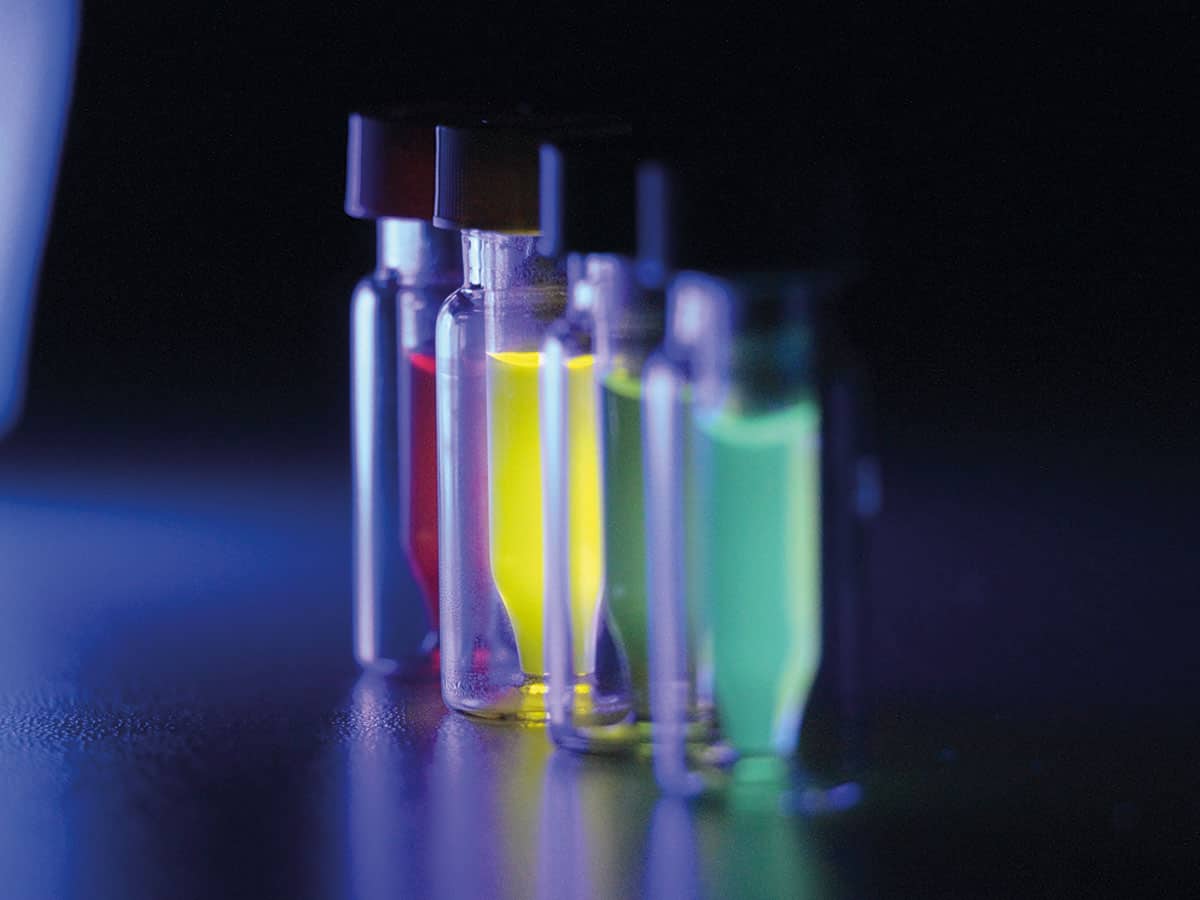
The probes – which are licensed by Stream Bio, though originally developed at King’s College London – comprise a core of semiconductor light-emitting polymers and iron-oxide nanoparticles encapsulated within a water-friendly capping agent. The wavelength of light emitted by these conjugated-polymer nanoparticles (CPNs) depends on the make-up of the polymer core, with four discrete polymer building blocks providing the basis for a family of fluorescent imaging probes across the visible spectrum (475–680 nm).

Stream Bio claims it will ultimately be possible to use its CPNs to detect and quantify a range of molecular targets – pathogens, biomarkers or specific DNA sequences – by functionalizing the nanoparticles’ surfaces with different active biomolecules that attach themselves to such targets. In addition, the presence of the iron-oxide nanoparticles in the CPNs confers magnetic properties that are potentially useful in any purification and enrichment step before or during analysis.

Right now, the main applications for CPNs lie in analytical tools such as fluorescence imaging microscopy, flow cytometry and plate-based assays that are widely deployed in biomedical research and clinical applications. “The intensity of the CPN fluorescence allows for a dramatic improvement in the detection capabilities of these techniques,” explains Dermott O’Callaghan, Stream Bio’s head of product development. “That enhanced capability will also improve the performance of diagnostic tests, meaning that infections can be detected sooner – of particular importance for time-critical diseases such as sepsis.”

Mark Green, Stream Bio’s director of research, acknowledges that getting the CPNs into the clinic will be “a long road”. He and his colleagues have already taken several important steps in that direction – notably by developing a commercial manufacturing process in conjunction with the Centre for Process Innovation in Sedgefield, UK. Scaling up production was “a big challenge”, says Green, but Stream Bio is now able to make CPNs to order, while maintaining the materials’ strong optical properties, stability and relatively small particle size (70–80 nm). Additionally, using funding from a UK government body, Innovate UK, Stream Bio has started developing smaller particles and more wavelengths.

Stream Bio’s pivot to a more commercial footing is also evident in its emphasis on long-term product stability and brightness. “Since the basic materials we use – conjugated polymers – were originally designed for use in the display industry, we have a robust material platform that can withstand harsh conditions and processing,” says Green, who is also a professor of nanoimaging at King’s. “We have samples prepared well over a year ago in our scale-up process that still appear as bright as they ever were after being stored in ambient conditions.”
Stream Bio

What you know and who you know

Another start-up targeting the nanoparticle diagnostics market is Bristol-based FluoretiQ. The company is currently refining its nanoparticle-based detection scheme to work on a single species of bacteria, E. coli, which accounts for around 80% of urinary tract infections. However, in the longer term, chief executive and co-founder Neciah Dorh hopes to streamline the diagnosis of all manner of bacterial infections, yielding results in minutes rather than days.

FluoretiQ’s detection scheme exploits two areas of research pioneered at the University of Bristol. First, there’s the role that carbohydrate chemistry plays in cell recognition during a bacterial infection: it’s the targeted interactions with these complex biomolecules that enable E. coli bacteria to attach themselves to the surface of cells in a human host. In the same way, when FluoretiQ’s nanoparticle probes are injected into an infected urine sample, they selectively attach to individual bacteria, making them detectable by optical methods.

“Think of our probes as a fluorescent ID badge for cell recognition,” explains Dorh, who completed his PhD in nanophotonics at Bristol’s Centre for Quantum Photonics in 2016. By measuring the fluorescence, he and his colleagues can determine what strains of bacteria are present and in what quantities. Such precise measurements are possible thanks to the other area of research FluoretiQ is seeking to exploit: enhanced quantum measurement techniques that can resolve fluorescence emissions at the single-photon level.

The team has developed both a low-cost fluorometer and proprietary data-processing techniques that can measure the photon-arrival statistics at the detector. That information is then deployed to assess whether the target fluorophore is present and whether it’s on its own or experiencing interference from other fluorescent material, such as normal metabolites.

Selectivity aside, Dorh believes that the biggest advantage of FluoretiQ’s approach is speed. The most common test for E. coli is still the microbial culture, a time-consuming and labour-intensive process. It takes two to three days for a pathology lab to grow a microbial culture from a sample of urine, after which a further series of biochemical tests is needed to home in on a definitive identification. “We’re turning all that on its head,” says Dorh. By skipping the culture-growth phase and targeting the bacteria directly, rather than via a series of steps that lead to an inferred identification, the FluoretiQ team eventually hopes to compress the time for diagnosis down to 15 minutes.

Earlier this year, FluoretiQ’s scientists got their first chance to evaluate the company’s prototype fluorometer in a real-world setting, carrying out more than 300 measurements in a National Health Service laboratory. These measurements will help inform their next stage of product development. And, like Stream Bio did, they are also working to scale up production. In December 2018 the founders brought in a synthetic chemist from the University of Bristol to help them scale up nanoprobe production (from the milligram scale up to hundreds of grams), while also focusing on yield, cost of production and reproducibility.
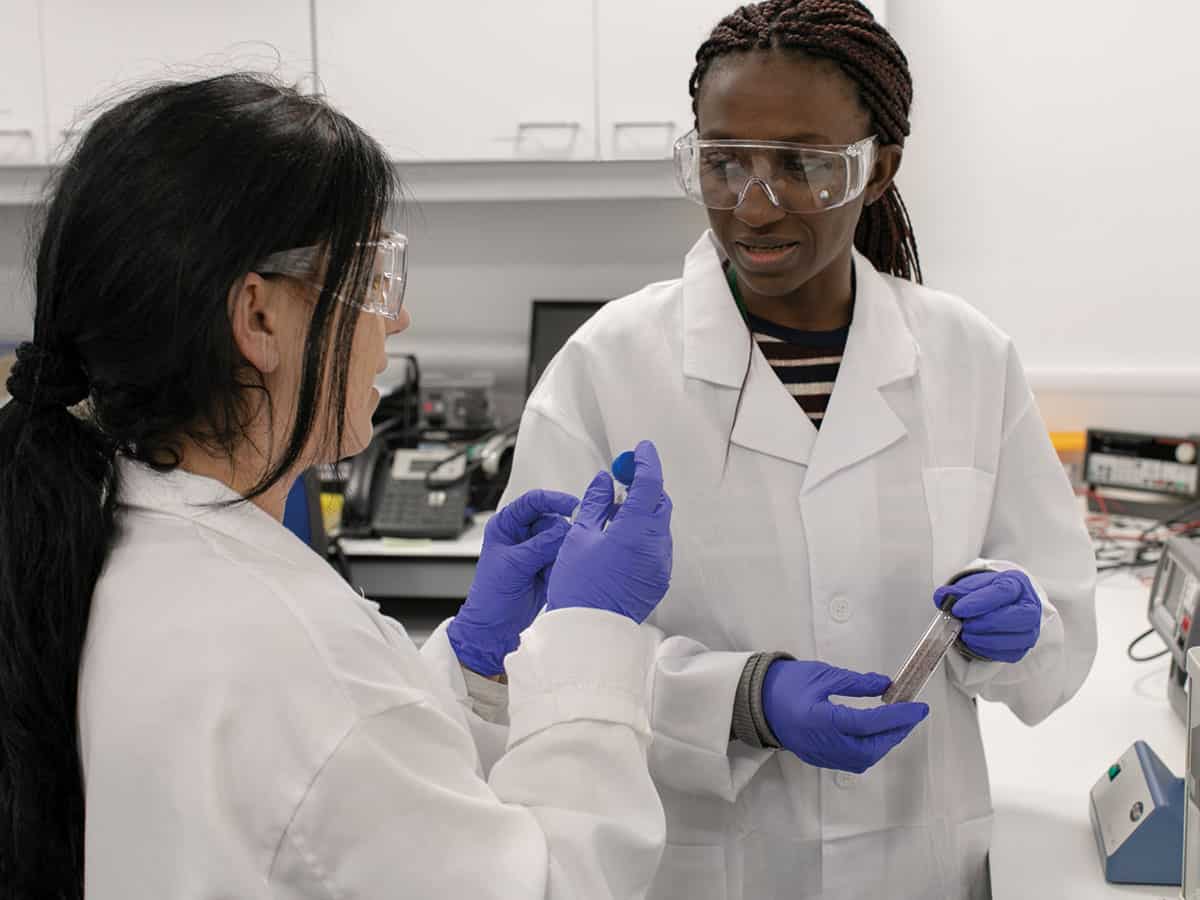
FluoretiQ

Even in these early stages, though, Dorh is already casting the net wider in order to, as he puts it, “de-risk” the next stage of commercialization. “The healthcare space is dominated by some very big companies and we’re actively seeking strategic partnerships,” he explains. “They’ll be a good fit with much of the advanced R&D we’ll have to do in the medium term – for example, around sample handling and preparation – and we’re very much open to that model of working. The next 12 months will be about finding the right partner to make sure we deliver true impact, not just in the UK but globally as well.”

Ultimately, it’s this sort of open-innovation mindset – characterized by multidisciplinary collaboration and proactive engagement with industrial and clinical partners – that starts-ups such as FluoretiQ and Stream Bio, as well as their counterparts in academia, hope to use to accelerate their R&D programmes and unlock the promise of nanoparticle diagnostics. If they succeed, a new era of cheap and easy-to-use bionanosensors beckons – saving time, saving money and saving lives.

Silicon two-qubit gate achieves 98% fidelity

A two-qubit gate based on silicon quantum dots has achieved a quantum fidelity of 98%. The device was created by researchers at the University of New South Wales in Australia and the fidelity measurement is the first made on a silicon two-qubit gate.

Two-qubit gates are essential for creating practical quantum computers and the team’s leader, Andrew Dzurak, says the group is now working on a silicon-based “quantum chip that could be used for real-world applications”.

Thanks to decades of intense R&D by the computer industry, silicon is the material of choice when it comes to building and integrating electronic devices. Silicon could therefore play an important role in the future development of practical quantum computers – which, in principle, could outperform conventional computers doing some types of calculations.

Quantum computers comprise quantum bits (or qubits) that are linked-up to perform calculations. Researchers are currently trying to work out which technologies – such as trapped ions, superconducting circuits and semiconductor quantum dots – make the best qubits. An important parameter is how resistant a qubit is to disruption (or decoherence) by external noise, which can very quickly destroy quantum information.

High fidelity

Resistance to decoherence can be assessed in term of the fidelity of a quantum operation – which is a measure of how close the real-world outcome of the process is to the ideal outcome. While the fidelity does not have to be a perfect 100%, anything lower will eventually lead to errors creeping into calculations after multiple operations are performed. Quantum error-correction protocols can mitigate decoherence, but this comes at a great cost and any practical system must have a very high fidelity to begin with.

Dzurak and colleagues specialize in creating qubits that encode and process quantum information using the spin states of silicon quantum dots. Earlier this year they made a one-qubit quantum gate with record-breaking fidelity of 99.96%.

Now Dzurak’s team has created a two-qubit gate from two silicon quantum dots and demonstrated that it can achieve a fidelity of 98% when performing the controlled-rotation (CROT) operation. CROT can be used to create a controlled-NOT (CNOT) gate, which is an essential component of a quantum computer. Clifford-based fidelity benchmarking was used to evaluate the system, which is a technique for assessing and comparing the performance of qubit systems made from a range of different technologies.

More than 50 gate operations

Team member Wister Huang explains, “We achieved such a high fidelity by characterizing and mitigating primary error sources, thus improving gate fidelities to the point where randomized benchmarking sequences of significant length — more than 50 gate operations — could be performed on our two-qubit device”.

The team believes that their work provides further evidence that silicon is a strong contender for building large-scale, practical quantum computers. Indeed, Dzurak says “We think that we’ll achieve significantly higher fidelities in the near future, opening the path to full- scale, fault-tolerant quantum computation. We’re now on the verge of a two-qubit accuracy that’s high enough for quantum error correction.”

The research is described in Nature.

Machine learning puts nanomaterials in the picture

machine learning structure function maps

The rich properties of nanomaterials can be a bane as much as a bonus to researchers keen to put them to good use. “Nanomaterials have all the challenges of molecules (such as finite sizes, surfaces and chemical functionalization), combined with the complexity of materials (such as defects, impurities and disorder),” explains Amanda Barnard, Chief Research Scientist in Data61 at the Commonwealth Scientific and Industrial Research Organisation (CSIRO) in Australia. “Machine learning is a powerful way to navigate that complexity and include all of these features in our predictions.”

Reporting in Journal of Physics: Materials Barnard and CSIRO colleague Baichuan Sun show that dimension reduction algorithms used in bioinformatics, finance, transport and social science can also help materials scientists to visualize data with a large number of defining features – descriptors – and so help to identify patterns in the structure-function relationships. These algorithms have largely gone below the radar of materials scientists as they were not developed with these applications in mind. However as the materials science specialists of a group specializing in data science and machine learning, Barnard and Sun are exposed to a far wider range of data tools than most researchers in groups specializing in materials science.

“’Nanoinformatics’ (the use of data science and machine learning to explore the complex structure/property relationships in nanoscale materials) is just starting to emerge,” explains Barnard. However she foresees it claiming increasing prominence in nanomaterials studies to tackle their complexity. “Traditionally structure/property relationships are based on researcher assumption or intuition and then deliberately measured and plotted to confirm a trend. Machine learning needs no input assumption and if a relationship (pattern) exists in the data it will naturally emerge, regardless of whether it was foreseen and targeted in the original series of experiments or simulations.”

In particular, Barnard highlights the advantage of the dimension reduction algorithms she and Sun have been working with, which help researchers “see” the characterization results recording a range of properties and features in different types of nanoparticles. “Humans are very good at visual pattern recognition, and researchers with an intimate familiarity with their material and data would be remiss not to draw on this ability as part of their research.”

Characterization cartography

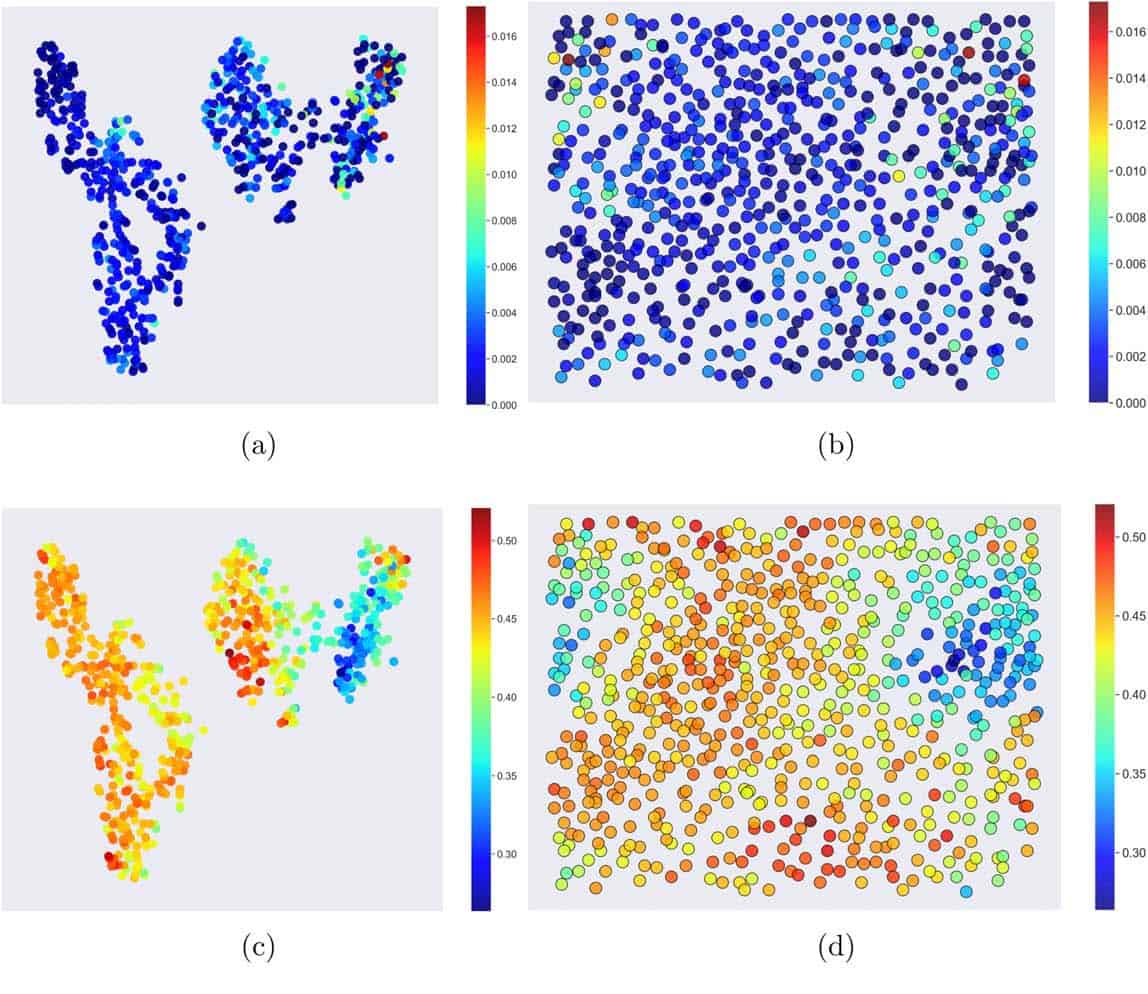
Among the characteristics defining a nanoparticle are the structural features such as the shape, volume, the fraction of face centred cubic atoms or the concentration of defects, as well as behaviour properties that might include the ionization potential, electron affinity or bandgap. Preparation parameters like the growth time or rate and temperature are also defining features. The data sets Barnard and Sun worked from included these characteristics as well as many more. All these characteristics equate to a large number of dimensions for each data point. By generating 2D maps of nanoparticles encoded by one characterizing feature at a time, while reducing the dimensionality of the data, the researchers could easily compare 2D maps to pick out trends.

Algorithms that can reduce the dimensionality of this kind of data into 2D maps include t-distributed stochastic neighbour embedding (t-SNEs) and self-organisation maps (SOMs), also referred to as Kohonen networks. Maps based on the SOM algorithm comprise a grid of units that act as “neurons”. Each neuron starts with a random value. In the machine learning stage, for each data point recorded, the algorithm searches the grid for the unit that best matches its value by taking differences. The value of the neuron at this “best matching unit” and those close to it are then updated to “weight” it with respect to the matching data. The t-SNE is similar in some ways but weights its grid based on probabilities and so distances and directions on the map rendered are not as meaningful.

Barnard and Sun use both algorithms on two sets of data – one for silver nanoparticles and one for platinum nanoparticles. They show how they can identify structure/function relationships using both algorithms. “Some of the structure/property relationships we identify in this paper were already known (and were an important test that these methods can predict the right answer when we already know what it is) and some were more nuanced, and previously hidden because the curse of dimensionality prevented straightforward interpretation using conventional methods,” Barnard tells Physics World.

The SOM advantage

Barnard points out that one of the biggest limitations in the identification of structure/property relationship in materials and nanoscience is that data sets are typically biased by the pre-selection scientists undertake when targeting specific applications.  Machine learning can amplify these biases.

Barnard and Sun show that here the SOM algorithm may have advantages, because over representation of a particular feature does not affect the performance of the SOM algorithm. In addition, it generates maps of continuously dispersed data, whereas the t-SNE maps tend to have clusters that can be misleading. Future work will look further into which of the methods that computer scientists have developed are best suited to deal with the types of problems that arise in materials science research.

Full details are reported in the Advanced Material Modelling, Machine Learning and Multiscale Simulation focus collection of Journal of Physics: Materials.

MR-guided proton therapy: a status update

Proton therapy provides a means to target tumours with extreme precision. Steep dose gradients enable superior sparing of healthy tissue compared with photon-based treatments. But this steep dose fall-off also makes proton dose distributions highly sensitive to anatomical variations, patient set-up inaccuracies and tumour motion. As such, real-time image guidance during proton therapy delivery could prove invaluable.

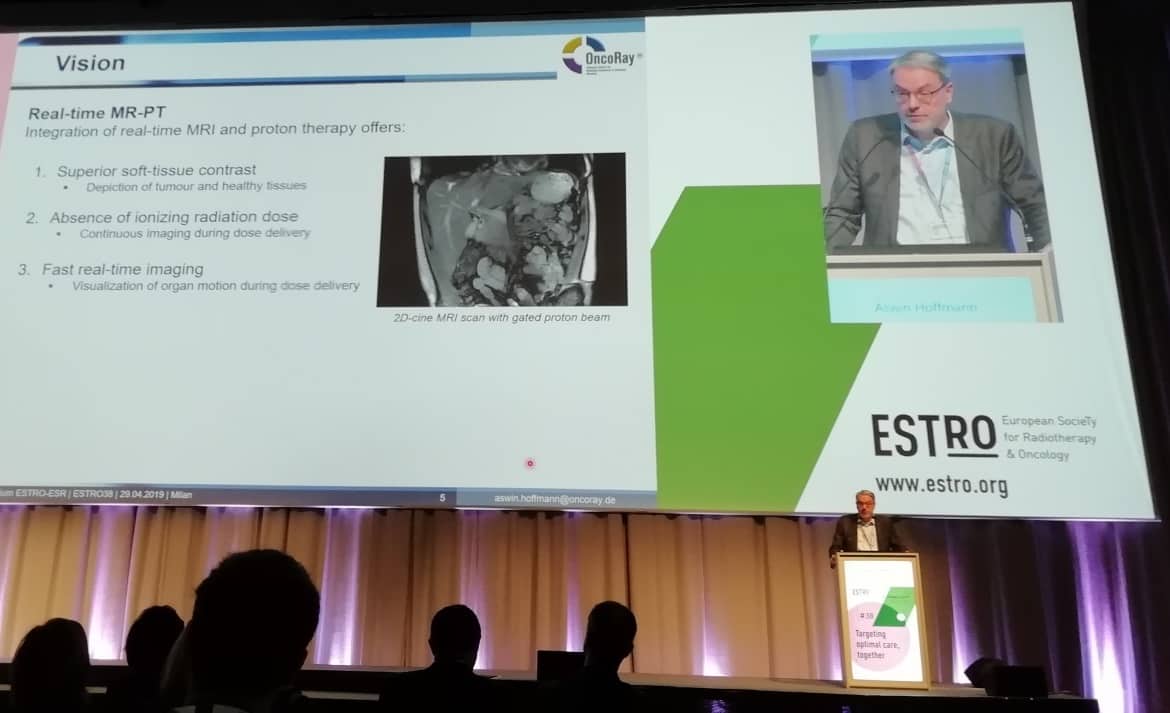
One option could be to take the lead from photon radiotherapy and use MRI to visualize the tumour during treatment. At the recent ESTRO 38 conference in Milan, Aswin Hoffmann from OncoRay in Dresden took a look at the motivation for developing MR-integrated proton therapy and the current status of research efforts in this field.

“Image guidance in proton therapy is currently lagging behind image guidance in X-ray therapy,” Hoffmann explained, noting that proton therapy machines typically only have integrated 2D X-ray imaging. Some also have in-room CT or on-board cone-beam CT capability, but no in-room or on-board MRI is available. “Also, precise targeting is more important for proton therapy than X-ray therapy because of the steep dose gradient at the distal edge of the Bragg peak. This is why we still use relatively large margins and do not exploit the full dosimetric benefit of proton therapy.”

To address this, said Hoffmann, OncoRay has a vision to integrate real-time MRI with proton therapy. This would enable superior soft-tissue contrast for visualizing the tumour and surrounding healthy tissue. Meanwhile, the absence of ionizing radiation dose enables continuous real-time imaging during dose delivery. “Combining these two modalities could synchronize dose delivery with tumour position,” he pointed out.

Aswin Hoffmann

Mutual impact

There are, however, many challenges when building such an integrated instrument, such as mutual electromagnetic interactions between the proton therapy and MRI systems, which may detrimentally impact the performance of each. Hoffmann first described the potential impact of the MR scanner’s magnetic field on the proton beam. Lorentz forces on the positively charged particles will deflect the beam from its straight trajectory, he explained.

Several research groups have used computer simulations to calculate the magnitude of this effect. And notably, recent measurements have validated these simulations. Hoffmann cited a study by OncoRay that used film dosimetry to determine beam deflection due to a magnetic field. Results showed that a 190 MeV beam deflects by about 1 cm when entering a 1T field, as predicted by the Monte Carlo simulations.

“We cannot ignore this effect, it has to be taken into account during treatment planning and dose delivery,” Hoffmann said. But because such dose effects can be accurately calculated using Monte Carlo simulations, he suggested that this represents a low risk.

And what about the effects of the magnets used for proton beam generation, transport and steering on MR image quality? Hoffmann shared the results of a magnetic survey performed in the experimental room at the Dresden proton therapy facility. This revealed that the cyclotron generates a magnetic gradient far smaller than the MR gradients, and can be compensated for by magnetic shimming of the MR scanner. Likewise, gantry rotation in the nearby therapy room causes small magnetic field effects that should not impact MR image quality.

The magnetic field of the beamline magnets, however, can be up to 100 µT, and could detrimentally affect the MR image quality. Thus, magnetic shielding may be necessary to enable simultaneous operation of the proton therapy and MRI systems.

Work in progress

To investigate these effects in more detail, OncoRay has built a prototype MR-integrated proton therapy system that integrates an open 0.22T MRI scanner with a horizontal fixed proton research beamline. Hoffmann and his team used the system to image the ACR small MRI knee phantom during proton beam irradiation.

When the beamline magnets to the gantry room were switched on during MR image acquisition, the image was distorted. But when the beamline magnets were switched on prior to MR image acquisition, image quality parameters did not change significantly due to irradiation. There was only a small uniform image shift in frequency encoding direction that can be corrected for via adequate pre-scan RF calibration. “We found that is important to synchronize MR image acquisition and operation of the proton therapy facility,” Hoffmann explained.

The next step, he told the delegates, will be to combine MR imaging with a pencil-beam scanning proton system, to echo the clinical situation. Here, additional technical challenges include investigating the effect of the pencil-beam scanning magnets on MR image quality, and determining the impact of the MR fringe field on the beam steering system.

Hoffmann also examined the possibility of using MR imaging for online range detection. He described an experiment using a proton pencil beam to irradiate a water phantom, with beam energies of 190, 200, 210 and 225 MeV at very high dose rates. At each beam energy, MR images of the irradiated phantom contained either a hyperintense line artefact that exhibited a clear “wobble” at the expected residual range or showed an MR signature that mimics the full shape of the pencil-beam dose distribution, depending upon the MR pulse sequence chosen.

“For the first time, we have shown that you can use MRI to visualize the proton beam range in liquid water,” Hoffmann said. “This could be a valuable tool to perform quality assurance for MR-integrated proton therapy because you can see the beam in real time.” Hoffmann and his group are currently investigating whether these results can be translated into a clinical application.

There’s more to Indonesian fires than drought

The fires that devastated Indonesia in 2015 were chiefly linked to drought, topography and population, researchers have learned. Fires were most likely in flat, sparsely populated areas where there had been little rainfall. Although the connection to rainfall was no surprise, the other influences were unexpected.

The results underline the importance of establishing an early-warning system for droughts, according to Janice Ser Huay Lee of Nanyang Technological University of Singapore. “Mitigation of fires would come from monitoring ignition sources during droughts, especially in low-population peatland, in areas that have been burnt in recent years, and in close proximity to roads,” she says. “These criteria could be incorporated into the Indonesian authorities’ existing fire-monitoring systems.”

Indonesia’s 2015 dry season saw 2.6 million hectares of land burn in wildfires of unprecedented severity. The resulting air pollution caused the country $16.1 billion in losses to agriculture, forestry, trade, tourism and transportation, and contributed to more than 100,000 premature deaths in the region.

The role that drought played in the crisis might be obvious: 2015 was an El Niño year, and such conditions are strongly associated with fires in Southeast Asia. Rainfall is just one element, however, and identifying the other parts of the picture could help prevent future disasters on this scale.

To determine the power of those other influences, Lee and colleagues Jocelyne Shimin Sze and Jefferson, also at Nanyang Technological University of Singapore, compiled 18 possible contributory factors to weigh against the likelihood of fires in three provinces of Sumatra, where burning was most extensive.

Fire risk is broadly a product of two components: circumstances that predispose a landscape to fire; and sources of ignition. The team’s list of variables encompassed both, spanning everything from environmental conditions such as rainfall, slope and forest degradation, to human elements like economics, population and conflict.

The researchers conducted analyses at two different geographical scales. First, they characterized each pixel in a satellite image according to the potential contributing factors, and classified it depending on whether burning did or did not take place within that 1 sq. km. The output was an ordered list showing the relative influence of each factor on overall fire risk.

In the other analysis, the group considered the possible predictors at the regency scale — a political division larger than a city and smaller than a province. From these predictors, they created a set of statistical models that varied in how efficiently they accounted for the number of fires in each regency.

Both analyses showed that fires were more likely where mean monthly rainfall was below 150 mm, the ground was flat enough for agriculture or peat extraction, and population density was low but not zero. Proximity to roads was a secondary factor also common to both.

“For these to come up as strongly affecting both fire count and occurrence suggests that they play an important role in contributing to the number of fires within the regency and occurrence of fires at that particular location,” says Sze.

There were differences between the scales, however. “Factors related to economic land use came out more strongly under the regency-scale analysis, and factors related to forest degradation came out more strongly under the pixel-scale analysis,” says Sze. “It is partly a reflection of the different techniques used, but it also says something about evaluating drivers of fires when we use a count or an occurrence response for fires.”

The team reported the findings in Environmental Research Letters (ERL).

Nanoparticle-on-mirror constructs could help make colour-changing displays

An eNPoM

Large-scale plasmonic metasurfaces could find use in flat panel displays and other devices that can change colour thanks to recent work by researchers at the University of Cambridge in the UK. They have developed a new, simple, bottom-up technique to fabricate colour-changing nanostructures made from metallic nanoparticles and conducting polymers.

As metallic particles become smaller in size, phenomena such as surface plasmons appear. These are collective excitations of electrons at the surface of a metal that very strongly interact with light. This light-matter interaction is strongest at the plasmon-resonance frequency, which is defined by the size and shape of an object and its charge density. Applications such as sensing, imaging, actuation and displays can exploit these resonances.

Displays are a particularly interesting application since researchers can now use advanced nanolithography techniques to make plasmonic building blocks capable of producing a wide range of colours while keeping the overall size of the blocks smaller than the pixels employed in commercial displays. However, the problem is that the colour of these devices is static and cannot be easily tuned.

NPoM pixel

One way of overcoming this challenge is to make a multi-layered plasmonic composite structure filled with a dielectric spacer. The key feature in this structure, known as the nanoparticle-on-mirror (NPoM) pixel, is that closely separated metal nano-objects strongly confine light within their individual gaps to the underlying mirror and thus produce extremely localized cavity resonances, explain the researchers. This makes them insensitive to the angle and polarization of incoming light, which means they can be used to create nanoscale pigments for display applications. The main difficulty here, however, is to be able to produce NPoMs on a large scale while ensuring that each individual NPoM acts as an independent nanopixel.

A team led by Jeremy Baumberg of the NanoPhotonics Centre at the Cavendish Laboratory has now done just this using a bottom-up solution process. The researchers chemically coated gold nanoparticles in water with a thin layer of the conducting polymer polyaniline. They then sprayed these particles onto a metallic mirror where the small nanogap below each nanoparticle is filled by the polyaniline film.

The electrochromic NPoM works by switching the charge state of the entire polyaniline shell (by oxidizing and reducing it in an electrochemical cell), thus shifting the resonant scattering colour of the eNPoM across a wavelength range that is greater than 100 nm.

Stable colour state

“The nanogap below each nanoparticle is in fact dependent on the thickness of the polymer coating and we can exquisitely control this thickness on the nanoscale when we grow it around the gold particles,” explains team member Hyeon-Ho Jeong. “We are not only limited to polyaniline in this technique and a whole range of different polymers can be used.”

The active nanopixel in the device only requires about 0.2 femtojoules of energy for each 1-nm shift in wavelength, he adds. What is more, once the state of the polymer has been electrically switched it stays that colour for a long time, so no further power is needed to maintain the pixel in that colour.

“Since the state of the polymer controls the reflected colours of light, the devices don’t need a backlight (though you can’t see them in the dark),” he tells Physics World. “These structures could thus be used to help drastically reduce the power required for large-area displays. The fact that we can already switch at rates greater than 50 Hz means that video displays might even be possible.”

Early days

The researchers say that it is still very early days for their technology, but that they are making great progress. “We are now trying to fabricate pixel-array demonstrators,” says Baumberg, “and looking for partners to develop our work further. One area we are especially interested in is making buildings silvery to reflect sunlight on a hot summer’s day and black to absorb solar radiation on duller days, thus reducing building heating requirements.”

According to the researchers, other potential real-world applications include colour-changing wallpapers, smart windows, traffic management systems, electrical signage, display panels and even cars that change colour. “What if your car could blush?” asks Baumberg. “Would that change how we deal with road range and allow us express ourselves differently?”

Apart from colour displays, the plasmonic colour-changing metasurfaces might also be used in flexible and wearable sensing, he adds, since the optical properties vary according to changes in electrical charge as well as pH (proton density). The technology might also be used in fundamental studies to measure hot electron generation and photochemistry on extremely small length scales in real time.

The researchers, who detail their work in Science Advances 10.1126/sciadv.aaw2205, say they are now busy trying to understand what controls the charge leakage from the polymers, because they would like them to stay in their colour state for as long as possible. “We are also aiming to make a better blue colour and see if we can achieve a full colour gamut,” reveals Baumberg.

Hawking joke inspires coin collector, Chaos the lion has radiotherapy, how to coil a liquid jet

Do you remember our April Fool’s Day news story last month? In the spoof article, we pretended that the UK’s new 50p commemorative coin, which contains Stephen Hawking’s famous equation for the entropy of a black hole, contained an error. We claimed that the mistake had been discovered by 14-year-old French mathematical-physics prodigy “April Lapremiere”. She found, we pretended, that Hawking had been out by a factor of two and that the coin should have had a “2” on the denominator, rather than a “4”. The coin, we lied, was now being withdrawn.

The joke should have been obvious as we laid it on pretty thick. Unfortunately, it went over the head of one reader – Jacob L (who is too embarrassed to have his full name revealed). A coin-collecting “warehouse grunt” with a keen interest in science, but no formal training, he e-mailed us this week to say he’d heard about the coin and had been interested in getting one for his personal collection. “But when I saw the article by April Lapremiere, detailing how the coin was recalled due to an error in the equation, I quickly bought two of the silver proof coins for $300,” he wrote. “How I wish I knew French! I didn’t see the date, nor did I understand that it was a joke – I am no mathematician!”

Part of the problem for Jacob L was that we always “unpublish” our April Fool’s stories before 1 April is over to, er, avoid people getting the wrong end of the stick. But not having a way to track down the story, he later could not quite remember what we had written. And that’s when he decided to fork out for two of the coins, which might well have risen in price due to their future rarity (if the story had at all been true). Fortunately, Jacob L saw the funny side and is happy to share his cautionary tale with other readers. “If the story can make someone laugh (though at my expense), it is worth sharing,” he signed off. “Next year, I’ll be a bit sharper come April first…”

Elsewhere in the Red Folder, there are some fantastic photos doing the rounds of Chaos the lion undergoing radiotherapy for skin cancer. The 16-year-old big cat received the treatment in South Africa, where he lives in a zoo located between Johannesburg and Pretoria. Chaos was sedated, and the treatment took just five minutes. He has three more sessions scheduled over the next few weeks, so good luck Chaos.

How do you get a jet of water to coil around a cylinder? Physicists in the Netherlands have done just that. Their research could lead to better ink jets – and possibly better teapots. You can find out more in “Liquid jet coils around cylinder”.

All-optical network mimics the brain’s neurons and synapses

A prototype artificial neural network (ANN) that uses only light to function has been unveiled by researchers at the University of Münster in Germany and the University of Exeter and University of Oxford in the UK. Their system can learn how to recognize simple patterns and its all-optical design could someday be exploited to create ANNs that can process large amounts of information rapidly while consuming relatively small amounts of energy.

ANNs mimic the human brain by using artificial neurons and synapses. A neuron receives one or more input signals and then uses this information to decide whether to output its own signal to the network. Synapses are the connections between neurons and can be “weighted” to favour signal propagation between certain neurons. An ANN can be trained to perform a task such as recognizing a pattern by sending multiple examples of the target pattern through the ANN while tweaking the synaptic weights until all examples of the target pattern elicit the same output from the ANN.

Difficult architecture

Relatively simple ANNs can be implemented on a computer. However, the conventional computer architecture of having a separate processor and memory makes it very difficult to implement the large numbers of neurons and synapses required to perform practical tasks.

One alternative is to create an ANN in which signals flows in the form of light pulses through an optical network. This is attractive because unlike electronic signals in a silicon chip, large amounts of light-encoded data can move quickly through optical materials without generating much heat. Furthermore, large amounts of information can be sent through an optical system by multiplexing the data using several different colours of light.

There is, however, one big downside to the optical approach: light signals do not normally interact with each other – and interactions are required in the operation of both neurons and synapses. One way of getting around this is to convert optical signals to electrical signals – which interact easily — before converting the signals back to light for further transmission. This not an attractive solution because constant conversion and reconversion greatly increases the complexity and energy consumption of the network, while slowing the flow of information.

Phase-change material

In this latest all-optical neural network, the light-interaction problem is solved by using a “phase-change material” to create both the neurons and the synapses. This material switches between crystalline and amorphous phases when heated by a laser pulse. The amorphous phase is highly transparent, whereas the crystalline phase is nearly opaque.

“Because the material reacts so strongly, and changes its [optical] properties dramatically, it is highly suitable for imitating synapses and the transfer of impulses between two neurons,” says Johannes Feldmann who is part of the Münster team.

Using a phase-change material, the team built an all-optical chip comprising four artificial neurons and 60 synapses. The team tested their chip by using two established ANN learning algorithms – supervised and unsupervised learning – to train their network to recognize images made from black-and-white pixels in a 3×5 grid.

The team is now working towards creating much larger optical networks by implementing the technology on silicon optical chips using a commercial process.

The research is described in Nature.

Water molecules flip during potential switch

water interface image-1040

The interface between electrode and electrolyte is notoriously difficult to probe. The structure of water at these surfaces affects reactions for many naturally occurring phenomena as well as influencing the performance of electrode materials. Now researchers led by Jian-Feng Li and Jun Cheng have combined Raman spectroscopy and ab initio molecular dynamics simulations to study the orientation of water molecules at electrochemical surfaces. Using their methods, the researchers were able to identify three characteristic water configurations at the interface while sweeping a potential difference across the electrodes.

The researchers used a technique that enhances the Raman signal – scattered light that provides highly detailed information of the structure under study, in this case interfacial water. They placed gold nanoparticles with ultrathin silica shells (to give an inert interface) on a single-crystal Au (111) surface and applied a potential bias to create a “hotspot” between the single-crystal surface and the nanoparticle. At this “hotspot”, the Raman signal is six orders of magnitude larger than the surrounding bulk. From the spectroscopic shifts recorded as they modified the potential across the electrodes the researchers uncovered three distinct regimes of water ordering at the surface.

The research team. Credit: Jian-Feng Li

Simulations point at water orientation

Using ab-initio molecular dynamics simulations (AIMD), the researchers were able to further study the orientation of water molecules at the Au(111) electrode surface. Their simulations showed good agreement with the in situ Raman experiments indicating three different orientations of water molecules as a function of negative potential bias.

At a potential bias of -1.3 V below the potential of zero charge (PZC, when the electrode surface is uncharged), the water molecules oriented “parallel” to the electrode surface. Between -1.3 and -1.85 V, the water molecules tilt slightly so that one hydrogen bond tilts to be almost parallel to the surface and the other tilts towards the negatively charged electrode, an orientation the researchers describe as “one-H-down”. At lower voltages, a fraction of the water molecules orient themselves to a “two-H-down” configuration.

These fundamental results greatly improve our understanding of the interfacial water at electrochemical surfaces, which may help efforts to optimize electrode behaviour. Furthermore, this study shows the power of coupling spectroscopic measurements with computational methods.

Full details are reported in Nature Materials.

  • This article was updated 13th May 2019 with the article link

Photoacoustic microscopy captures variation within tumours

A method to determine the metabolic activity of thousands of individual cells per hour in vitro has been demonstrated by researchers in the US. The team used photoacoustic spectroscopy, in which laser pulses generate an ultrasound signal upon absorption by specific molecules, to measure the degree of oxygen saturation in haemoglobin. Improving significantly on the throughput rate of existing measurement techniques, the new method could give clinicians a more complete picture of tumour heterogeneity, leading to more accurate diagnoses and personalized cancer therapies (Nature Biomed. Eng. 10.1038/s41551-019-0376-5).

One way in which cancer cells differ from healthy cells is in their rate of oxygen consumption. Fast-growing cancers are sustained by correspondingly fast metabolisms, prompting treatments that target cellular metabolic processes. There is a challenge in the fact that cancers, although originating from a single mutated cell, acquire further mutations as they proliferate and can differentiate into a variety of cell types. This means that a typical tumour comprises a diversity of genotypes and phenotypes, and it cannot be assumed that a given treatment will affect the whole tumour equally. Oncologists, then, need a way to determine in detail the range of metabolic characteristics present in a tumour.

Addressing this issue, two collaborating teams led by Jun Zou at Texas A&M University and Lihong Wang at California Institute of Technology have described a way to profile several thousand tumour cells at a time. First, the researchers created an array of microwells, each of which was large enough to hold a single cell and some blood to supply oxygen. The team populated some of these microwells with non-cancerous cells derived from a mouse, some with cells from a human lung-cancer culture, and others with cells from tumours excised from breast-cancer patients.

When the researchers illuminated the microwells with 532 and 559 nm lasers, the energy absorbed by the cells was converted into a pulse of ultrasound that was picked up by an ultrasonic transducer. Oxygenated and deoxygenated haemoglobin have distinct absorption profiles at the two frequencies used, so the team could translate the ultrasound signal into a measure of oxygen saturation. Making one measurement at the start of the experiment and another 15 minutes later, the researchers determined the rate of oxygen consumption for each individual cell.

Photoacoustic microscopy

As predicted, the healthy cells exhibited lower metabolic rates on the whole than the cancer cells. And while the healthy cells showed a near-normal distribution, the metabolic rates of the cancer cells were more chaotically distributed, indicating a high degree of heterogeneity.

The cells also differed in how they responded to hypoxia, which the researchers investigated by supplying healthy and lung-cancer cells with relatively deoxygenated blood. The metabolic rates of both cultures decreased when starved of oxygen, but the effect was more pronounced in the healthy cells. This might seem paradoxical given cancer cells’ usual metabolic profligacy, but Zou has an explanation.

“Because cancer cells consume more oxygen, cells buried deep inside a tumour can sometimes face an insufficient supply, and tend to develop a better adaptation to hypoxia,” says Zou. “This is just like weeds. When dry, they don’t die. When wet, they grow like crazy.”

Hypoxia within tumours is associated with resistance to chemotherapy and radiotherapy, so a better understanding of cancer cells’ behaviour under such conditions is vital. Characterizing the metabolic rate of large numbers of individual cells could also yield information about treatment progress and likely success. Measuring tumour cells’ activity after an initial round of therapy, for example, could indicate whether a tumour is resistant or sensitive to treatment, informing subsequent clinical decisions. Focusing on cancer cells circulating in blood, meanwhile, can help predict a tumour’s metastatic potential, which is linked to cellular metabolic rate.

“We expect the work could have a huge impact on personalized cancer treatment and the development of new cancer drugs,” says Zou. “Furthermore, the entry barrier entry for this technology is low, so it could be used widely.”

Copyright © 2026 by IOP Publishing Ltd and individual contributors