
Cardiac hybrid imaging predicts adverse cardiac events

© AuntMinnieEurope.com

A cardiac hybrid imaging technique that fuses SPECT myocardial perfusion imaging (MPI) with coronary CT angiography (CCTA) scans can help predict major adverse cardiac events in patients suspected of having coronary artery disease, according to a study published in Radiology.

In a retrospective study, researchers from Switzerland used software-based cardiac hybrid image fusion to analyse patients who underwent CCTA and SPECT MPI exams. They discovered that patients with abnormal findings on cardiac hybrid imaging had a significantly greater risk of experiencing a major adverse cardiac event, including death (Radiology 10.1148/radiol.2018171303).

The comprehensive assessment of coronary artery disease offered by cardiac hybrid imaging may optimize treatment decision-making and minimize unnecessary invasive intervention, senior author Philipp Kaufmann, chair of nuclear medicine and director of cardiac imaging at University Hospital Zurich, told AuntMinnie.com.

“For risk stratification, a hybrid image confers more information than any other modality, particularly in those with a pathologic finding,” he said. “The most important implication for evaluation of known or suspected stable coronary artery disease is that [cardiac hybrid imaging] allows patients to be evaluated non-invasively.”

Two modalities are better than one

Although recent research has confirmed the high diagnostic yield of CCTA for obstructive coronary artery disease, its use as a first-line test is long in coming. A drawback of CCTA is its limited ability to provide insight into haemodynamically relevant stenoses, which may play a part in its considerably lower usage rate compared with MPI. On the other hand, nuclear stress testing via SPECT MPI or PET MPI is specifically geared toward identifying ischemia, but it often overestimates the need for invasive procedures.

One method that may compensate for the shortcomings of each individual imaging modality is cardiac hybrid imaging, which fuses images from CCTA and MPI and provides the anatomic and functional information of both at once, Kaufmann noted. Several studies have demonstrated the technique’s increased diagnostic value over examining images from each modality alone or side by side.

Hybrid imaging

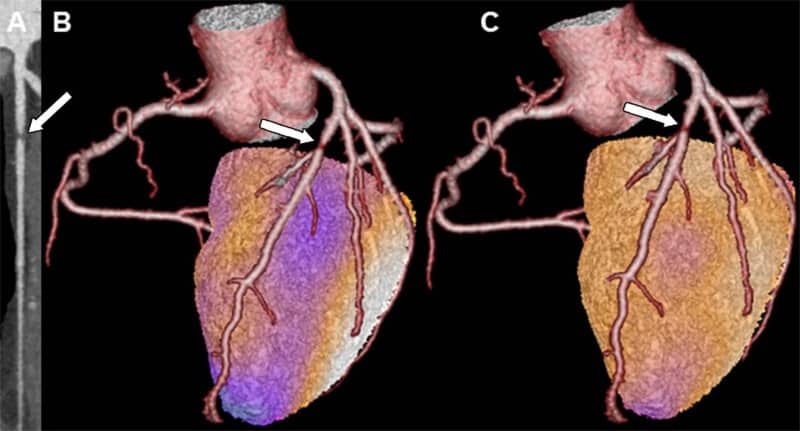
“Particularly in patients with multiple lesions or complex coronary anatomy, it is, in many cases, very difficult to correctly identify the culprit lesion,” he said. “Only a comprehensive assessment of both pieces of information with hybrid imaging allows [physicians] to correctly assign a coronary artery with a lesion to the ischemic territory.”

Exploring the prognostic potential of cardiac hybrid imaging, Kaufmann and colleagues evaluated patients who underwent both CCTA and SPECT MPI at their institution between May 2005 and December 2008. To fuse the MPI and CCTA datasets, they used cardiac imaging fusion software running on a postprocessing workstation (CardIQ Fusion; Advantage Workstation 4.3, GE Healthcare).

They separated the resulting hybrid imaging data into three distinct categories:

  • Cases with both 50% or greater stenosis on CCTA and evidence of ischemia on MPI suggesting coronary artery disease
  • Cases with either stenosis on CCTA or ischemia on MPI
  • Cases with normal findings on CCTA and MPI

The researchers compared the effectiveness of each scenario for predicting major adverse cardiac events, including death, heart attack, unstable chest pain and coronary revascularization. In all, there were 160 cardiac events recorded in the study population within the 10-year follow-up period.

Long-term prognostic value

Among 375 patients, cardiac hybrid imaging showed that 46 had both 50% or greater stenosis and ischemia, 113 had only one or the other finding, and 216 had entirely normal findings.

The group found that a matched finding, i.e., indicating both stenosis and ischemia, was associated with more than five times the risk of a major adverse cardiac event compared with normal findings. The presence of only one of the abnormal findings was associated with over three times the risk of a cardiac event compared with normal findings.

Predicting adverse events

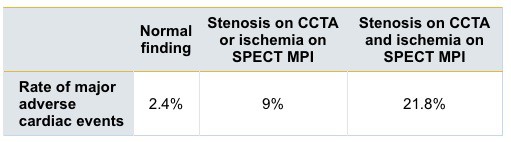
The results consistently demonstrated that patients whose cardiac hybrid imaging data identified both stenosis and ischemia had a considerably worse outcome than patients with either one of the signs alone or neither of the abnormal signs. Patients with altogether normal imaging test results had a very favourable long-term prognosis.

These findings confirm the excellent risk stratification ability of cardiac hybrid imaging in patients who are suspected of having coronary artery disease, Kaufmann said. They also support the use of CCTA as an initial, non-invasive evaluation of such patients, followed by MPI only for patients with abnormal CCTA results.

“We should start with a coronary CT angiography exam and, if normal, we can stop testing there,” he said. “But if there is a lesion, we should assess ischemia with a nuclear scan (SPECT or PET MPI), and if there is an ischemia, we should take full advantage of both modalities by fusing the results together to make a hybrid image.”

Radiologists may be key

Ultimately, the extensive assessment of coronary artery disease provided by cardiac hybrid imaging optimizes treatment decision-making and minimizes unnecessary invasive angiographies, according to the authors. What’s more, using this technique could potentially improve the low yield of diagnostic invasive coronary angiography and facilitate evidence-based coronary interventions.

A conspicuous limitation of cardiac hybrid imaging is that it requires an increase in effective radiation dose (roughly 10 mSv in all) because it involves two contrast-enhanced imaging exams rather than just one, the authors noted. However, clinicians may be able to lower this elevated radiation dose by applying reconstruction algorithms.

Another major barrier seems to be the limited knowledge of guidelines and proper implementation of methods for evaluating patients with stable coronary artery disease, Kaufmann said.

“Unfortunately, structures of hospitals do not always facilitate hybrid imaging, because CT is ‘owned’ by one department and SPECT or PET by another, which may be an obstacle for the combination of datasets from different modalities,” he said. “Radiologists may be key in helping clinicians to refer to the best non-invasive test by knowing the technical and clinical guidelines in general (and not only our own for radiology), and by being involved in the multidisciplinary boards.”

In the near future, the researchers hope to conduct a trial demonstrating the positive impact hybrid imaging can have on patient outcomes. They also plan on developing a “triple hybrid” imaging technique that combines CCTA and SPECT MPI scans with information concerning coronary artery shear stress. They believe that adding information about shear stress to hybrid imaging could help identify lesions that do not yet affect ischemia but may in the future.

  • This article was originally published on AuntMinnieEurope.com © 2018 by AuntMinnieEurope.com. Any copying, republication or redistribution of AuntMinnieEurope.com content is expressly prohibited without the prior written consent of AuntMinnieEurope.com.

‘Heartbeat’ detected in drop of gallium held in a graphite corral

A drop of liquid gallium will oscillate like a beating heart when placed inside a ring-shaped electrode. The frequency of motion can be adjusted from 2-10 Hz by changing the voltage that is applied to the system. The effect was discovered by physicists in Australia and China, who say that it could be used to create new types of fluid-based timers and actuators.

It is well known that a drop of mercury will repeatedly flatten and then become spherical when exposed to iron –  a process driven by chemical changes to the drop’s surface tension. This heartbeat effect, however, is difficult to control and is not practical for use in fluidic devices.

Now, Xiaolin Wang and colleagues at the University of Wollongong and the Chinese Academy of Sciences have shown that a similar effect can occur in gallium, which is a liquid at temperatures above about 30° C. The team studied drops that were 50-150 µL in volume and placed in a sodium hydroxide electrolyte at 34° C.

Graphite corral

In their experiment, a drop is corralled within a graphite ring of inner diameter 11 mm in a petri dish containing the electrolyte. To create the oscillations, a positive electric potential is applied to the ring and the dish is tilted slightly so that the denser gallium falls to the lower edge of the ring. When the drop touches the positive ring, the surface of the gallium becomes oxidized and this causes the surface tension of the drop to fall to nearly zero.

The low surface tension allows the gallium to pancake on the surface of the petri dish in a process called electrowetting. This shifts the centre of mass of the gallium drop away from the edge of the ring and towards the centre of the dish. This shift causes the gallium to break contact with the ring and when this happens electrostatic repulsion pushes the drop towards the centre of the dish. Once away from the ring, hydroxyl ions etch the oxide from the surface of the drop and the surface tension increases. The result is a spherical drop that once again moves under gravity to the lower edge of the ring – where the process repeats itself.

The team found that the frequency of the oscillation can be fine-tuned by adjusting the voltage on the ring. They also found that smaller drops oscillated more rapidly than larger drops and that the frequencies of smaller drops are more sensitive to voltage changes. Increasing the angle of inclination of the petri dish also boosted the frequency. Oscillations were also observed using a hydrochloric acid electrolyte, but at frequencies below 2 Hz.

Writing in Physical Review Letters, the team says that the effect could be put to work in a range of applications including reconfigurable electronics, actuators, artificial muscles, soft robotics and lab-on-a-chip microfluidic devices.


Newcastle’s new generation

Physics has played an integral part at Newcastle University ever since the institution was founded in 1963 via an act of parliament. The university itself can trace its roots back to the early 1870s, when the demands of the north-east industrial sector led to the creation of the College of Physical Sciences. It was merged with the School of Medicine and Surgery in 1937 to become Kings College of Durham University, which then evolved into Newcastle University.

The present institution and its forerunners have been especially renowned for their research into geophysics. In 1926, for example, Sir Harold Jeffreys discovered that the Earth’s planetary core was liquid, while in the 1960s Keith Runcorn used the most precise magnetometers at that time to make pioneering measurements of magnetism in rock to confirm the existence of continental drift and plate tectonics.

Physics in decline

In 2004, however, Newcastle University hit the headlines for all the wrong reasons. Back then, the numbers of students taking physics had been falling for a decade, with a third of UK physics departments having closed. On top of this came the 2001 Research Assessment Exercise, which judged research in UK university departments on a scale from 1 to 5*. Physics at Newcastle had scored four, an average rather than a terrible mark, but when the government chose to direct most of the funding into the powerhouses ranked 5* and 5, it proved the final blow. Various rescue options were floated such as a massive investment in physics or moving Newcastle physicists down the road to Durham. However, when those options fell through, the decision was made to close the physics department.

Newcastle was not alone. University departments in physics or related physical-science subjects closed or merged with other departments at Dundee, Exeter, Keele, Kings College London, Queen Mary, Reading, Sussex and Swansea. In Scotland, physics departments joined forces to form the Scottish Universities Physics Alliance to tackle such pressures. The shock waves sent through the sector then led to calls to protect core science disciplines, and the government soon placed physics on a list of subjects of “national strategic importance”. But for Newcastle and these other institutions, the initiative came too late.

Thankfully, the start of the next decade saw a surge in popular interest in physics due in part to prominent media coverage, and physics appeared to be emerging from the doldrums and getting back on track. It had re-entered the top 10 most popular subjects for 16- to 18-year-olds in the UK and undergraduate numbers started to climb back up. The increase in tuition fees of up to £9250 per year also helped by leading students to choose courses that were more likely to get them a good job. The motivation to restart physics at Newcastle was clear and met with great excitement from physicists around the university.

The department was thus reopened in 2015 by theoretical physicist and best-selling author Paul Davies, who himself had worked at the university from 1980 before moving to Australia in 1990. The first cohort comprised 39 students, exceeding all expectations, and over the past three years the intake has grown to 55 per year.

Of the 39 students in that first physics cohort, 17 will leave this month with a bachelor’s degree while the remaining students will continue on a four-year MPhys course. For the graduating students, this momentous occasion marks the culmination of their three-year journey of intellectual discovery and personal achievement, and the start of a variety of new adventures.

For example, Victoria Atkinson, who started her physics studies at Newcastle following a degree in French, has secured a place at the Diamond Science and Technology Centre for Doctoral Training at Warwick University. After completing her Master’s there, she will return to Newcastle to start a PhD. Meanwhile, Josh Larue (pictured), won a government scholarship from his home country of the Seychelles to study physics at Newcastle. After a period back home, he hopes to return to Newcastle one day for further study.

Starting a physics programme and department is no easy task. The previous infrastructure had long since been mothballed and many of the personnel had moved on. The exile from student and research league tables, which continues to date, posed challenges for recruitment and funding. Undaunted by these issues, the university pushed ahead with a sizeable initial investment of four academic positions and £2m for teaching laboratories and study space.

While the physics PhD programme had continued even when the department itself had shut, it had only a handful of students. The aim is to grow this cohort to around 60 graduate students over the coming decade.  It is also expected that the number of staff teaching physics, which is currently around 20, will more than double.

Starting from scratch

The restart also created a unique opportunity to design a modern, progressive and robust department. A culture of diversity and widening participation has been embedded from the start, with outreach and recruitment targeting underrepresented groups of students and the academic staff who act as their role models. A designer portfolio of research areas is being created, balancing fundamental and traditional subjects such as astronomy and cosmology, with emerging areas such as photonics and biophysics. This not only provides students with a disciplinary core but also the potential to tackle current and future challenges.

Learning lessons from the past, the investment in academic staff and research infrastructure will continue over the next decade to ensure the critical mass to weather any future storms that may arise.

Super-resolution imaging provides insight into Alzheimer’s disease

Alzheimer’s disease begins to develop 10 to 20 years before memory problems manifest, but currently, we are not able to clearly see why the disease starts. The earliest detectable evidence of pathological change leading to Alzheimer’s disease is the accumulation of waxy deposits called amyloid plaques in the brain.

Researchers at Purdue University have developed a super-resolution nanoscope that provides a 3D view of brain molecules with 10 times greater detail than conventional microscopes. Indiana University researchers have now used this new instrument to investigate the structure of amyloid plaques (Nature Methods 10.1038/s41592-018-0053-8).

“While strictly a research tool for the foreseeable future, this technology has allowed us to see how the plaques are assembled and remodelled during the disease process,” says Gary Landreth from the Stark Neurosciences Research Institute. “It gives insight into the biological causes of the disease, so that we can see if we can stop the formation of these damaging structures in the brain.”

Brain tissue is challenging to image because it is packed with extracellular and intracellular constituents that distort and scatter light. The super-resolution nanoscope, developed by Fang Huang‘s research team at Purdue, uses adaptive optics – deformable mirrors that change shape – to compensate for aberration that occurs when light signals from single molecules travel through cells or tissue structures at different speeds.

To image brain tissue, the researchers developed techniques that adjust the mirrors in response to sample depths to compensate for aberration introduced by the tissue. At the same time, they intentionally introduce extra aberration to maintain the position information carried by a single molecule.

The researchers used the nanoscope to image mice genetically engineered to develop Alzheimer’s plaques. The system reconstructs the all the tissue’s cells and cell constituents at a resolution six to 10 times higher than conventional microscopes, allowing a clear view through 30 µm thick brain sections of a mouse’s frontal cortex. The reconstructed images revealed that amyloid plaques are like hairballs, entangling surrounding tissue via small fibres that branch off waxy deposits.

“We can see now that this is where the damage to the brain occurs. The mouse gives us validation that we can apply this imaging technique to human tissue,” Landreth explains.

The collaboration is now using the nanoscope to observe amyloid plaques in human brain samples, and to study how the plaques interact with other cells and get remodelled over time.

“This development is particularly important for us as it had been quite challenging to achieve high-resolution in tissues,” says Huang. “We hope this technique will help further our understanding of other disease-related questions, such as those for Parkinson’s disease, multiple sclerosis and other neurological diseases.”

Researchers discuss how super-resolution imaging could reveal why Alzheimer’s disease starts. (Courtesy: Purdue University/Erin Easterling)

Forward energy thinking on renewables and nuclear

There have been blasts of sense on UK energy policy from the National Infrastructure Commission (NIC), the government’s advisory body, and also from its advisory Committee on Climate Change (CCC), in relation to the relative prospects for nuclear and renewables.

In its new National Infrastructure Assessment, the NIC said the government “should not agree support for more than one nuclear power station beyond Hinkley Point C before 2025”, since their cost seemed unlikely to fall, while renewables were getting cheaper and could prove a safer investment. The CCC, in an annual progress report, although more circumspect on nuclear, said, while Hinkley was going ahead, “limited progress has been made with other new nuclear projects”, and concluded that “if new nuclear projects were not to come forward, it is likely that renewables would be able to be deployed on shorter timescales and at lower cost”.

There does seem to have been a shift in view. Whereas a decade ago few thought that renewables could be affordable and play a major role in electricity generation, the NIC said that the sector had undergone a “quiet revolution” as costs have fallen. It suggests that by 2030 a minimum of 50% of power should come from renewables, up from about 30% now, and calculates that the average costs for a 2030-50 scenario with 90% renewables and less than 10% nuclear would be slightly less than for a scenario with 40% renewables and around 40% nuclear. It adds “the higher cost of managing the variable nature of many renewables (‘balancing’) is offset by the lower capital cost, which translates into lower costs in the wholesale market”.

 The NIC looks to wind and solar PV playing leading roles, both being “allowed to compete to deliver the overwhelming majority of the extra renewable electricity needed as overall demand increases, with measures to move them to the front of the queue for Government support”. The CCC, however, complains that, given the block on access to the Contract for Difference (CfD) support system, at present “there is no route to market for cheap onshore wind”. It’s the same for large-scale PV solar. The fact that these options are now cheaper seems to have been used as an excuse to remove access to the CfD market, without which, even if they get zero subsidies, they are finding it hard to expand.

The NIC wants a revamp of the CfD system, with “technologies that have recently become cost competitive, such as offshore wind”, moved to the “Pot 1” category of “developed” options, from the Pot 2 category of “still developing” options, following the next CfD auction, which is set for the spring of 2019. It says “Pot 1 should be used for the overwhelming majority of the increase in renewable capacity required”. It seems to suggest that onshore wind should be re-included: it is in Pot 1, but is being treated as an outsider. The NIC doesn’t look much at Pot 2 options, which include wave and tidal power, except to say that some support should be offered especially where they are likely to be able to contribute to the reduction of system costs in future”. However, it suggests that tidal lagoons are unlikely to be cost-effective or a significant option (see my next post), but nevertheless says tidal power “should be allowed to compete on an equal basis with other technologies for Contracts for Difference”.

One of the NIC’s main concerns, however, seems to be to slow down nuclear aspirations. Sir John Armitt, NIC’s chair, said: “We’re suggesting it’s not necessary to rush ahead with nuclear. Because during the next 10 years we should get a lot more certainty about just how far we can rely on renewables. One thing we’ve all learnt is these big nuclear programmes can be pretty challenging, quite risky – they will be to some degree on the government’s balance sheet. I don’t think anybody’s pretending you can take forward a new nuclear power station without some form of government underwriting or support. Whereas the amount required to subsidize renewables is continually coming down. We’ve seen how long it took to negotiate Hinkley – does the government really want to have to keep going through those sort of negotiations?” By contrast, he says, renewables offered us a “golden opportunity” to make the UK greener and make energy affordable.

That applied to heat as well as electricity. The NIC says the government needs to make progress towards zero carbon heat by establishing the safety case for using hydrogen as a replacement for natural gas, followed by trialling hydrogen at community scale by 2021 and then, if all is well, a trial to supply hydrogen to at least 10,000 homes by 2023, including hydrogen production with carbon capture and storage (CCS). In parallel the NIC says, by 2021, the government should establish an up-to-date evidence base on heat pumps performance within the UK building stock and the scope for future reductions in the cost of installation.

So the UK government is backing both main horses in the green heat race – green gas, in the form of hydrogen, and electrification, via heat pumps. Though oddly there was no mention of the third possible option, local green heat networks, something the government is beginning to take seriously, at long last starting up its £320m heat net support programme. That, admittedly, is small, but the Department for Business, Energy and Industrial Strategy (BEIS) has claimed that heat nets could expand from only supplying 1% of building heat demand now, to meet 17% of heat demand in homes and up to 24% of heat demand in industrial and public-sector buildings by 2050. So it’s an odd infrastructure omission by NIC. Maybe since it is only relevant to urban/industrial areas, whereas gas and electricity reach all consumers.

The NIC also wants the government to move more on what is done with this energy once it’s delivered – cutting energy waste. It wants the rate of installations of energy efficiency measures in the building stock to rise to 21,000 measures a week by 2020, “maintained at this level until a decision on future heat infrastructure is taken”. It says that policies to deliver this should include allocating £3.8 billion between now and 2030 to deliver energy efficiency improvements in social housing.

That’s a quite ambitious series of proposals. But, as the CCC makes clear, the UK does need to get moving on the heat side, as well as on power and transport, if it is to meet its climate targets. The NIC says “highly renewable, clean, and low-cost energy and waste systems increasingly appear to be achievable”. It notes that its modelling “has shown that a highly renewable generation mix is a low-cost option for the energy system. The cost would be comparable to building further nuclear power plants after Hinkley Point C, and cheaper than implementing CCS with the existing system. The electricity system should be running off 50% renewable generation by 2030, as part of a transition to a highly renewable generation mix”.

That’s a pretty good package, at least for starters. Though Richard Black, from the Energy and Climate Intelligence Unit, claimed that, if the nuclear programme is slowed as NIC suggests, even with a 50% renewable contribution by 2030, the UK will miss its non-fossil energy target. So it would need more than 50% renewables. That depends on what happens to power demand. If the “decarbonisation by electrification” programme is slowed (not so many heat pumps), then power demand would no doubt continue to fall, as it has been over recent years. So there would be less need for new nuclear or extra renewables. But there would then be a need for green gas or green heat networks, or both. Biogas from farm and home waste anaerobic digestion is one obvious source in either case, but may be limited, so a bit of solar heat and geothermal heat fed into heat networks would also be useful. As well as biomass used in combined heat and power (CHP) plants.

Interestingly, a new study for the CCC from Imperial College looks at hydrogen gas grids and also domestic electric heat pumps and says that a hybrid mix may be the least cost option, with the “hydrogen alone” route being the most costly. Oddly, as with the NIC study, and also the new set of fascinating scenarios from National Grid in its Future Energy Scenarios series, there’s not much on heat grids or CHP. And one version of the hydrogen route they all look at relies on CCS to limit emissions, since the feedstock source is fossil fuel. They also look at the alternative carbon-free route, “power to gas” conversion of surplus renewable electricity to hydrogen, via electrolysis. It’s more expensive than the fossil route, but it avoids costly and as yet unproven CCS. With 50% of variable renewables on the grid (or 75% in one of National Grid’s scenarios) there would certainly often be plenty of surplus output.  Though some of that would perhaps be better used for (later) power generation to balance lulls in renewables. But there may be enough for both uses – heat and power. Lots of possible paths ahead then, and maybe a bit of a squeeze – though that could perhaps be avoided if the blocks on PV solar and onshore wind were removed.

This post replaces one promised on oil company views. That will follow, but after another intervening post – on the tidal lagoon decision.

Integrated electronics at 50 – projecting the future of the field

Video Player is loading.
Current Time 0:00
Duration 0:00
Loaded: 0%
Stream Type LIVE
Remaining Time 0:00
 
1x
    • Chapters
    • descriptions off, selected
    • subtitles off, selected

      The development of the integrated circuit in the 1950s raised the bar of what electronics could achieve, setting the path towards the ubiquitous electronic devices of today. For several decades the number of transistors per chip has doubled every two years, as devices become simultaneously smaller, cheaper and more functional. This persistent increase in chip density was first recognised by Gordon Moore and has since been termed “Moore’s Law”.

      A key milestone in establishing integrated electronics as an integral part of day to day living was the founding of Intel by Moore and cofounder Robert Noyce on 18th July 1968. Fifty years on, as Moore’s Law seems to be reaching its limits, we speak to researchers in academia and industry about some of the developments on the horizon that they are most excited about.

      Interviewees include specialists in bioelectronics, flexible electronics, energy harvesters and sensors, as well as the Managing Director of the Organic and Printed Electronics Association, a global network for flexible electronics.

      Mysterious radio signals could be from new type of neutrino

      Physicists have been left scratching their heads following the observation of two unusual radio signals by the balloon-borne Antarctic Impulsive Transient Antenna (ANITA). While many other signals spotted by ANITA are produced by cosmic rays crashing down through the atmosphere, the two anomalous events seem to be caused by particles travelling up through the Earth’s crust. Those particles may be neutrinos but their properties seem at odds with the Standard Model of particle physics.

      ANITA, developed by a US-led collaboration and funded by NASA, contains 96 radio antennas suspended from a helium balloon. Flying at an altitude of nearly 40 km for several weeks at a time, it detects radio waves emanating from a 1.3 million square kilometre swathe of Antarctica. Its primary purpose is to pick up the signals produced by cosmic neutrinos travelling from deep space to try and pinpoint the origin of ultra-high energy cosmic rays – which are believed to be produced in the same places as cosmic neutrinos.

      The neutrinos of interest pass through the Earth and interact with atomic nuclei in the Antarctic ice sheets, producing a shower of charged particles that then emit radio waves. ANITA also picks up signals from cosmic rays as they travel downwards and collide with the atmosphere. This also generates radio waves, which bounce off the ice and into ANITA’s antennas.

      Tell-tale polarizations

      The two types of signal can be distinguished by measuring the radio waves’ polarization – signals from cosmic rays have horizontal polarization while neutrino signals have vertical polarization. In addition, the observatory separates out the small subset of air showers whose radio emissions do not bounce off the ice but instead travel straight towards it at a very shallow angle almost parallel to the ground. Since these waves are not reflected they don’t undergo a phase inversion, meaning they are 180˚ out of phase compared to the bouncing variety.

      Data from ANITA’s first flight in 2006-7 contained one unusual-looking event. This was horizontally polarized and for all intents and purposes looked like a signal from a cosmic ray. It also underwent no phase inversion, suggesting that the originating particle would have travelled horizontally. However, the signal arrived at a much steeper angle – from well below the horizon.

      Trying to explain what it had seen, Peter Gorham of the University of Hawaii and colleagues in the ANITA collaboration hypothesized that the signal was caused not by the air shower from a neutrino but by the air shower from a neutrino’s interaction product, probably a tau lepton. The idea is that a tau neutrino would interact either in or just below the ice, generating a tau lepton that would then continue along the neutrino’s trajectory but only decay once it had emerged from the ice. The resulting radio waves would therefore be horizontally polarized.

      But this idea is problematic because, unlike neutrinos at lower energies, the kind of high-energy neutrino that would have been responsible for the signal should interact after travelling for just a few hundred kilometres through the Earth (a neutrino’s interaction cross section getting much bigger at higher energies). However, the researchers calculated, given the neutrino’s trajectory, that it must have passed through about 7000 km of solid matter  – which they reckon it only had a one in 100,000 chance of doing so.

      Human activities

      Gorham says that the event may have been caused by human activities, but when he and his colleagues looked at data from ANITA’s third flight in 2014-15, they spotted a very similar looking signal. The researchers calculate that the two events constitute roughly 4σ evidence of an unexplainable anomaly. “It’s still possible that the events are due to two isolated people, each transmitting a single radio pulse very far from the nearest Antarctic base,” he says. “But that seems very unlikely at this stage.”

      Alan Watson of the University of Leeds in the UK agrees that the signals are unlikely to be anthropogenic. A tau neutrino, on the other hand, he says, “seems reasonable”, but adds he is surprised that similar events have not been see by either the IceCube detector at the South Pole or the Pierre Auger Observatory in Argentina.

      Alexander Kusenko of the University of California Los Angeles argues it is possible that the signals did in fact bounce off the ice but didn’t undergo a phase inversion, perhaps because they reflected off a lower density layer beneath the surface. Pavel Motloch of the University of Chicago, meanwhile, suggests that the neutrinos’ interaction cross-section may have been miscalculated. “The calculations are experimentally verified at much smaller energies than ANITA probes and extrapolation is always dangerous,” he says.

      Cosmic switch-on

      Another possibility explored by Gorham’s group is the switching on of a very powerful source of cosmic neutrinos at just the right point in space and time to provide the flux needed to overcome Earth’s stopping power. Scouring astrophysical catalogues, he and his colleagues found a possible source for the second event – a supernova observed in 2014 – but no obvious candidates for the first.

      That leaves the door open to more exotic possibilities. Indeed, says Gorham, several theorists are now assessing whether the unusual events could be related to sterile neutrinos – exceptionally inert cousins of normal neutrinos predicted by some extensions of the Standard Model that a few groups claim to have evidence for. The idea is that sterile neutrinos would traverse most of the Earth before transforming into tau neutrinos just below the surface.

      However, Gorham acknowledges that solving the mystery will not be easy. “Such limited statistics make it hard to really pin down the cause of the anomalous events,” he says. “But we will keep trying.”

      The research is reported in a paper on arXiv that has been accepted for publication in Physical Review Letters.

      Magnetic levitation promises to speed up tissue fabrication

      Researchers in Russia, Latvia and the US have developed a scaffold-, label- and nozzle-free technology that can fabricate complex human tissue and organs within just 30 seconds. The formative “scaffield” approach, as they have dubbed it, exploits magnetic levitation to produce 3D constructs, rather than the traditional layer-by-layer bioprinting approach, and the researchers believe it could be used in the microgravity conditions of space (Biofabrication 10 034104)

      The technique relies on the use of tissue spheroids, densely packed aggregates of living cells that can be used as building blocks for bioprinting functional human tissues and organs. Tissue spheroids offer the highest possible theoretical cell density, comparable with natural tissue, while their compact round shape makes them easy to handle and process.

      Tissue spheroids also have a complex internal structure and multicellular composition, and can even be pre-vascularized. When placed closely together so ther are directly touching, they can fuse to produce complex 3D tissue constructs – which is how tissue fusion occurs during natural embryonic development.

      “We believe that this scaffold-free approach is a new direction in ‘formative’ biofabrication”

      Vladimir Mironov, Laboratory for Biotechnological Research

      Several techniques are available to fabricate tissue and organs using tissue spheroids, but all rely on 3D scaffolds, nozzles and biolabels. One method, for example, requires cell aggregates to be placed into 3D scaffolds made from various biodegradable materials, while another involves attaching and spreading tissue spheroids on electrospun matrices. And, although researchers routinely use magnetic forces to create 2D patterns of tissue spheroids biofabricated from cells, these cells first need to labelled with magnetic nanoparticles.

      The new technique, developed a by team of researchers led by Vladimir Mironov of the Laboratory for Biotechnological Research “3D Bioprinting Solutions” in Moscow and Utkan Demirci of Stanford University, instead exploits magnetic levitation to assemble the tissue spheroids into a 3D structure. It therefore avoids the need for any scaffolds or labelling, and it also works without traditional nozzle-based bioprinters.

      Magnetic attraction

      Magnetic levitation of living material was first demonstrated at the end of the 20th century. In these pioneering studies, researchers guided the assembly of small magnetic objects suspended in a paramagnetic fluid medium that was positioned in a magnetic field gradient generated by strong permanent magnets.

      In these experiments, gadolinium particles (Gd3+) were used to paramagnetize the media in which the objects were suspended. These particles have already been approved by the US Food and Drug Administration (FDA) for use as contrast agents in magnetic resonance imaging, so are safe in low concentrations.

      Early experiments by Mironov and Demirci’s team confirmed that relatively weak magnetic fields could successfully levitate and assemble tissue spheroids taken from primary sheep chondrocytes. However, these procedures only worked in the presence of high levels, and thus toxic concentrations, of Gd3+. In their new work, they have used higher magnetic field gradients of up to 2.2 Tesla/cm to overcome this problem, which ensures that the concentration of Gd3+does not exceed 250 mM.

      Demirci explains that the technique can be used to manipulate and assemble millions of cells, making it possible to create a 3D biological contruct and then connect these constructs together. “Instead of synthetic or natural scaffolds, we have used a magnetic field as a temporal and removable support,” adds Mironov.

      “We believe that this scaffold-free approach is a new direction in ‘formative’ biofabrication,” Mironov told Physics World. “We envision that it will allow us to fabricate complex human tissue constructs and organ models extremely quickly compared to traditional layer-by-layer ‘additive’ biofabrication.”

      The researchers are now working on magnetic levitational assembly using high magnetic fields in the microgravity conditions of space. “This will allow for rapid assembly of 3D tissue constructs from tissue spheroids with the minimal concentration of paramagnetic Gd3+,” explains Mironov. “Another possible and interesting route to try might be a hybrid approach that combines both magnetic levitational assembly and acoustic levitational assembly, and Demirci’s team has already shown that acoustic fields can be used to produce 3D biofabricated constructs using live cells.”

      • Read our special collection “Frontiers in biofabrication” to learn more about the latest advances in tissue engineering. This article is one of a series of reports highlighting high-impact research published in Biofabrication.

      Carbon intensity of US grid dropped by 30%

      A new method for computing the carbon intensity of the US electricity sector could make it simpler to assess emissions trends over different timescales and by region. Electricity generation results in over a quarter of all US greenhouse gas emissions, and deep decarbonization of the sector is closely linked to meeting climate targets.

      Overall, the group based at Carnegie Mellon University, US, found that between 2001 and 2017 the average annual carbon dioxide emissions intensity of electricity production in the US decreased by 30%. The primary drivers for the change were an increase in generation from natural gas and wind accompanied by a reduction in coal-fired power.

      Thanks to the switch from coal to gas, all US regions showed at least some decline in carbon intensity over the period. But markets can disrupt this pattern. In the first half of 2017, for example, the US natural gas price climbed from under $2 per GJ to over $3 per GJ, leading to an increase in coal generation. Where renewables are available, energy providers have more options.

      The calculations point to large increases in wind generation across three of the eight North American Electric Reliability Council regions that cover the US lower-48 states, and at state level. By looking at generation levels month-by-month across multiple years, it’s clear that a rise in wind power has the potential to flatten summer peaks in natural gas demand.

      One idea under discussion is the use of high-voltage direct current (HVDC) transmission to move renewable power from region to region more efficiently. Analyses such as this study could identify seasonal peaks in the generation of low-carbon power at different sites across the country. Correlating these results could reveal where HVDC links would be most effective.

      “Negative seasonal correlations between two regions would mean that additional low-carbon power generated in each region could be shared, lowering the carbon dioxide intensity across regions,” explain the scientists in Environmental Research Letters (ERL).

      Making information readily available and quick to navigate is key to tracking progress and gaining insight into changes in the energy mix.

      “The goal is to have a method that is easily reproducible, temporally relevant and usable by different decision-makers,” writes the team.

      Quarterly emissions updates, open data, and analysis code are freely available at the Power Sector Carbon Index website.

      Signal analysis increases scintillator dosimeter accuracy

      Scintillator dosimetry

      Scintillator dosimeters monitor radiation therapy using a scintillating material that generates light in response to irradiation; this signal is then guided via optical fibre to a photodetector. One major advantage of such a device is that it measures the delivered radiation dose over a very small volume.

      “A scintillator dosimeter doesn’t affect how the dose is delivered to the target because the components used interact with the radiation the same way that water or tissue does,” explains James Archer from the University of Wollongong.

      Alongside the signal-of-interest, however, Cherenkov light is generated in both the scintillator and the fibre, which can compromise the dosimeter’s spatial resolution and accuracy. The simplest way to remove this unwanted signal is to use a parallel fibre without a scintillator to measure only the Cherenkov signal and subtract it from the dosimeter signal. This approach, however, is not optimal in beams with a high dose gradient, and increases the bulk of equipment.

      Instead, Archer and colleagues propose using a single probe with a signal analysis algorithm to temporally separate the Cherenkov radiation from the signal of a pulsed radiation beam (Biomed. Phys. Eng. Express 4 044003).

      Analysing the tail

      In a previous study, the team separated the fast rising edge of the detected signal – the Cherenkov signal – from the slow rising edge – the scintillation signal. This approach removed 74% of the Cherenkov light at the expense of only 1.5% of the scintillation signal. The main limitation here is that varying beam intensity during the pulse reduces the accuracy of determining the Cherenkov contribution.

      In this latest work, Archer and colleagues investigated whether using the tail of the signal can improve the accuracy. After the radiation beam pulse has stopped, the Cherenkov signal drops off rapidly while the scintillator signal decays more slowly, enabling separation of a pure scintillation signal.

      To study this premise, the researchers used a 500 µm-thick plastic scintillator optically coupled to a 10 m plastic optical fibre and read out by a photomultiplier tube. They irradiated a water tank with a 6 MV linac beam and placed the dosimeter inside to measure the delivered dose at various positions.

      Beam profile measurements revealed that the rising edge analysis overestimated dose compared with ionization chamber measurements, while the tail-based analysis underestimated the dose. The average of the two, however, agreed well with ionization chamber results.

      To quantify the differences between scintillator and ionization chamber measurements, the researchers calculated S values (the average sum of relative squared difference percentages) for a lateral beam scan at 15 mm depth, and a depth dose scan from surface to 200 mm. Using the averaged data improved the accuracy of beam profile results by 87% (to an S value of 2.20%) and depth dose results by 90% (to an S value of 0.050%).

      Depth dose results

      The researchers also calculated the uncertainties in the beam profiles and depth dose results. In all cases, the tail method produced lower variations between individual measurements than the rising edge method. While the larger uncertainties in the rising edge data served to increase uncertainty in the averaged results, the authors note that there is still an advantage in combining both data sets.

      “The tail of the radiation pulse provides an accurate measurement of relative dose,” explains Archer. “The rising edge analysis is slightly less accurate, but uses data from the whole pulse to determine the relative dose, and so will be proportional to the pulse duration. With these together, relative dosimetry can be done between differing pulse durations without having to measure the durations directly.”

      The study demonstrated that it is possible and practical to perform single-probe temporal Cherenkov removal techniques. The team is now working on using experimental data to construct beam intensity functions that can fit to the data to the entire shape of the pulse waveform. “This provides a more accurate and more robust method to determine the exact Cherenkov contribution to the signal,” says Archer. “We have also begun working on using machine learning algorithms to learn which parts of the signal we want and don’t want.”

      Copyright © 2025 by IOP Publishing Ltd and individual contributors