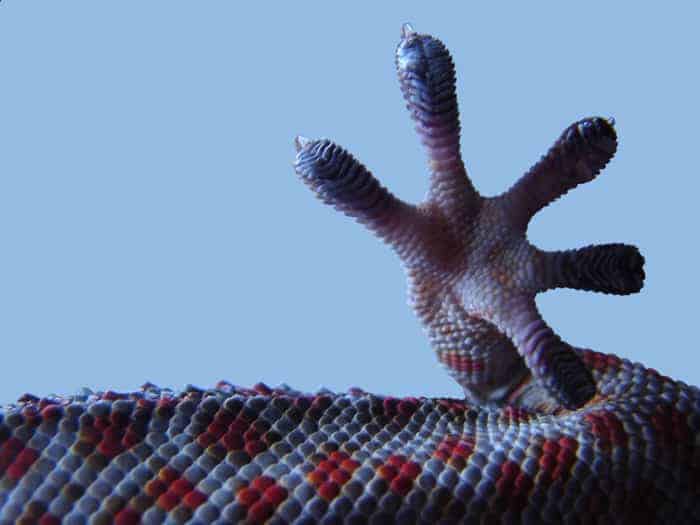
Inspired by microstructures on a gecko’s toepad, engineers in the US have created a directional adhesive with a grip that is 100 times larger in one direction than it is in the opposite direction. Based at Stanford University, the researchers say that their work shows that bio-inspired spatial variation can provide artificial microstructures with advanced properties and help close the performance gap between synthetic and natural materials.
Geckos are renowned for their ability to climb up smooth vertical surfaces like glass using microscopic hair-like setae that cover their toes. These setae branch, becoming finer and finer, before eventually terminating in flat spatulae that get so close to the surface that they create a dry adhesive that sticks through van der Waals forces. But, geckos are also able to easily and rapidly detach their feet as they scale obstacles.
In 2006, researchers at Lewis & Clark College and Stanford University, discovered that a gecko’s setae only grip in one direction. The setae all curve in the same direction and when the branched ends are pushed against a surface they spread out and grip. But if the setae are turned around, because of the curvature, none of the spatulae make contact with the surface and the hair just slides. This directional adhesion means that the toes grips tightly when loaded, but as it runs, a gecko can easily take the weight off a foot and slide the toes forwards.
One-way friction
Inspired by this work, Stanford’s Arul Suresh and colleagues have created an adhesive with similar one-way friction by varying its surface microstructure so that its shape changes when pulled in different directions.
Using a silicone elastomer, they sculpted a material that consists of a series of microscale wedges. When pulled along a surface in one direction, the wedges are drawn towards the surface, creating close contact and friction. But, a few of the wedges are larger and longer than the others. When the adhesive is pulled in the opposite direction these features curl over the other wedges and push them away from the surface, preventing close contact and drastically reducing friction.
Tests showed that the material has a 100:1 friction ratio: a 24 x 25 mm patch was able to hold a 2.3 kg weight in one direction, but only 22 g in the reverse direction.
Shuffling robotic inchworm
To demonstrate the practical use of the material, Suresh told Physics World that the team built a robot that moves like an inchworm – a caterpillar that moves forward by arching and straightening its body. “Normally, for a robot like this to work, it needs to be complicated enough to pick up each foot and move it forward, or it will waste a lot of energy by sliding each foot forward against friction,” he explains. “By placing a material with one-way friction on the feet, a robot like this can still push with large forces but can easily slide the feet forward when repositioning using a simple linkage. This allows a robot to “shuffle” while still pulling loads, instead of needing to pick up the feet and take steps.”
Suresh says that a one-way friction material could also be used to turn any surface into a ratchet. “This would allow robots, or other devices, to move easily in the low-friction direction, but also resist strong forces pushing them back,” he explains.
Looking at nearly any natural system, what’s immediately striking is how complicated everything is – at least, compared to the products we typically use every day
Arul Suresh
Natural materials are often very complex, with surface microstructures that show a lot of spatial variation. Iridescence, hydrophobicity and anti-drag properties, for example, all occur in biological structures through microscopic surface variations. In artificial systems, however, surface microstructures tend to be uniform – in part because manufacturing processes favour simplicity.
According to the team, their work shows how spatially variation can provide artificial microstructures with advanced properties. They add that researchers should look to biological systems to inspire them to create the next generation of microstructures.
“Looking at nearly any natural system, what’s immediately striking is how complicated everything is – at least, compared to the products we typically use every day,” says Suresh. “Nature has the ability to tailor solutions cell-by-cell to meet particular challenges. Research in other biological systems has shown that the small variations do affect the capabilities of those systems.”
Focused ultrasound treatments use multiple ultrasound beams focused deep within the body to provide non-invasive, targeted therapy for a wide range of clinical applications. Now, researchers at The Ohio State University College of Medicine have begun a clinical trial investigating the use of transcranial focused ultrasound to control a specific type of epilepsy in which seizures are not controlled by medication.
The study will enrol up to 10 patients with medication-refractory lobe focal onset epilepsy. Patients will receive MR-guided focused ultrasound through an intact skull to ablate tissue deep in the brain. The treatment works by passing 1024 ultrasound beams through the scalp, skull and brain tissue (without causing any harm) until they converge at a focal point to ablate a specific part of the brain involved in epilepsy.
“We’re pursuing this clinical trial because we know there’s a large unmet clinical need. More than 20 million people worldwide live with uncontrollable seizures because no available treatment works for them,” explains neurosurgeon Vibhor Krishna, who is leading the study. “Our goals are to test the safety of this procedure and study changes in seizure frequency in these patients.”
Earlier this month, a 58-year-old man became the first patient to be treated with focused ultrasound for epilepsy at Ohio State. During the three-hour surgery in an intraoperative MRI-surgical suite, he remained awake and alert, providing real-time feedback to the treatment team. His feedback helped the team safely ablate the brain region involved in spread of his epilepsy without causing undesirable side effects.
After treatment, the research team plan to monitor all the patients closely for one year. They will use neurological exams and neuro-psychological exams to assess language, memory and executive functioning.
“This is an important step in the evolution of focused ultrasound as a mainstream therapy for disorders affecting the brain,” said Neal Kassell, founder and chairman of the Focused Ultrasound Foundation, which is funding the clinical trial. “Ultimately, the results of this study could lead to new, more effective therapies for certain patients with epilepsy.”
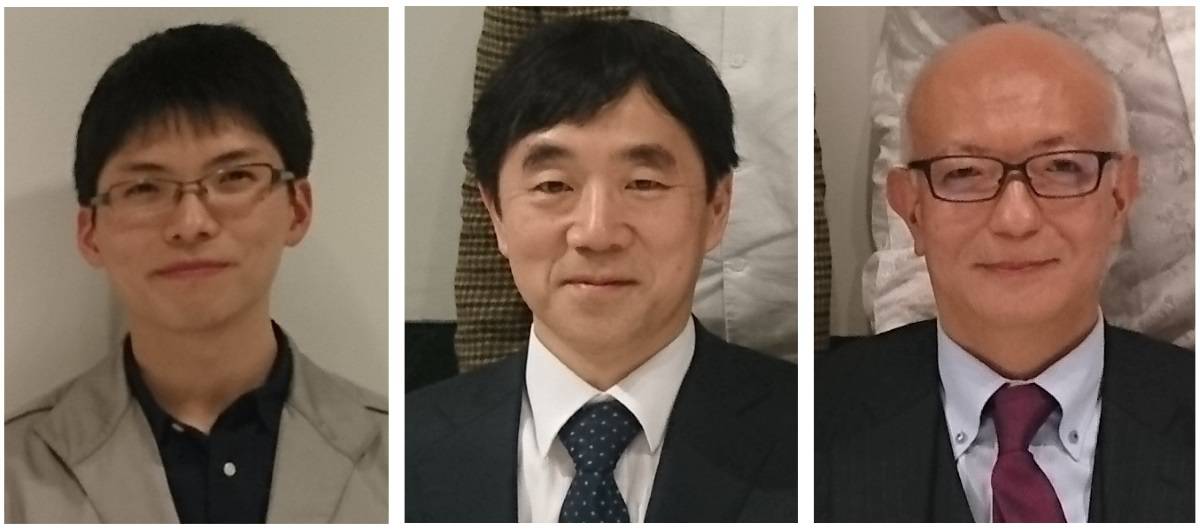
First author Masayasu Toratani (left), with senior authors Kazuhiko Ogawa (centre) and Hideshi Ishii (right).
By applying deep-learning techniques to a set of phase-contrast microscopy images, Japanese researchers have been able to identify the nature and origin of different cancer cells with 96% accuracy. This approach could lead to better cancer treatments (Cancer Res. 10.1158/0008-5472.CAN-18-0653).
The researchers, from Osaka University, used a convolutional neural network (CNN), a common scheme used in deep learning, to analyse the images. CNNs work by applying to the input image a set of connected filters and mathematical functions that, similarly to neurons, can be trained to extract specific features. In medical imaging, CNNs are modelled on the human visual system, with low layers that capture fine details such as edges, and higher levels that capture complex features reflecting the whole image.
Training AI to spot tumours
The idea of applying artificial intelligence (AI) to medical images for clinical purposes is not new. But many have questioned the ability of AI to distinguish the fine details that differentiate tumours that have developed resistance to common therapies.
Identifying the type of tumour and its origin is indeed a key step towards personalizing treatment for a specific patient. There is, for example, no need to expose a patient to radiotherapy if their tumours are radioresistant — as this could be both detrimental to them and a waste of time. Until now, however, tumour classification was mainly performed by visual inspection, which made the process time-consuming and prone to human-error.
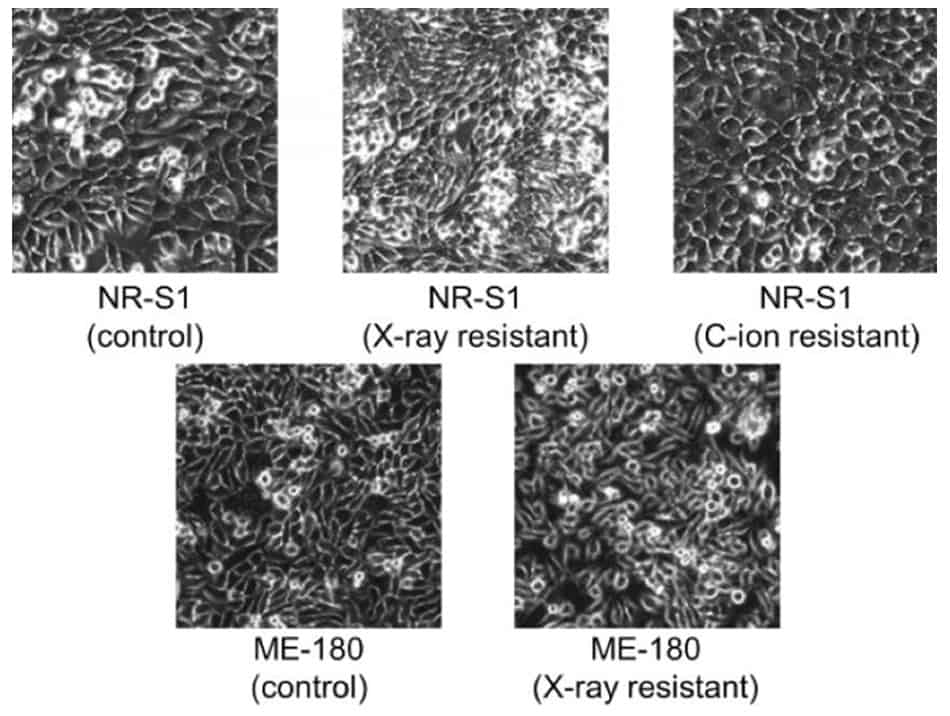
In this study, the researchers designed the CNN to classify cells into five categories: untreated (control); X-ray-resistant or carbon-ion beam-resistant mouse tumours (NR-S1 type); untreated and X-ray-resistant human cervical tumours (ME-180 type). They subsequently trained the CNN with a database of 8000 phase-contrast microscopic images containing these types of cells and validated it using an additional 2000 images.
The algorithm can recognize mouse tumours (NR-S1) and determine whether they had developed resistances against commonly treatment therapies such as X-ray or carbon-ion beams. The same could be done with human cervical tumours (ME-180). (Courtesy: Osaka University)
In need of a comprehensive database
The network was able to correctly identify 96% of the cells in the validation dataset, although it had more difficulty recognizing the human cell lines. This was especially the case for X-ray resistant cells, which had only a 91% rate of success, compared with 99% for the other types of tumour tested. This pattern was confirmed when all the 4096 features extracted by the CNN for each image of the two datasets were collated to form a 2D map: while the three clusters of cells originating from mice were distinct from each other, the two clusters of human cells were relatively close to each other.
These results are a stepping stone towards a more ambitious design. In the future, the team hopes to train the system on more cancer cell types, with the eventual objective of establishing a universal system that can automatically identify and distinguish such cells.
Twisted bilayer graphene can be made into a superconductor by simply squeezing the two layers closer together – according to an international team of physicists. Observation of the effect confirms a key prediction about the causes of correlated electron phenomena in bilayer graphene and could potentially help to unravel the puzzle of unconventional superconductivity.
Graphene is a sheet of carbon just one atom thick and its remarkable electronic properties have captivated physicists since the free-standing material was first isolated in 2004. While much work has been done on the properties of electrons within graphene sheets, researchers have also become interested in the weak coupling that occurs between electrons in bilayers of graphene. Indeed, the Physics World 2018 Breakthrough of the Year went to Pablo Jarillo-Herrero of the Massachusetts Institute of Technology and colleagues who showed that the electronic properties of a bilayer are strongly influenced by the relative orientation of its two graphene sheets.
This effect was predicted several years ago by independent teams in Chile and the US, who calculated that when two layers are twisted by a “magic angle” of about 1.1° relative to each other, “flat bands” occur, in which the kinetic energy of the electrons is almost independent of their momentum.
“Exotic things”
This can have some strange effects, explains condensed-matter physicist Cory Dean of Columbia University. “In normal materials, the behaviour of the most energetic electrons is typically determined by the kinetic energy term, and they don’t care about the other electrons,” he explains. “But if the band is very flat, even the most energetic electrons have very low kinetic energy. In that case, the system becomes more dominated by the electron-electron interaction energy. Systems can often do exotic things to minimize that interaction energy.”
Graphene is usually an extremely good electrical conductor, but in 2018, Jarillo-Herrero’s group showed that when the flat bands were exactly half filled with electrons, the bilayer behaves like an insulator. The researchers attributed this to the localization of electrons by electron-electron interactions between the graphene layers. Furthermore, by injecting or withdrawing electrons from this correlated insulator, they could produce electron-doped or hole-doped superconductors respectively.
Many features of this superconductivity – such as its proximity to an insulating state – bear striking similarities to that of type-II superconductors such as cuprates and pnictides. Discovered in 1986, these materials are of significant technological interest because they remain superconductors at relatively high temperatures and magnetic field strengths
Systematic change
The mechanism for type-II superconductivity has remained elusive, in part because the materials are difficult to study in a systematic way. “If you want to change anything in the system, such as doping or lattice constant, then you have to make a completely new material,” explains Dean. “Then you get caught up in arguments about what else has changed.” This has complicated efforts to optimize type-II materials and perhaps produce room-temperature superconductors.
Now, Dean and colleagues in the US and Japan have produced multiple samples of bilayer graphene – some with twist angle 1.1°; some with greater twist angles. As expected, samples with twist angle 1.1° showed superconductivity before being compressed whereas those with greater twist angles did not. However, when pressure was applied to samples with twist angles greater than 1.1°, the bilayers became superconductors.
Dean explains that value of the magic angle is related to the nature of the interlayer coupling, which is changed by compressing the bilayer at pressures greater than 10,000 atm. Tantalizingly, the critical temperature of the superconductor also increased slightly from 1 K to 3 K. This is in line with a theoretical prediction that the critical temperature of the superconductor increases systematically with magic angle and pressure – but Dean says this “needs to be properly tested”.
Indeed, Dean says that compressed bilayers are a useful potential platform for investigating type-II superconductors: “[We have] demonstrated how incredibly tunable these systems are. We can go from superconducting to metal to insulating states over large ranges of temperature, pressure and magnetic field without changing the composition. That could make this type of superconductivity a much more tractable problem.”
“I think it’s a very significant result,” says Jarillo-Herrero. “First of all, by being the first [experiment] that confirms our results, it gives credibility to the whole field. Second, though the tuning by pressure is difficult to apply, and I’m not sure how many other groups will follow it up, it gives many opportunities to think of complementary experiments and apply them to other 2D systems.”
Exams that US students need to take before being allowed into graduate school are not a reliable way of assessing whether those candidates will successfully complete a PhD. That is the claim of new research, which shows that the over-reliance on the Graduate Record Examination (GRE) in PhD admissions also discriminates against under-represented groups. The study has been carried out by a team led by Casey Miller — a physicist from the Rochester Institute of Technology — who analysed data for almost 4000 students who entered physics PhD programmes between 2000 and 2010, representing around 13% of doctoral enrolments during that period.
The system needs fixing to reach an acceptable level of equity
Casey Miller
In addition to looking at a student’s average grade earned during a degree – known as the undergraduate grade point average (GPA) – many physics doctoral programmes in the US also require applicants to submit GRE scores for a general exam and subject specific tests. However, Miller and colleagues found that undergraduate GPA and the ranking of the graduate programme were the only factors that indicated whether a student would successfully complete a PhD. GRE physics scores, gender and citizenship all had no significant effect on PhD completion. In addition to being poor predictors of PhD success, the researchers say that GRE scores also have large performance gaps based on race, gender and citizenship. This, they claim, is driven by factors like test anxiety and unequal access to expensive coaching or resources.
Assessing competencies
Around a quarter of US physics PhD programmes require a minimum GRE physics score of around 700, which places applicants in the 55th percentile, according to the researchers. They say, however, that the proportion of people that reach this level is not representative of those that take the test. For example, Hispanics account for 6.2% of test takers, but only represent 4.1% of those with scores above 700, while Asians make up 7.8% of test takers and 11.4% of scores of at least 700. Whites account for 78% of both test takers and scores above 700.
“The system needs fixing to reach an acceptable level of equity,” Miller told Physics World. “Programmes need to reflect on what they want to be and what student attributes can help them in that regard, then tie their admissions requirements to those goals.” Miller adds that graduate schools need to start assessing the “emotional-social – or non-cognitive – competencies” that faculty say make for great researchers such as perseverance, adaptability and accurate self-assessment.
GRE scores also act as a mirror that reflects societal disparities
David Payne
Previous studies indicate that around 40% of physics graduate schools require a minimum GRE score for admissions, even though it is recommended against by ETS – the non-profit organization that administers the tests. David Payne, vice president of global education at ETS, admits that an over-reliance on GRE scores – or any single measure – can have negative consequences especially for women and minorities. “It is for exactly this reason that ETS’s communications have, for some decades now, warned against the use of strict cut scores.”
Bringing value
Some US doctoral programmes are moving away from GREs. In 2016 the American Astronomical Society adopted a resolution recommending that graduate schools in astronomy eliminate GRE scores from applications, or make them optional. This was due to previous research indicating that they are poor predictors of success and have a negative impact on under-represented groups.
The physics department at the University of California, Irvine, has recently voted to completely exclude the physics GRE from its admissions process. James Bullock, head of physics, told Physics World that the department had seen “no correlation between physics GRE score and success, as measured by several different measures”, such as securing post-doctoral positions after graduation. Bullock says that he understands from colleagues that physics departments at other universities have also been discussing whether to drop the GRE from their admissions criteria.
Payne told Physics World that rather than throwing away GRE scores and the “unique value they bring”, schools should take various factors into account. “Students from higher socioeconomic status families are more likely to attend prestigious private undergraduate institutions, have access to prestigious and eloquent letter writers, and have multiple mentors to look over their personal statements,” he adds. “Like these submitted materials, GRE scores also act as a mirror that reflects societal disparities. However, unlike other measures, the GRE tests are designed and reviewed to make the test as unbiased as possible.”
Necessity, the saying goes, is the mother of invention. In the case of Liquid Instruments, a start-up venture with its origins in big astronomy and space-science projects at the Australian National University (ANU) in Canberra and NASA’s Jet Propulsion Laboratory (JPL) in California, it seems necessity is also the mother of innovation, entrepreneurship and a singular vision to rewrite the rules of the scientific test and measurement market.
Daniel Shaddock, CEO of Liquid Instruments and a part-time physics professor at ANU, spent the first 18 years of his research career (he’s still only 43), working on big-science collaborations such as the LIGO gravitational-wave experiment, GRACE Follow-On – a satellite mission to track changes in the Earth’s water systems – and a planned space-based gravitational-wave observatory called LISA.
Daniel Shaddock
Shaddock and colleagues were driven by a core philosophy to simplify the complex – specifically with regard to the hardware and advanced instrumentation that underpin these multicentre and multidisciplinary science and engineering collaborations. Or as he puts it: “What if we try to reduce how much hardware we have? What if we try to reduce the requirements of that hardware and the complexity of that hardware? And what if we push all of that complexity into the digital-signal-processing domain?”
In 2014, however, that focus on frontier scientific endeavour unexpectedly hit a wall, when funding cuts to Australian space science left Shaddock faced with the break-up of his international team of PhD students and postdoctoral researchers.
The team, however, was not for breaking up, and instead posed the collective question: what if we start a company and give it a go? The answer to that question is Liquid Instruments and a flagship product offering called Moku:Lab, a software-configurable hardware platform for precision test and measurement and advanced digital signal processing.
“The company sort of began out of necessity and had 12 founders – basically all of the students and postdocs that I needed to build the Moku:Lab product,” Shaddock explains. “A lot of our advantage stemmed from the great support we got from ANU. We didn’t have money to run full-time, so we put the team on half-time research appointments.”
That turned out to be a win-win: scientists who didn’t go into physics to become entrepreneurs got to do their big-science experiments half of the time, while the rest of their time was spent on the faster-paced commercialization work. “That was a lovely balance – and a fun time as well as a scary time,” Shaddock adds.
Thinking big
Fast forward to 2019, and earlier this month Liquid Instruments took a significant step in its ongoing evolution after closing an $8.16 million Series A funding round led by US-based Anzu Partners and follow-on investor ANU Connect Ventures in Australia. That backing builds on an impressive 2018, when Liquid Instruments clocked more than $1 million in Moku:Lab sales to 22 countries.
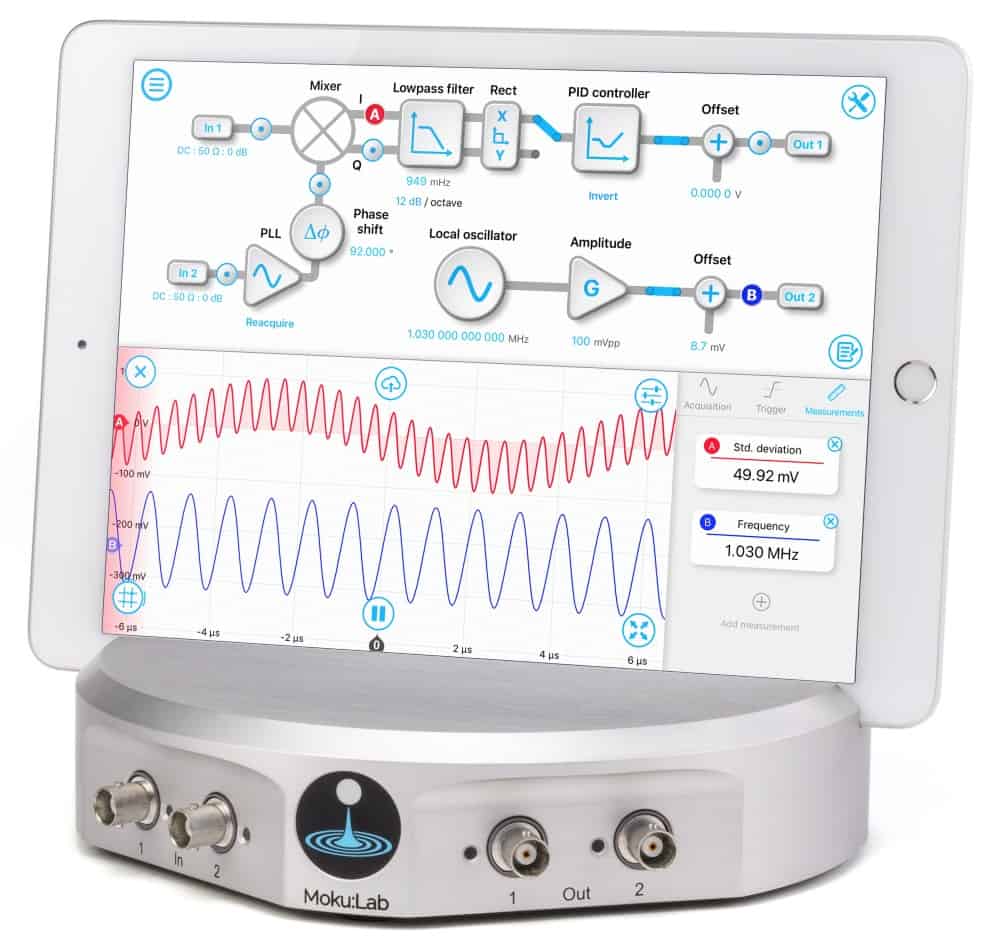
The latest investment will in turn help to accelerate development of Moku:Lab, which currently integrates 12 precision test and measurement instruments – including an oscilloscope, lock-in amplifier and phase meter, among others – into a single, compact hardware device using a field-programmable gate array (FPGA)-based software-reconfigurable platform. (An FPGA is a special type of semiconductor chip that can quickly be reconfigured for different purposes using software.)
To replicate all that Moku:Lab can deliver would require tens of thousands of dollars in separate equipment purchases and significantly more lab space to house it all
Daniel Shaddock, Liquid Instruments
Core technology aside, the unique selling point of Moku:Lab is workflow convergence. In other words, the opportunity for scientists and engineers – whether in a research, corporate R&D or undergraduate education setting – to simplify and declutter versus the conventional approach to test and measurement with its many separate (and costly) pieces of specialist kit and the sprawling laboratory real-estate needed to house it all.
“Moku:Lab represents a fundamental transition in the test and measurement equipment market,” claims Shaddock. “Instead of buying an oscilloscope to measure signals in the time domain, a spectrum analyser to measure them in the frequency domain, and a waveform generator to output signals, we’ve put all that functionality and more into very-high-speed digital signal processing. We have replaced multiple instruments with a single high-precision device.”
What’s more, by pushing complexity and functionality out of the hardware and into the FPGA/digital-signal-processing space, Moku:Lab comes with built-in scalability and a neat upgrade model that allows users to build an enhanced and growing menu of test capabilities over time.
Workflow focus: Moku:Lab exploits an intuitive user-interface
“When we first launched Moku:Lab a couple of years ago, there were three instruments in it – an oscilloscope, spectrum analyser and waveform generator,” says Shaddock. “Since then, every few months when the team in the lab have finished a new instrument – for example, the Bode analyser or digital filter box – we have been able to push that functionality out to customers as a software update. That’s a far more flexible way of doing things when compared to conventional, analogue instruments.”
Another big driver for Shaddock and his team is to take best practice from modern user-interface design and apply it to the test and measurement industry. Moku:Lab is controlled through Liquid Instruments’ iPad app or via custom LabVIEW, Python and MATLAB application programming interfaces, with a Windows version in the works.
“We are focused on improving user workflow,” says Shaddock. “With Moku:Lab, users can save data to the cloud, analyse results right from the device, and use the intuitive user-interface to help them complete tasks much faster than with legacy instruments.”
The view from the lab
Research customers, for their part, seem convinced about the Moku:Lab model and its potential to reset their workflows – and outcomes – for the better.
Bruce Marsh, an applied physicist in the engineering department at the CERN/ISOLDE Radioactive Ion Beam facility in Geneva, is a case in point. Marsh and his colleagues have had a Moku:Lab in their lab for over a year and mainly use it for monitoring and optimizing laser-pulse timing.
“Our lab has many nanosecond pulsed lasers that all need to be temporally overlapped,” he explains. “It’s great to be able to just walk around the lab with the iPad and optimize parameters instead of our previous approach of shouting instructions across the room at each other.”
He’s also motivated by the built-in scalability of the Moku:Lab platform – and in his specific case the recent addition of a laser lock-box instrument. “This is something that we requested when we first bought the Moku:Lab,” says Marsh. “The intuitive interface to configure the lock-in amplifier settings and the built-in oscilloscope preview make it so much more user-friendly than traditional laboratory devices. This means that you can concentrate on getting the optimal settings, rather than trying to figure out how to navigate the menu of the device.”
Liquid Instruments will be exhibiting at SPIE BIOS 2019 (booth #8259) and SPIE Photonics West 2019 (booth #5664) from 2-7 February at the Moscone Center in San Francisco. See below for a video demo from the show.
Building Moku:Lab momentum in the US
Danielle Wuchenich
Danielle Wuchenich, co-founder and chief strategy officer at Liquid Instruments, is faced with a challenge that will sound all-too-familiar to many technology start-ups: laying the tracks while the train is running.
More often than not, this sees Wuchenich juggling day-to-day operational priorities – sales development, staff recruitment and existing customer relationships – while building a longer-term view of the market opportunity for Moku:Lab in the US.
“Many of our existing customers are here in the US – professional scientists and engineers working in university research, national labs and corporate R&D,” says Wuchenich, who heads up the firm’s US strategy, operations and partnerships from a base in Palo Alto, California.
While her near-term focus is hiring and staffing a local sales and support team to grow visibility and market penetration for Moku:Lab in the US, Wuchenich is also sizing up what could turn out to be a significant growth market through 2020/21 – and not just in the US. “We want to diversify and customize Moku:Lab to deliver a product line targeted specifically for physics and engineering undergraduate teaching labs,” she explains.
For now, though, there’s the upcoming Photonics West/BIOS 2019 event, the annual international gathering of optical scientists, engineers and technology vendors in San Francisco. “Since we started Liquid Instruments, Photonics West has been our big show – this is our fourth time as an exhibitor,” says Wuchenich. “It’s a combination of customer acquisition, catching up with existing customers, as well as looking for proactive distribution partners who can help us reach new markets and territories.”
Photonics West also sees the official launch of the laser lock-box, the latest instrument addition to the Moku:Lab platform (see main article). “This is the first instrument that we’ve developed specifically for the optics and photonics community,” Wuchenich adds, “so we’re very interested to see what the response will be on the exhibition booth.”
Scientists in the US have used a novel photonic microscope to make the first real-time observations of thermal vibrations in carbon nanotubes (CNTs). Their results reveal a rich dynamical regime that has not yet been explored in these miniature resonators, including weakly chaotic behaviour and quasi-periodic modulations that yield a long-range coherence about three orders of magnitude higher than previously reported.
Scientists have long been interested in the mechanical vibrations of CNTs for use in applications such as nanoscale biosensors, but probing these dynamics has proved challenging. Standard electrical techniques tend to produce noise, while electron microscopes can cause unwanted material deposition on CNTs at room temperature. Even optical detection presents a problem as the tiny optical cross-section of CNTs causes most light to pass straight through them without any significant interaction.
The research team, led by Paul McEuen at Cornell University in the US, found a way around the limitations of optical detection by fabricating an optical resonator from a silicon nitride micro-disk. Coupling the nanotube to such an optical cavity boosts the effective cross-section of the nanotube to allow its mechanical motion to be detected in real time.
In the experiment, a nanotube was suspended next to the optical cavity using electrically-connected gold microtweezers. This strengthens the light–CNT interaction by orders of magnitude, allowing the nanotube to absorb as much as 50% of light from the cavity. As the nanotube vibrates in the evanescent field from the optical cavity, its movements can be measured by a fast photodiode that monitors the light transmitted through the cavity. Since the CNT was much longer than the size optical mode, the scientists could be sure that the tweezers would not affect the measurement.
The researchers found that the CNT oscillates with a period of 1.5 µs. However, they also observed that the frequency and amplitude show pseudo-periodic behaviour over much longer timescales, typically 10 ms. This shows that the nanotube vibrations exhibit nonlinear behaviour that is driven only by weak thermal fluctuations
McEuen and colleagues believe that the CNT oscillator behaves in a similar way to the dynamics that is described by the so-called Fermi-Pasta-Ulam-Tsingou (FPUT) problem. The FPUT observation shows how introducing nonlinearity to an oscillator causes recurrences over long time periods, rather than rapidly dissipating mechanical energy to reach equilibrium.
Their analysis reveals that some of the energy in this system dissipates rapidly, over millisecond timescales, but then quasi-periodic modulations decay over a much longer time period. As a result, the quality-factor for the nanotube oscillator is calculated to be 4000 for the initial decay, rising to 20,000 when computed over the full decay time. This overall system value is between two and three orders of magnitude larger than the known quality-factor of CNTs, which was previously estimated with time-averaging methods.
According to the researchers, the pseudo-periodicity they observe bears the hallmarks of a weakly chaotic mechanical “breather” – in which energy concentrates in low-frequency modes, disperses into higher-frequency modes, and then returns.
This long-period energy dissipation is reminiscent of macroscopic mechanical systems, while the strong thermal coupling observed in CNT dynamics is also similar to the behaviour of semi-flexible polymers. This new insight into the dynamics of nanomechanical systems could, the researchers hope, lead to a better understanding of the mechanisms that govern fast molecular processes.
Manganese is an essential element in the body at trace levels and is a cofactor in many enzymes and proteins but it is neurotoxic in high amounts, causing symptoms similar to Parkinson’s disease. A team of researchers in Bordeaux in France has now used organelle fluorescence microscopy combined with synchrotron X-ray fluorescence (SXRF) imaging to show that manganese accumulates in the Golgi apparatus of human cells that are transfected with a mutant protein that causes toxic build-up of manganese in cells. The single-cell imaging technique could help us better understand the mechanisms behind neurotoxicity in Parkinsonian syndrome and other neurological diseases.
Researchers recently discovered that a mutation on the Slc30a10 gene can lead to a hereditary form of Parkinsonism. Slc30a10 is a cell surface protein that controls manganese (Mn) efflux and prevents too much Mn from entering cells. The disease-causing mutation blocks this activity.
Challenging to image
Little is known about how Mn distributes in human cells because this element is present in concentrations as low as the μg/g range. This means that it is challenging to image it. Very high spatial resolution and highly sensitive techniques to directly detect such low amounts of Mn in intracellular organelles of the cell, which are 1μm3 or less in size, are thus needed.
This is now possible thanks to synchrotron radiation hard X-ray nanoprobes at facilities such as the Deutsches Elektronen-Synchrotron (DESY) in Hamburg, Germany, or the European Synchrotron Radiation Facility (ESRF) in Grenoble, France. In the nano-imaging beamline at ESRF, for example, an X-ray beam of 17 keV in energy can be focused down to just 50 nm in size.
Richard Ortega
“Amazing though the spatial resolution and detection sensitivity of these probes is, it is still not high enough to identify the organelles in which Mn accumulates, however,” explains Richard Ortega of CENBG at the University of Bordeaux, who led this research effort. “This is why we developed a correlative microscopy approach combining optical fluorescence microscopy and synchrotron radiation X-ray microscopy.”
Mn distribution maps at the subcellular level
The researchers began by labelling the cellular organelles in samples of individual HeLa cells (a widely used model in cell biology) using organelle specific dyes. They then labelled the cell nucleus and the cell’s Golgi apparatus (which is a sort of “dispatcher” centre for proteins) using the same dyes. “We then performed optical fluorescence microscopy on the samples before taking them to the synchrotron facilities,” says Ortega. “By comparing the images of organelle localization and of Mn distribution in the same cells, we produced Mn distribution maps at the subcellular level in which we were able to clearly identify the Golgi apparatus as the main site in which Mn builds up in cells expressing the disease-causing Slc30a10 mutation.”
And that was not all: Ortega and colleagues say that their single-cell mapping technique is able to go even further and identify suborganelle Golgi nanovesicles less than 100 nm in size as the compartments in which Mn accumulates. The researchers believe that this Mn increase perturbs protein transport out of cells and alters nerve cell function, which is what causes Parkinsonian symptoms. They do admit, however, that more work is needed to confirm this hypothesis.
“Together with our colleagues in Somshuvra Mukhopadhyay’s group at the University of Texas at Austin in the US, we are developing new animal models of the disease to do just this,” Ortega tells Physics World. “These models will allow us to study Mn homeostasis in neurons but also in cells coming from other organs in which Mn imbalance could lead to altered metabolic function.”
Swiss researchers have shown that machine-learning algorithms can assist fully automated FDG-PET lung cancer detection — even at simulated very low effective radiation doses of 0.11 mSv — and can do so at little cost to sensitivity and specificity.
Lung cancer is one of the most frequent forms of cancer and the most common cause of cancer-related death worldwide. Therefore, techniques combined with artificial intelligence (AI) that can catch pulmonary lesions early while they are still curable will have a huge and widespread impact on patient outcomes and healthcare costs, according to the group. Further development of low-dose FDG-PET might improve the specificity of lung cancer screening and also open doors to other applications.
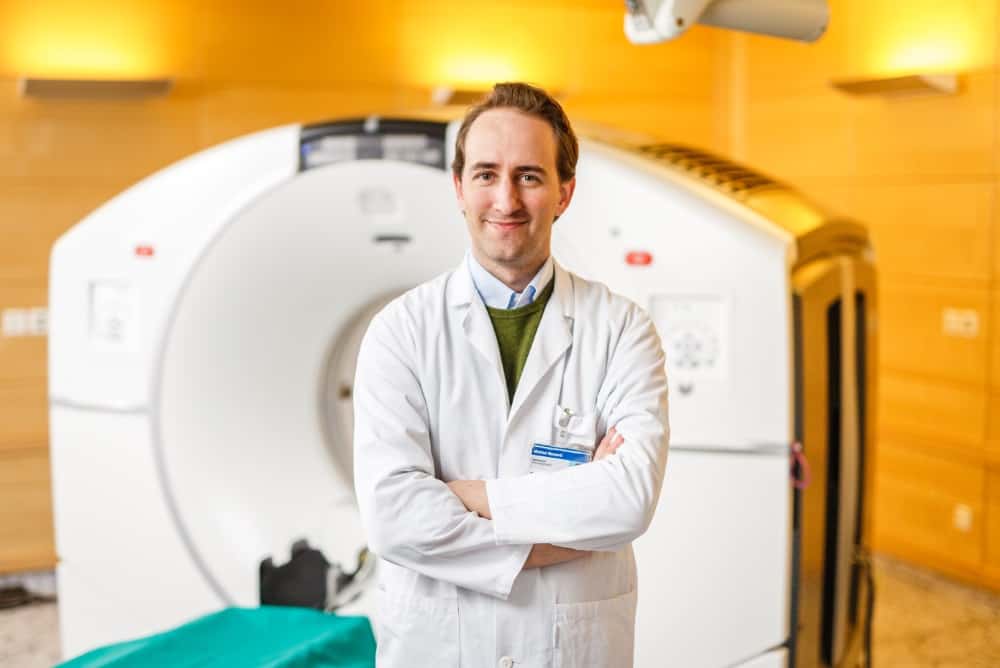
Michael Messerli from the University Hospital of Zurich. (Courtesy: USZ Foundation, Zurich)
“We observed that with simulated 30-fold dose reduction in FDG dose, we had only a marginal loss in sensitivity and specificity using the AI algorithm,” says supervising investigator Michael Messerli, a resident in the department of nuclear medicine at the University Hospital of Zurich. “The potential benefit of lung cancer screening is huge. These small T1 lesions of 0 cm to 3 cm in size can be treated and cured, unlike the 70% to 80% of cases presenting in departments with late-stage incurable lung cancer. The long-term hope we have is that specificity of lung cancer screening can be improved by using the information from PET/CT in combination with AI. This might save costs and would have the potential to reduce follow-up appointments.”
Hybrid PET/CT using F-18 FDG as a radiotracer is an established imaging method for staging of lung cancer, and now it has a role for screening, according to Messerli. In the first part of their retrospective study, the researchers assessed the accuracy of a deep-learning algorithm for automated detection of lung cancer using FDG-PET scans; in the second part of the study, they simulated a reduced FDG dose injection and evaluated its effect on the performance of the deep-learning algorithm for discriminating lung cancer (Lung Cancer 10.1016/j.lungcan.2018.11.001).
The group assessed the FDG-PET data acquired from the PET/CT scans of 100 patients scanned for lung cancer and other malignancies during May 2017 and January 2018. Of these, 50 had histologically proven lung cancer, and 50 were clear of lung cancer or any other pulmonary lesions. The researchers studied the performance of an artificial neural network for discriminating lung cancer on a total of 3936 PET slices that included images in which the lung tumour is visually present and image slices of patients with no lung cancer, and they performed low-dose simulation in July 2018.
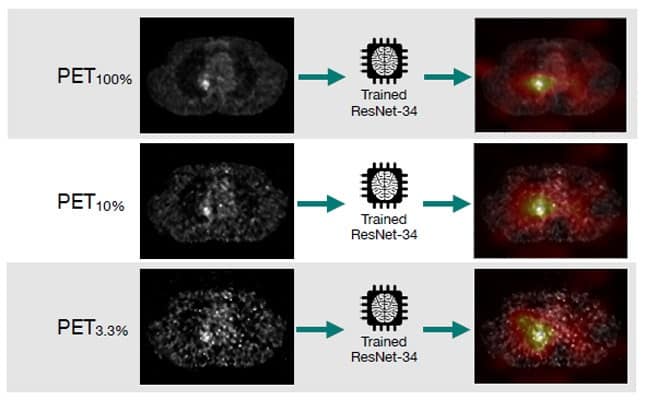
The algorithm used for AI-detection was a pretrained Res-Net 34 deep neural network. The group trained it on PET data for binary classification of lung cancer/no lung cancer in July and August 2018.
Results
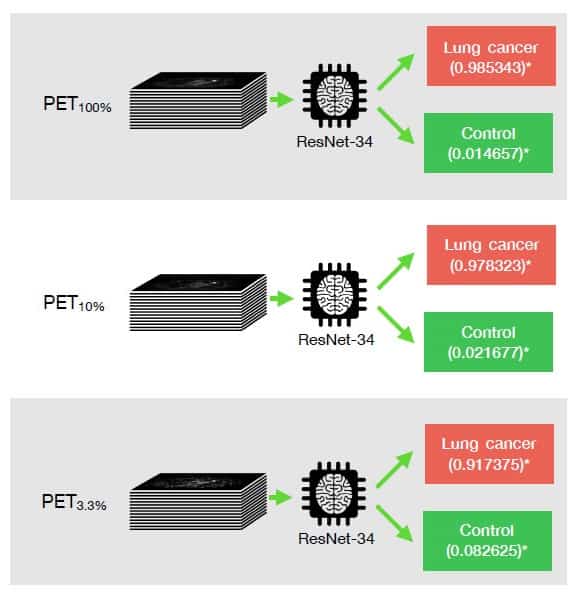
The group assessed the diagnostic performance of the artificial neural network based on clinical standard dose PET images (PET100%) and with a tenfold (PET10%) and 30-fold (PET3.3%) reduced radiation dose (approximately 0.11 mSv). The deep-learning network produced probabilities between lung cancer being present (1) and not present (0). The researchers plotted those probabilities on a receiver operating characteristics (ROC) curve and calculated the area under the curve (AUC). They found that the AUC of the deep-learning algorithm for lung cancer detection was 0.989 for standard dose images (PET100%), 0.983 for reduced dose PET10%, and 0.970 for PET3.3% reconstruction.
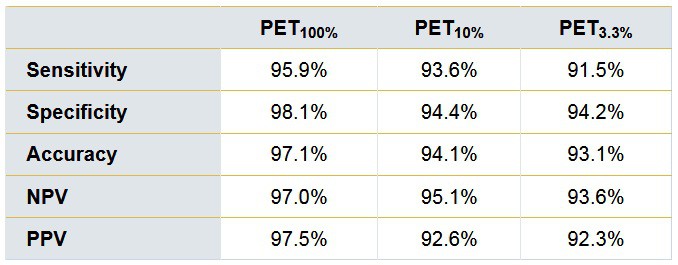
The key findings are presented in the table below:
Diagnostic performance at each Youden index for standard dose and reduced PET simulated doses. NPV = negative predictive value; PPV = positive predictive value. Data presented as n (%). Histological findings used as reference. (Courtesy: Michael Messerli)
The artificial neural network respectively achieved sensitivities of 95.9% and 91.5% and specificities of 98.1% and 94.2% at standard dose and ultralow-dose PET3.3%.
Speaking to AuntMinnieEurope.com, Messerli describes how recent promising results from the NELSON trial mean that lung cancer screening may soon be considered as a serious proposition by many European states. The department’s historical advantage of having the latest PET technology combined with the department’s acquisition in 2017 of the first-ever digital PET detector, with its greater sensitivity to positron decay, contributed to the group’s heightened interest in the potential of low-dose FDG-PET for lung cancer screening.
“Because the amount of tracer is detected more sensitively with this latest generation of detector, we wondered if we could lower the dose,” he notes.
The researchers simulated dose reduction by unlisting the list-mode data. This enabled the group to reduce the time of PET acquisition from 150 seconds of acquired data (clinical standard) to 15 seconds (representing 10%) and then to 5 seconds (representing 3.3%) of equivalent dose-acquired data.
“In some simulated ultralow-dose images, we still could see lesions with the naked eye. However, we wanted to explore the possibility that an algorithm could learn to cope with noise better and better identify lesions,” Messerli points out. “We also wanted to check both positive and negative cases for sensitivity and specificity: whether or not PET/CT at ultralow dose with AI caught all the real lung cancers and also whether or not it mistook normal data for lung cancer.”
Step 1: Preprocessing. Low-dose PET reconstructions are generated by unlisting the list-mode data. (Courtesy: Michael Messerli et al)Step 2: Training and testing each dose set with a ResNet-34. *Examples of per-slice lung cancer probabilities between 0 and 1 for each dose reconstruction. (Courtesy: Michael Messerli et al)Step 3: Accuracy assessment. Analysing the trained ResNet-34 and creating class activation maps. (Courtesy: Michael Messerli et al)
Based on the significant findings of this study, the researchers are planning a prospective study in a patient group with early lung cancer (localized stage 1a) to assess whether when rescanned with an ultralow-dose protocol and AI, they can detect early-stage lung cancer. In this study, the team also hopes to compare AI reading with experienced and less experienced human readers to see how well the algorithm performs. This planned study is still pending feasibility assessment and ethical approval.
This next study, hopefully, will also include a much larger patient dataset, ideally in a multicentric setting. Via the Achilleon Registry platform, the team has launched a European multicentric data pooling system for lung cancer FDG-PET scans. So far, the numbers on how many sites or countries will be participating are not set, but the nodule registry is already established.
Using AI algorithms to increase specificity for evaluating very-low-dose FDG-PET images to spot small malignancies and other abnormalities could also be applied to other areas such as Alzheimer’s disease PET detection, notably for helping researchers determine the feasibility of a screening test to check if the brain is sick or healthy.
“We are really excited because the study shows one can use low-dose PET/CT to look at the FDG-PET data for other questions not just lung cancer. However, there is a lot of work to do before there is a clear clinical application,” Messerli says.
The result comes from an analysis of ground-based data, rather than exposure estimates from computer models.
“I would certainly classify [the result] as good news,” says Karl Seltzer of Duke University, US. “The estimated health burden is still high, but not as high.”
There is much evidence linking both short-term and long-term ozone exposure to health problems such as respiratory diseases.
In the past, however, it has proven difficult to assess the size of these health impacts. A shortage of ground-based ozone-monitoring stations has left researchers with little option but to estimate global exposure values from chemical transport models. When the outputs of such models were compared with the data that did exist, it became clear that the models tend to overestimate ozone exposure.
In recent years, more ground-based data have become available, particularly for countries such as China. These have opened up the possibility of a truly global health-impact analysis without resorting to modelled ozone. “More people are becoming aware of the importance in collecting such data,” says Seltzer.
Seltzer and colleagues collected hourly ozone data for 2015 from monitoring networks in the US, Europe and China, and translated them into values on a grid. For each of the grid squares, they then found values for population numbers and mortality rates. Using “exposure–response” relationships from epidemiological studies, the researchers estimated the premature mortalities attributable to long-term ozone exposure.
The resulting map showed that Europe had 32,000 such mortalities whilst the US had 34,000 and China had 200,000. The values were between about 20% and 60% lower than those generated by chemical transport models – in large part, the researchers say, because those models are biased towards greater ozone exposure.
“These results demonstrate how small biases in [the] modelled results of long-term ozone exposure can amplify estimated health impacts,” the team concludes.
Seltzer hopes that the study will create a clearer picture of regional health challenges for policy makers, so that they can make better-informed decisions about how to tackle global health.
That said, the picture is not yet complete. In a few places in the health-impact map, there still weren’t enough observations for Seltzer and colleagues to make long-term exposure estimates. As a result, Seltzer is trying to use machine-learning tools to fill in the gaps.