Scientists from China and the US have created a precise record of atmospheric radiocarbon for the last 54,000 years, from isotopes locked inside a pair of stalagmites. They say their study helps refine and calibrate the atmospheric radiocarbon record and provides insights into the causes of variations in atmospheric radiocarbon over time.
The radioactive carbon-14 isotope is absorbed from the atmosphere by living organisms and then starts to decay at a known rate once they die. Radiocarbon dating measures the residual levels of this isotope estimate the age of organic materials and it has transformed archaeology and climate science, and other research disciplines.
As levels of carbon-14 in the atmosphere fluctuate over time, to enable accurate dating the atmospheric carbon-14 record needs to be calibrated against a calendar time-scale. Tree rings provide some of the best information on historic radiocarbon levels, as trees take carbon dioxide directly from the atmospheric and turn it into cellulose with little delay. But the continuous record from tree rings only goes back around 14,000 years.
Dead carbon fraction
Beyond the 14,000 years, lake sediments, ice cores and other sources of organic material can be used. These do not always provide a direct record of atmospheric carbon levels, however, as the carbon-14 has often passed through other systems that add more carbon to the mix. The water that helps form a stalagmite, for example, will have passed through soil and rock – collecting additional carbon. This “dead carbon fraction” needs to be accounted for, which is easier the smaller and more consistent it is.
The pair of stalagmites used in the latest research are from the Hulu Cave in Jiangsu Province, Eastern China. Originally these stalagmites were collected to study historic Asian monsoon variability, Hai Cheng at Xi’an Jiaotong University in China, told Physics World.
“The Hulu Cave stalagmites are very special since their dead carbon fraction is low and stable” Cheng says. His colleague, Lawrence Edwards at the University of Minnesota, adds, “They include very little carbon derived from the limestone around the cave, most of the carbon came directly from the atmosphere.”
To date the carbon-14 in the stalagmites, the researchers compared it with adjacent levels of thorium-230, a radioactive isotope with a date record that goes back further than that for atmospheric radiocarbon. The team was able to align atmospheric carbon-14 levels with around 300 new dates, ranging from 54,000 to 18,000 years ago.
Magnetic field reversal
The results help explain historic variations in atmospheric radiocarbon and could add clarity to geological events such as the Laschamp geomagnetic excursion. This was a brief reversal of the Earth’s magnetic field around 43,000 years ago. According to the team, the carbon-14 data has similarities to the geomagnetic record and indicates an abrupt increase in radiocarbon around the Laschamp excursion. This, they say, suggest that changes in the Earth’s magnetic field could be responsible for much of the historic fluctuations in atmosphere radiocarbon.
“It also confirms, as had previously been surmised, that as the last ice age ended changes in the carbon cycle in the ocean, associated with climate change, caused changes in the radiocarbon levels,” says Edwards.
Timothy Jull, of the Department of Geosciences at the University of Arizona, says that the study helps refine the carbon-14 record and adds a lot of information about the Laschamp event by improving the record for that period. “That’s its main advantage to me, it adds clarity to what’s happening 35,000–45,000 years ago.” He cautions, however, that at other points there are large levels of uncertainty in the data.
According to Tom Higham, of the School of Archaeology at the University of Oxford, this work is an exciting and important contribution to radiocarbon data as it is “a very detailed and high coverage record”. He adds that it overlaps well with other records and is in “good agreement with tie points such as the Campanian Ignimbrite volcanic ash event”, indicating its accuracy.
“This new dataset will have significant implications for our ability to calibrate radiocarbon and get the right answers to some of the big questions prehistorians are grappling with,” Higham says. “When do different species of animal disappear over the last 50,000 years? When do Neanderthals go extinct and how? When did humans begin to make art? Many questions have chronology at their heart and his new curve helps us to get a better resolution on the answers.”
Ever wondered why your winter woollens can easily stretch over your head, but your jeans barely have any give? In the January issue of Physics World, Samuel Poincloux answers this question while exploring the mechanics of clothing. Poincloux, a researcher at Ecole Polytechnique Fédérale de Lausanne, explains the mechanical differences between knitted and woven fabrics. Read the full article, Knit and stretch.
Around half of newly diagnosed cancer cases would benefit from treatment with radiation therapy. And hadron therapy, which uses proton or ion beams to deliver precision tumour targeting with zero exit dose, could improve therapeutic outcomes in 15–20% of these cases. But the number of potential patients — some 1.5 million per year at present — far outweighs the capacity of currently installed hadron therapy systems, which treat some 20,000 patients per year.
So why not just build more hadron therapy facilities? One obstacle is the vast size, weight and cost of current instruments. To maximize conformal irradiation of the tumour target, treatments require beam delivery from different directions. And as it’s neither practical nor comfortable to move the patient any great amount, this necessitates the use of either multiple beam lines or, more commonly, a rotating gantry.
Such gantries are complex structures that represent a considerable fraction of an installation’s cost and size. And for carbon ion therapy, there are only two gantries in the world. The one at the Heidelberg Ion-Beam Therapy Center in Germany is 25 m long and weighs over 600 tonnes. The other, in Chiba, Japan, is a superconducting gantry that is smaller and weighs 250 tonnes, but comes with the added challenge of a rotating cryogenic system.
But what if a new type of gantry could be created, one that doesn’t need to rotate and is small enough to fit on one room? That’s the goal of CERN scientist and magnet expert Luca Bottura. Along with PhD student Enrico Felcini and colleagues at CERN and EPFL, Bottura is working to create a lightweight and compact superconducting gantry for hadron therapy — called GaToroid.
“Current hadron therapy gantries are massive because they use large and heavy magnets of relatively low field, and require a very robust structure to rotate them precisely,” explains Bottura, speaking at a recent CERN Knowledge Transfer seminar. One way to reduce the size is to use superconducting magnets to increase the bending field in large bore magnets, an approach that’s being studied by several research teams.
A more radical idea is to devise a magnetic configuration that does not need to rotate in order to bend the treatment beam onto the patient. This will reduce the stability requirements on the gantry, and hence lower its mass and footprint. Such a configuration can be achieved using a toroidal magnet, and this is the idea underlying GaToroid.
“A toroidal field has axial symmetry and has the property of bending particles from any angular direction towards its centre,” Bottura explains. “This is exploited in GaToroid to direct beams from different angles towards the patient, without the need to rotate the magnet.”
System designs
In the GaToroid gantry, the hadron beam from the accelerator first passes through a vector magnet, which acts as an X-Y kicker to direct the beam at an appropriate angle into the toroidal magnet. The magnet comprises a series of superconducting toroidal coils and the beam is directed into one of the inter-coil spaces. The coils are designed with a graded winding, which shapes the field profile to help control the beam path.
“We shaped the coils to have a very large ‘acceptance’. This means that beams of different energy are directed towards the same point by making use of a large field volume, without the need to change the magnetic field,” says Bottura. “And because the field lines close inside the torus, it does not need a heavy iron yoke, and the space for the patient, in the bore of the torus, is field-free.”
As the gantry does not physically move nor change its field, it only needs the kicker magnet to direct the beam, and the magnetic field configuration does the rest. This enables rapid changes in the delivery direction (which can take several seconds for a classical gantry), as the speed of beam delivery is only governed by the speed of the kicker magnet and the accelerator itself.
To investigate the design’s potential, the researchers simulated tracking of single particles of 70–250 MeV directed onto the patient by the graded coil toroidal magnet. They observed excellent acceptance and isocentric properties. Repeating the simulation for clouds of particles with slightly different beam parameters (initial position, direction and energy) showed well superimposed input and output beam clouds at 70, 150 and 250 MeV.
Beam painting can be achieved by using different kick angles at the vector magnet to rapidly change the beam path. (Courtesy: Enrico Felcini)
The team also demonstrated a proof-of-principle of beam painting using the GaToroid. They achieved this by using different kick angles at the vector magnet to rapidly change the beam path in the transverse (±50mm) and sagittal (±60mm) directions.
Proposed specifications
At the seminar, Bottura shared some potential design specifications for the GaToroid gantries. A proton gantry, for example, would include 16 coils with a peak field on the coil of 8 T and an operating current of 1800 A. This gantry has a radius of 1.5 m, a length of about 6 m and an estimated mass of 12 tonnes. A carbon ion GaToroid would also have 16 coils, with a peak field of 13.8 T and an operating current of 6 kA. This gantry would be larger, with a radius of 2.5 m, a length of about 10 m and an estimated mass of 50 tonnes.
“The idea is on the path of being demonstrated rather than proven, but if you compare the proton solution to other systems, the size and mass reduction is remarkable. For the carbon gantry, the comparison is more striking in terms of mass,” says Bottura. “GaToroid will be at least two times smaller and ten times lighter. I think it has big potential and we need to explore it.”
The team is now half way through the three-year project. Last year they started work on the basic GaToroid design, addressing issues such as magnet design and geometry, beam tracking and the ability to paint a target, and then tackled the mechanical design.
“We are still focusing on technical challenges — the choice of material, mechanics and fabrication, beam optics and beam dynamics, quenches and thermal engineering — but we also started to think about a staged prototyping plan, and integrating beam and dose monitoring instrumentation,” says Bottura. “This will require careful planning, and collaboration with other institutes and companies that are expert in specific areas.”
Ultimately, a compact non-rotating gantry could prove a game-changer for ion therapy — where the size and complexity of the few existing ion gantries restrict their use as turnkey commercial solutions for ion treatment centres.
Bottura thinks that GaToroid could also prove of interest for proton therapy: “Because fully-rotating proton gantries represent a large portion of the cost and footprint of multi-room proton centres, and also because the high speed at which the beam direction can be changed will open up interesting possibilities for treatment,” he tells Physics World.
“This idea has a touch of insanity, but if it works, it could be a quantum step towards compact gantries and ease widespread application of hadron therapy,” says Bottura.
Collaboration between geoscientists and communities to solve problems is increasingly a priority for scientific institutions and societies. That’s the view of Raj Pandya, who heads the American Geophysical Union’s (AGU) Thriving Earth Exchange (TEX).
TEX has grown from three projects to 90 in just three years, Pandya told science communicators at a workshop at AGU’s Fall Meeting in Washington, DC, in December. Scientists and community leaders in the US and around the world are increasingly interested in working together, he said.
TEX is “a wellspring of innovation” in resolving global issues at a local scale, according to Pandya, in such areas as flood prevention, pollution cleanup, and – especially –adaptation to climate change. It also affects the interface between science and society, “how we do science” across sectors, disciplines, and cultures. And it has the potential to overcome longstanding inequities, inviting people who’ve been ignored to help set a scientific agenda that addresses their priorities.
Carol Lue, head of CaribShare BioGas, a charity in Jamaica’s Montego Bay that seeks to mitigate the impact of tourism on the environment, described a TEX project that collects 70 bins of organic waste per day from eight hotels, cruise ships, and cattle and pig farms. CaribShare converts the waste, which would normally be sent to landfill, to fertilizer and biogas through a digester. It’s the only such project in the country.
“Climate change is a dire issue” for the Caribbean, Lue said, “because we are small island states.” She believes the charity’s model shows that “here is a way we can help; the waste can be used for good.”
TEX’s role, Lue said, was to recruit Wale Adewunmi, a soil scientist who volunteered his time and expertise in the environmental chemistry of soils and managing waste in soil. Adewunmi spent two weeks meeting with farmers and government officials, while verifying that the fertilizer CaribShare produced was beneficial to Jamaica’s soil.
Julie Vano, a hydrologist with the US National Center for Atmospheric Research, provided a scientist’s perspective. She described Science to Action, an organization of scientists and decision-makers that helps communities confront such challenges as natural hazards and extreme events.
Asked why she participates in the TEX-supported project, Vano said that by devoting resources to connect with communities, “as somebody who is relatively starting my career, in some ways I feel like I am taking a risk. The fact that I can take that risk, I think, speaks of the momentum here.”
AGU’s Pandya agrees: “it’s starting to emerge as a priority for scientific institutions and for scientific societies to do this kind of work and to see that [it] is supported, encouraged, facilitated, and rewarded.”
If you’ve ever done a PhD in physics, you’ll know you usually begin by ploughing through lots of background reading, learning how to use your lab’s equipment and maybe even carrying out some provisional experiments. My PhD was a bit different. I started off watching YouTube videos to improve my needlework.
The project I had accepted at the Ecole Normale Supérieure in Paris was about the mechanics of knitted fabrics. The research was to have two sides: a theoretical one to determine what equations described the system; and an experimental one to mechanically test actual knits to guide and verify the theory. The trouble was, I barely knew what a knit was when I accepted the project.
I quickly learnt that there are differences – both structural and mechanical – between a knit (such as a jumper, scarf or hat) and a weave (such as a table cloth, shirt or pair of jeans). In fact, those differences are easy to demonstrate. If you pull on your jeans, you should notice that the weave hardly deforms. Pull on a knitted jumper, in contrast, and it can be effortlessly elongated by up to two times its length. The stretchiness of a knit is also obvious if you wrap it around something: by locally stretching, a knit can fit complex shapes; a woven fabric, however, has to fold to conform to it.
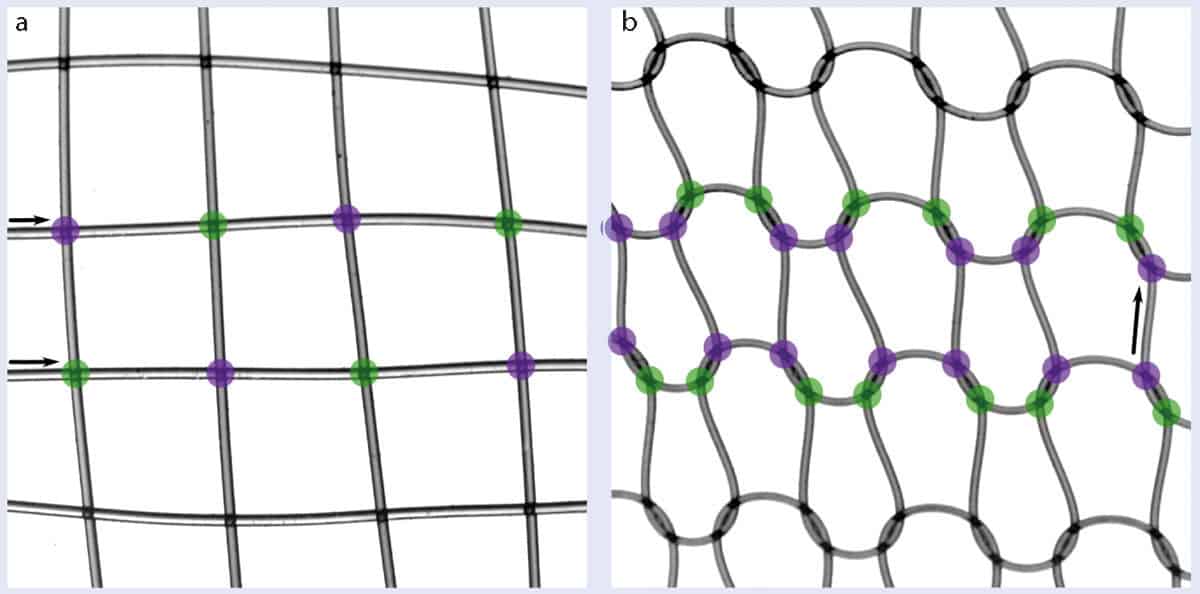
The discrepancies between knits and weaves are true even if they are made of the same yarn. That’s because it is the structure of how the yarn is interlaced that dictates the mechanical behaviour, not the precise composition of the material. As I soon learned in my PhD, a woven fabric is made from two bundles of yarns that intertwine perpendicularly (figure 1a). Pulling on a weave is therefore not very different to pulling on a single yarn.
1 Weave or knit: Knitted and woven fabrics behave differently because of how the yarn is arranged.
Knitted fabrics, however, are generally made from a single yarn shaped into a network of loops called stitches (figure 1b). Pulling a knit is therefore equivalent to deforming loops and not directly pulling on the yarn itself. This mechanism illustrates how different interlacing structures can affect the mechanics of a textile.
Knit science
I should make it clear that my fellow researchers and I were not the first people to wonder how a knit deforms. Anyone knitting for fun needs a profound empirical knowledge of knit structure and mechanics. A knowledge of knits is also important in industry – and not just for the clothing sector. It can, for example, be used to reinforce composites in planes, cars or trains.
The first studies of knit mechanics began in the 1960s. Inspired by mechanical engineers, the research involved modelling the exact path of a yarn in a stitch to determine how this yarn deformed if slightly pulled. This work provided some beautiful equations, but they described just one stitch and not a whole fabric.
More recent studies were encouraged by the graphics community, which might seem odd, but animated characters must be dressed properly too. This work led to a fully numerical approach (ACM Transactions on Graphics31 4), which starts from the yarn and goes up to the whole knit. It provided very realistic mechanics, but did not give an analytical expression of the fabrics’ mechanical constants, nor reveal the interplay between structural parameters (for example, size of stitch) and material parameters (such as the rigidity of the yarn).
My PhD therefore involved looking between these two extremes, where there’s a gap in our understanding. I wanted to find out if we can get equations to directly describe the mechanics of a whole fabric while at the same time defining the role of the individual parameters.
Knitting like a physicist
Two major issues arose early on in my quest to get answers. First, despite the YouTube tutorials and some precious advice from my grandmother, my early knits were terrible and useless for proper testing. The second problem was that the number of parameters in commonly used knits is colossal because even the most standard yarns are themselves incredibly complicated objects.
Despite the YouTube tutorials and some precious advice from my grandmother, my early knits were terrible and useless for testing
To tackle my lack of knitting skills, I contacted staff at a nearby art school, which luckily had a workshop with manual knitting machines and looms. More importantly, the head of the workshop kindly agreed to teach me how to craft the perfect knit. With this knowledge – and a 40-year-old, second-hand domestic knitting machine we bought for the lab – I was now able to make experiment-worthy knits.
To deal with the second problem – the complexity of the knit – we did what all physicists love to do: we simplified the system as much as possible so that only the essential parameters remained. We knew that what defines a knit is the pattern of the crossing points, so we began by picking the simplest yarn we could find – nylon fishing lines. Then, we made a very loose knit so the yarn did not get too deformed. Though a bit daring to be a garment, the resulting knit (similar to that in figure 1b) is a wonderful system for a physicist to play with. It means we only have to take into account a few factors (which may include several numerical parameters): the elasticity of the yarn, the structure imposed by the interlacing pattern and yarn–yarn friction at the crossing points.
Elasticity and tremors
We finally had a knit we could do experiments on. To assess its mechanical response, we measured the force needed to pull the knit and took pictures to evaluate how it locally deformed. The results were not as simple as we expected.
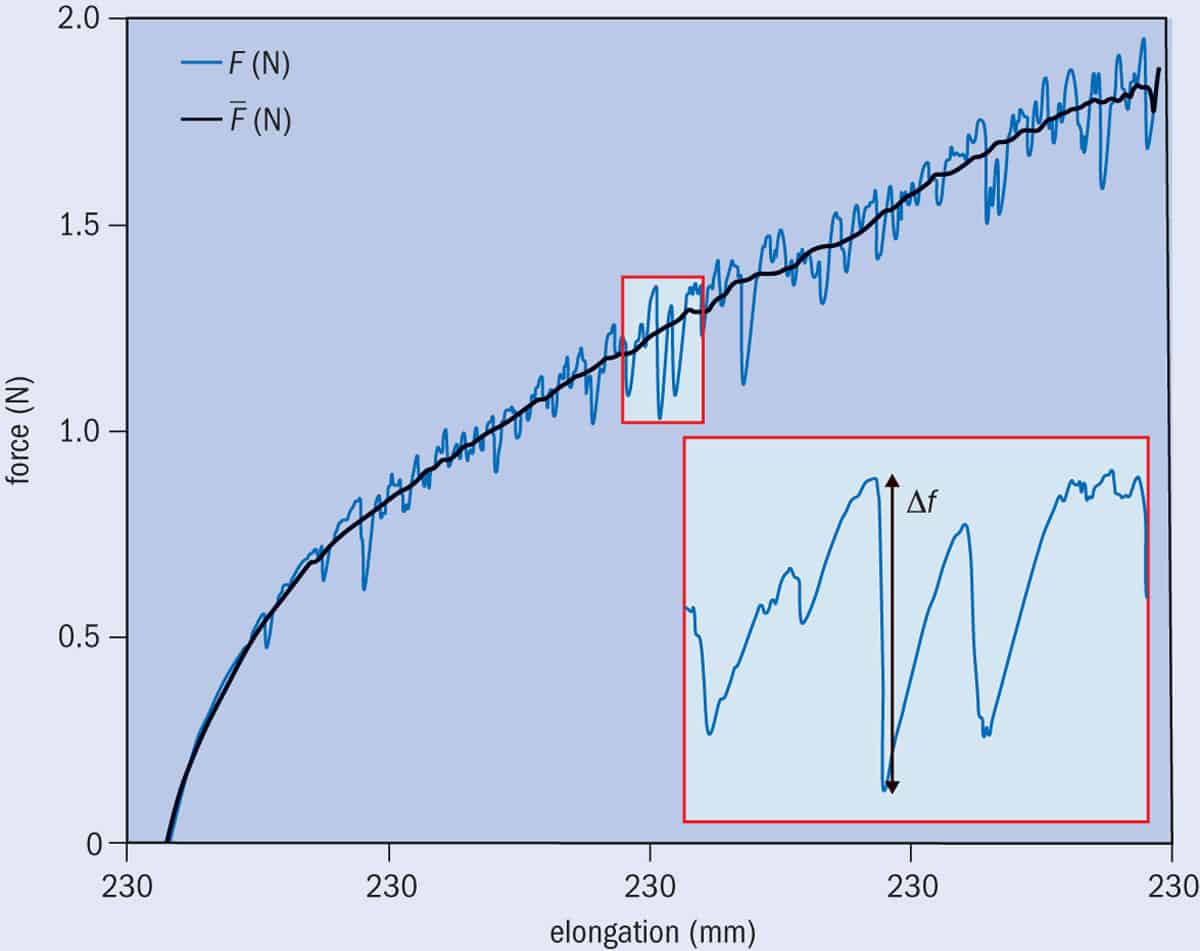
2 A noisy stretch: The mechanical response of a knitted fabric as it is stretched.
The mechanical response (figure 2) had two features – one elastic and the other noisy. The elastic element could be identified because of how it repeats with the stretching cycles, and it therefore was predictable. The noisy response – which warped the elastic one by small perturbations – was not identical over cycles and so had to be considered from a statistical perspective. By simplifying things in this way, we could easily spot the culprits for each response.
The elasticity of a fabric naturally derives from the yarn elasticity and the periodic looping stitches, so we need to define how these factors interplay. This means predicting how the elastic energy of the yarn varies as the knit is deformed.
Instead of basing the model on the yarn itself, as in standard mechanical studies, we looked at it as a network of subunits, or stitches. This approach makes the problem much simpler since one stitch is characterized only by the distance and orientation of its neighbouring stitches, not by the full path of the yarn. The tricky bit is to express the energy of the yarn as a function of the stitch dimensions.
In our simplified knit, the yarn deforms when it bends because stretching is much more energetically costly. The loop geometry of a stitch means that the curvature of the yarn is tightly linked to loop dimensions. As a stitch gets smaller, the bending energy increases, providing a simple relationship between energy and the network parameters. However, no stretching implies that the yarn is inextensible, a constraint we also have to express. Again, the link between the length of yarn in a stitch and the stitch dimensions is direct. If a loop expands in all directions, the yarn’s length must increase. So if the yarn is inextensible, loop expansion in one direction must be compensated for by a shrinking in a different direction.
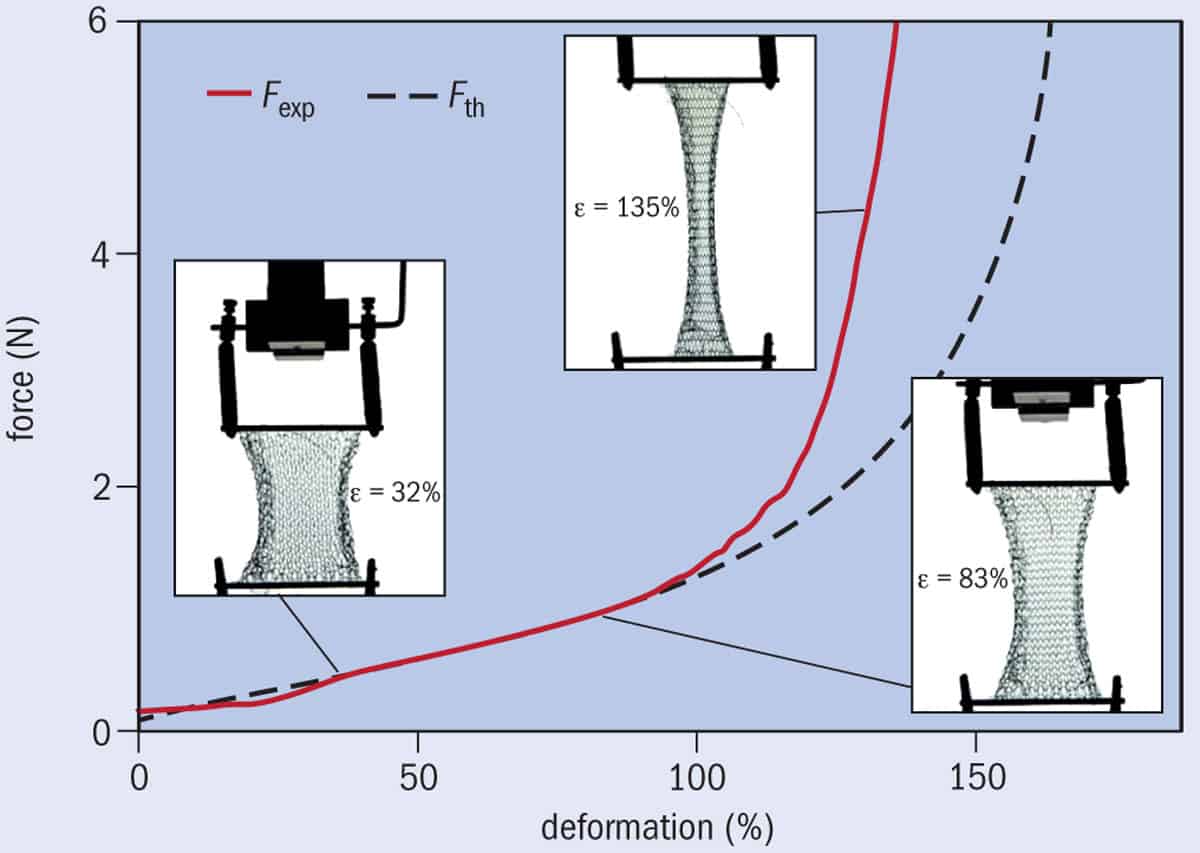
3 Model or experiment: The elastic mechanical response of a knit being stretched (Fexp) follows the theoretical prediction (Fth) until the knit is about twice its normal size.
Using these ideas, we obtained a mathematical formula giving the mechanical response of one stitch, and therefore also for a knit where all the stitches are deformed identically. The model perfectly captures the observed elastic response of a knit being pulled (figure 3), even when the knit is stretched to twice the initial size. At further elongations, however, stitches cannot laterally shrink any more because of the finite yarn diameter. The yarn then stretches and compresses – factors that are not taken into account in the model, which therefore underestimates the pulling force. To predict more realistic cases where deformation is inhomogeneous, we can keep the same approach but we have an additional constraint: stitches must keep the same neighbours (Physical Review X8 021075).
Crackling the knits
Let’s now look at the noisy part of the response in figure 2. By zooming in on the force curve, we notice that the fluctuations follow a very specific shape: a slow linear increase interrupted by an abrupt drop. We know that this behaviour was not due to the limitations of our equipment because it was up to 100 times larger than the precision of the experiment. Instead it can be explained by the fact that when one object is pushed along the surface of another, friction resists the pushing force. Below a critical force, friction dominates and the two objects stick together; above this force, however, the push overcomes the friction and the objects begin to slide across each other.
This phenomenon appears at each crossing point in our knit. As you pull it, the contacts will suddenly slide when the critical force is reached and the friction is overcome. That’s why you get the slowly increasing force, interrupted by the sliding-induced plunges.
The drops have many different sizes, meaning that the contacts don’t slide one by one but slip in groups. Indeed, contacts are not isolated from each other since they are linked by the elastic yarn.
To characterize all those events we first needed to look at statistical quantities such as the probability distribution of the drops’ amplitude (Δf). It turns out that there are lots of small drops but few big ones, following a power-law distribution (Phys. Rev. Lett.121 058002). One feature of this law is scale invariance, which means that some event properties are independent of their size. To illustrate this effect in the distribution, we can simply zoom in on a small portion of the curve and see that the size of the corresponding events cannot be distinguished anymore: the decreased rate remains constant.
This property is characteristic of so-called crackling noise – an intermittent response displayed by lots of systems that exhibit sudden events when being slowly loaded. The most widely studied example is the Earth’s crust. When two tectonic plates (such as the Pacific Plate and the North American Plate) rub against each other while travelling in opposite directions, they slowly build up energy while trying to overcome friction, but will then suddenly shift, resulting in an earthquake. The probability distribution of the earthquake’s size, known as the Gutenberg–Richter law, shows the same features as those measured in our knit.
Earthquakes, robots and jumpers
From structural mechanics to earthquake-like statistics, the physics behind pulling a knit is very rich. While understanding the elasticity of knits may help scientists find direct applications in composite reinforcement, soft robotics or architecture, comprehending the statistical part may help fundamental physicists understand why such different systems show similar behaviour.
By simplifying the knits, we have managed to isolate and understand different mechanisms that might otherwise be hiding behind other complex phenomena in standard knits. But we have to be careful to not oversimplify – for instance, if we had completely got rid of friction, as we initially planned to, we would have missed the crackling phenomenon.
Now my PhD is done, the next stage in this research is to add complexity, step by step and in a controlled way, by changing the knit pattern or the yarn properties. Maybe by the time we unravel all the intricacies of knitting, I may even have learnt how to knit a sweater for my grandmother.
Characteristic ripples that form in rubber bands just after they are launched into the air have been studied in detail by two physicists in the US.
Alexandros Oratis and James Bird at Boston University used a high-speed camera to reveal for the first time how stretched rubber bands develop longitudinal waves when released. The duo then used their observations to model the dynamics of the launching process and simulate it on a computer.
Many of us are familiar with the satisfying experience of stretching one end of a rubber band away from the thumb and then releasing it. The thumb seems to automatically move out of the way as the band shoots out into the air. This takes place over about 10 ms and so the dynamics that govern the band’s release – and the mechanism that causes the thumb to get out of the way – was a bit of a mystery.
Early on in their study, Oratis and Bird recognized that a retracting rubber band differed from the well-studied case of a single elastic strip being stretched and released. Unlike a simple strip, they reasoned, a rubber band adopts a straight-sided teardrop shape when stretched away from the thumb. This means that both ends of a stretched rubber band are highly curved immediately after release, and this must be included in any model describing the band’s subsequent behaviour.
Forward propagation
The high-speed camera images reveal that immediately after a band is released, a longitudinal stress wave begins to develop at its rear – something that had not been predicted by previous theoretical models. This wave then propagates forward at a well-defined speed – which is faster than the speed of band itself. Furthermore, the wavelength of the wave increases over time.
The videos also reveal how the shooter’s thumb avoids being hit by the band. As the band is stretched, the tension in the elastic is counteracted by the thumb pushing forward. Upon release, the thumb rotates forward and out of the path of the rubber band.
Oratis and Bird used their observations to construct wave equations for the ripples. Their model included stretching and inertia as well as the thickness and curvature of the band. The equations were used in numerical simulations that accurately reproduced the precise dynamics of retracting rubber bands for the first time.
The duo believes their findings can now better explain the dynamics underlying a wide variety of systems from from slingshot rides at amusement parks, to nanometre-scale molecular slingshots used for drug delivery.
Molecules known as traction-force activated payloads (TrAPs) made from strands of DNA containing different chemical groups might be used to help heal wounds, according to new experiments by researchers at Imperial College London. The new technology may lead to the development of a new generation of materials that interact with damaged tissues to constructively promote the process of repair.
TrAP technology
There are many examples of materials that are routinely employed to help heal wounds. These include collagen sponges that treat burns and scaffold-like implants that repair bones. “These materials act as passive bystanders, however, during tissue repair whereas wound healing is a highly dynamic, highly coordinated process involving many different cells over a period of time,” explains Ben Almquist, who led this research study. “TrAPs may provide the opportunity to design materials that ‘talk’ with these different cells in different ways and at different times to stimulate tissue repair processes.”
The damage caused by an injury triggers a series of natural defence and repair mechanisms that make cells migrate through the collagen networks present in a wound. As the cells move, they pull and exert traction forces on the collagen structure and this movement activates healing proteins that then begin their job of repairing tissue.
Recreating this natural process
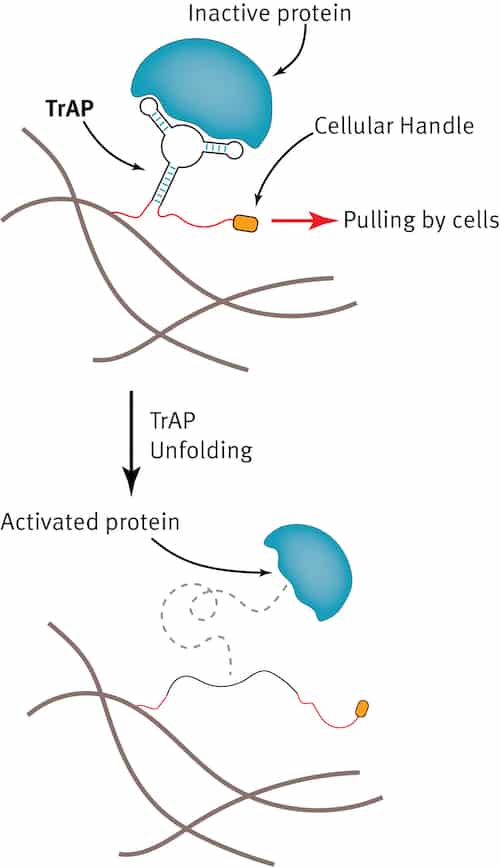
Almquist and colleagues designed their TrAPs as a way of recreating this natural process. The main component of the TrAPs is a short, single strand of DNA about 30-40 nucleotides long. Unlike in a double helix of DNA, in which two strands of DNA interact with each other in a specific way, the single strand can fold into a 3D shape by interacting with itself.
“When the DNA folds into this 3D structure, it can bind to proteins and inhibit them by fitting into small grooves or pockets on the surface of the protein,” says Almquist. “This is important since it is the 3D folded structure that can bind to proteins. These DNA molecules belong to a class of molecules called aptamers.”
To make their TrAPs, the researchers added a chemical group to one end of the single strand of DNA that they then used to attach the DNA to a material of interest, such as a collagen sponge. Next, they added a short peptide (a small fragment of a protein) to the other end of the strand. “This peptide is a like a ‘handle’ that cells can grab hold of,” explains Almquist.
Cells pull on the TrAPs
When placed in a cell culture, the researchers observed that the cells pull on the TrAPs as they travel through the collagen sponge. The traction forces produced unravel the DNA like a bow that unties to reveal and activate the bound proteins. These proteins then instruct the cells to grow and multiply – just like what happens in the natural biological process of wound healing.
And that is not all: by changing the cellular “handle”, the researchers show that they can change which type of cell grabs hold and pulls. This means that the TrAPs can be tailored to release specific healing proteins depending on which cells are present.
“We are currently exploiting the ability of these TrAPs to heal critical-size bone defects, for example,” says Almquist. “These are defects in bones that are too large to heal on their own.”
Reducing undesirable side effects
At the moment, therapeutic proteins are used to promote bone healing, but because of inefficient delivery, this technique requires many thousands of times more protein than the body naturally uses. This can lead to unintended consequences like bone growing in soft tissue where it shouldn’t. “We expect that our TrAPs will dramatically reduce the amount of protein needed to be effective, reducing these undesirable side effects, while also decreasing overall treatment costs since far less protein is needed.”
Other potential therapy areas include reducing scar tissue after heart attacks and repairing damaged nerves, as well as developing treatments for wounds that won’t heal using conventional techniques. One example is diabetic foot ulcers, says Almquist, which are the leading cause of non-traumatic lower leg amputations.
TrAPs are fully synthetic and relatively simple to make, which means that they could be scaled up to industrial quantities, he adds. They are also cheaper to make than structures made by protein engineering techniques.
Transfer to the clinic
“The fact that we use aptamers to make TrAPs is also a point in their favour,” he tells Physics World. “A handful of these molecules have already been clinically approved (or are undergoing clinical trials). This means that the technology we have developed will be easier to transfer to the clinic.”
“Since there has never been a method before that exploits cells pulling on materials to release therapeutics, there is much that we don’t know about how to optimally design these TrAPs for maximal impact and efficacy. We are thus now busy working on better understanding the mechanisms behind this effect.”
In the past, scientists were reluctant to attribute particular extreme weather events to climate change. But for the second consecutive year, they have done so with confidence.
Thanks to improved modeling, increased computer power, and better skill in interpreting data, attribution science – a young branch of climate science – has been blossoming, says Jeff Rosenfeld, editor-in-chief of the Bulletin of the American Meteorological Society (BAMS).
It’s a calculation of how the risks have changed in the new climate
Based on the research of 120 scientists in 10 countries, the report comprises 18 peer-reviewed chapters; each deals with a particular weather phenomenon during 2017.
“The studies look at what the climate is now, then they run tests to compare it to what the world might have been had we not been releasing greenhouse gases at this rate,” Rosenfeld said at AGU. “It’s a calculation of how the risks have changed in the new climate.”
Martin Hoerling of the US National Oceanic and Atmospheric Administration (NOAA), editor of the report, said that over the seven years of the Explaining Extreme Events series, 70% of events studied had had some “appreciable climate change footprint”. This trend was predicted in the first IPCC report in 1990, he noted.
The researchers estimate that the Tasman Sea marine heatwave from November 2017 to April 2018 couldn’t have occurred without the input of anthropogenic climate change. The heatwave extended from west of Tasmania, off Australia’s southern coast, to east of New Zealand and included the entire Tasman Sea, an area of 2,000 by 2,800 km.
Although natural variability was important in initiating the heatwave, two global climate model (GCM) ensembles indicate that the record sea surface temperatures, up to 2.5 °C above the long-term norm, “were virtually impossible without anthropogenic influence”, the scientists report.
Other extreme events in the BAMS report were intensified in strength or duration – or both – by climate change. They include instances of heat, drought, flooding and ocean-driven phenomena. For example:
The record-breaking low precipitation over parts of western Europe during December 2016 can only be understood in the context of human influence on climate, the authors say, in particular the unprecedented reduction of Arctic sea ice, “likely driven by anthropogenic climate change”.
In 2017 South Korea experienced the hottest May temperature since the beginning of observations from 45 stations in 1973. 2017 was the fourth consecutive year of record-breaking May temperatures, statistically a one-in one-thousand-years event without anthropogenic forcing, but a one-in-one-hundred-years event when human influences on the climate are factored into the models.
In the Northern Plains of the US, devastating drought conditions developed rapidly during spring and summer of 2017. By August, drought was widespread in eastern Montana and North and South Dakota, leading to wildfires and compromised water resources. Model simulations suggest that, although record low precipitation was the principle cause of this drought, climate change makes droughts with a similar intensity 1.5 times more likely.
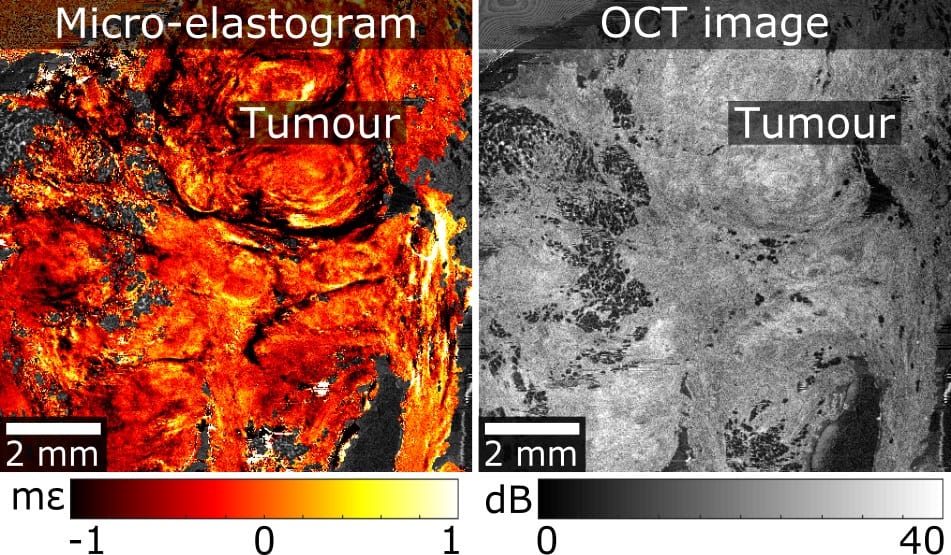
Optical coherence micro-elastography of invasive tumour. The micro-elastogram shows disorganized local axial strain texture and the OCT image shows heterogeneous intensity, both indicating the presence of invasive tumour. (Courtesy: Wes Allen)
For patients with early-stage breast cancer, breast-conservation surgery is a preferred option to mastectomy. However, if histopathological analysis reveals that the malignant tissue was not totally removed, the patient will need to undergo re-excision days later. A tool that could accurately assess tumour margins during breast-conserving surgery would help surgeons to totally remove the tumour in the initial procedure and reduce re-excision rates, which are currently up to 30%.
A technique that shows promise to visualize tumours in human breast tissue is optical coherence micro-elastography (OCME). Researchers at the University of Western Australia have used OCME to visualize a range of tumour morphologies in wide-local excision (WLE) specimens removed during breast-conservation surgery, and determined its potential for imaging tumour margins (Biomed. Opt. Express 10.1364/BOE.9.006331).
OCME, a variant of optical coherence elastography, is a label-free imaging technique that generates mechanical contrast by mapping the deformation (local axial strain) that results from compressing the excised tissue. As OCME utilizes phase-sensitive optical coherence tomography (OCT) to measure local strain, it also generates optical contrast and can produce dual-contrast images, called micro-elastograms, by fusing together mechanical and optical contrast. Micro-elastograms improve the ability to detect a broader range of tumour morphologies compared with OCT images alone.
The OCME system used for this research comprises an OCT system, a specimen mounting mechanism, and a wide-field translation system that generates images of approximately 46 x 46 mm. An automated algorithm segments the wide-field OCT scans into dense and non-dense regions, and generates individual wide-field en face micro-elastograms in 20–30 s, a critical ability for rapid interpretation in eventual clinical use.
Led by principal investigator Brendan Kennedy, researchers at the BRITElab of the Harry Perkins Institute of Medical Research acquired OCME data sets of 28 margins from 17 WLE specimens. Of the 28 margins scanned, 23 were clear and consisted of adipose tissue and stroma, while five contained tumour within 1 mm of the edges. As OCME provides optical and mechanical contrast from a single dataset, it can generate OCT images alongside micro-elastograms.
Clinical transfer
The researchers identified several challenges to be resolved before OCME can be used clinically. These include incorporating methods to further increase contrast across a range of tumour types, including highly cellular tumour, for example. The authors also need to gain better understanding of the effects on mechanical properties caused by thermal damage to the tissue, which can occur during excision.
In addition, a much faster scanning protocol needs to be developed to reduce imaging time. The current automated protocol scans a maximum of two margins in approximately 30 minutes. The post-processing time of data sets, which takes approximately three hours per margin, also needs to be significantly reduced.
In ongoing work, the team has incorporated quantitative micro-elastography, another variant of optical coherence elastography, into the system to enable a broader range of tumours to be visualized by quantifying tissue stiffness. “Using this new system, our research team is in the final stages of a larger study in which we have scanned over 140 margins from 71 patients at Fiona Stanley Hospital in Murdoch, Western Australia,” lead author Wes Allen tells Physics World. “The micro-elastograms generated will allow a blinded reader study to be performed, determining the diagnostic accuracy.”
The team is also working closely with Christobel Saunders, a consultant breast cancer surgeon, senior pathologist Bruce Latham and a start-up company from the University, OncoRes Medical, of which Kennedy is the chief scientific officer. Allen says that they are working to miniaturize the technology into a hand-held probe that will allow a surgeon to scan the margin of the excised tissue for tumour, as well as directly detecting tumour that has been left in the patient by scanning the breast cavity.
A compact neutron source has been used to quickly and non-destructively measure the amount of salt inside pieces of concrete. The technique was developed by Yoshie Otake and colleagues at RIKEN in Japan and could help assess salt damage in the world’s ageing civil infrastructure.
Concrete reinforced with steel beams is a key component of bridges, tunnels and other civil infrastructure; and therefore maintaining its integrity is an important task worldwide. As reinforced concrete ages, the steel beams can corrode as salt penetrates the material. This is a significant problem in coastal regions, where salt is present in sea spray, and also in places where salt is used to melt ice on roads and walkways. Salt incursion is a particular problem in Japan because of the country’s densely populated coastline and temperate climate. Japanese engineers are therefore very keen to determine when salt corrosion exceeds safe legal limits so that structures can be repaired or replaced.
Streamlined process
Current methods for corrosion inspection involve boring out core samples from concrete – which is a time-consuming and potentially destructive process. To streamline the inspection process, Otake’s team has developed a technique that uses a neutron beam to measure the salt content inside concrete. Because it is non-destructive, the technique can monitor changes in salt content over time without the need to bore more and more holes.
Otake and colleagues made their measurements using the RIKEN’s Accelerator-driven Compact Neutron Source (RANS), which produces a neutron beam by bombarding a beryllium target with 7 MeV protons. These neutrons emerge at high speeds and are then slowed-down (or themalized) by passing them through a polyethylene moderator.
Neutrons are an ideal probe of concrete because they can travel deep into the material with relative ease. Occasionally, however, neutrons will interact with atomic nuclei in the concrete creating gamma rays that can then escape.
The RIKEN researchers use high-resolution germanium detectors to measure the energy distribution of these gamma-rays, looking for the distinctive energy peaks associated with the chlorine nuclei in salt. They tested the technique by sandwiching salt between concrete slabs and trying to detect it. In just 10 min, the team determined the salt content of regions surrounded by up to 18 cm of concrete.
“Our feasibility study has shown that neutron beams can indeed be used to measure whether the salt content of a concrete structure is within the legal limits set by the government,” says Otake. However, the technique cannot currently be used in the field because RANS is too large to move. “Our next challenge is to build a compact neutron source that is small enough to be readily transported to various infrastructures to conduct measurements”.