Composite chitin film could replace plastic packaging

Researchers at the Georgia Institute of Technology have developed a material from two naturally-occurring polymers that could offer an environmentally-friendly alternative to traditional plastic packaging for food and consumer goods. The material is made by layering cellulose – the most abundant biopolymer on Earth – with chitin, which is widely found in shellfish, insects and fungi.

Cellulose is a linear homopolymer of glucose, while chitin is a linear homopolymer of N-acetyl glucosamine. Both biopolymers are found in the hierarchical structures of plant cells and crustacean exoskeletons, respectively, from which nanocrystals and nanofibres can be extracted. Cellulose nanocrystals and nanofibres, and chitin nanowhiskers and nanofibres, have a high Young’s modulus and tensile strength as well as being good barriers to many gases, including oxygen.

The research team, led by Carson Meredith, created films from the two biopolymers by suspending cellulose nanocrystals (CNCs) and chitin nanofibres (ChNFs) – which are negatively and positively charged, respectively – in water, and then spraying them onto a compostable substrate in alternating layers. The processing technique is compatible with roll-to-roll coating.

67% reduction in oxygen permeability

Meredith and colleagues found that the material shows up to a 67% reduction in oxygen permeability compared to some forms of polyethylene (PET), which is one of the most common plastics employed in transparent food packaging today. This improvement comes from the crystalline structure of the nanofibres and means that it could, in theory, keep foods fresher for longer, say the researchers. The most impermeable composites were the ones that were made of three alternating layers of ChNF-CNC-ChNF).

“It’s difficult for a gas molecule to penetrate a solid crystal, because it has to disrupt the crystal structure,” says Meredith. “Something like PET on the other hand has a significant amount of amorphous or non-crystalline content, so there are more paths and it is easier for a small gas molecule to find its way through.”

Scaling up

It is not all plain sailing though, and the researchers say that they now need to develop a scaled-up manufacturing process so that their film is cost competitive with traditional packaging materials. “What is more, while industrial processes to mass produce cellulose are mature, methods to produce chitin are still in their infancy,” explains Meredith. “And, more research is also needed to improve the material’s ability to block water vapour.

Another important point: “Ground, coarse powders, of cellulose and chitin have a generally-recognized as safe (GRAS) status with the US Food and Drug Administration (FDA) and can be used as food additives,” he tells Physics World. “However, some have asked whether a material derived from shellfish would cause allergies in shellfish-sensitive people. In the packaging we propose, a typical shellfish allergy response is unlikely because the chitin is so highly purified. However, the question of whether purified chitin or cellulose fibres could be released from the packaging and induce their own allergy response should be addressed.”

The spray-coated multilayer CNC-ChNF nanofibre film is detailed in ACS Sustainable Chemistry and Engineering 10.1021/acssuschemeng.8b01536.

What is time? A question of metaphysics

Regular readers of the magazine will be familiar with “Lateral Thoughts” – Physics World’s long-running column of humorous or otherwise offbeat essays, puzzles, crosswords, quizzes and comics, all written by our readers – that appears on the back page each month. For this month’s special issue on the theme of “time – the abiding mystery”, siblings Eugenia Viti and Ivan Viti have crafted a comic that takes a wry look at the physics and metaphysics of time. Eugenia is a cartoonist, illustrator and writer living in Chicago. Follow her on instagram (ayokdit) to see how much pizza she eats. It’s a lot. Ivan has a PhD in physics and is currently working as a postdoctoral researcher at the University of Notre Dame, Indiana. He lives with his wife, two cats, two dogs and one goldfish.

Comic about time

Gravity waves make clouds disappear

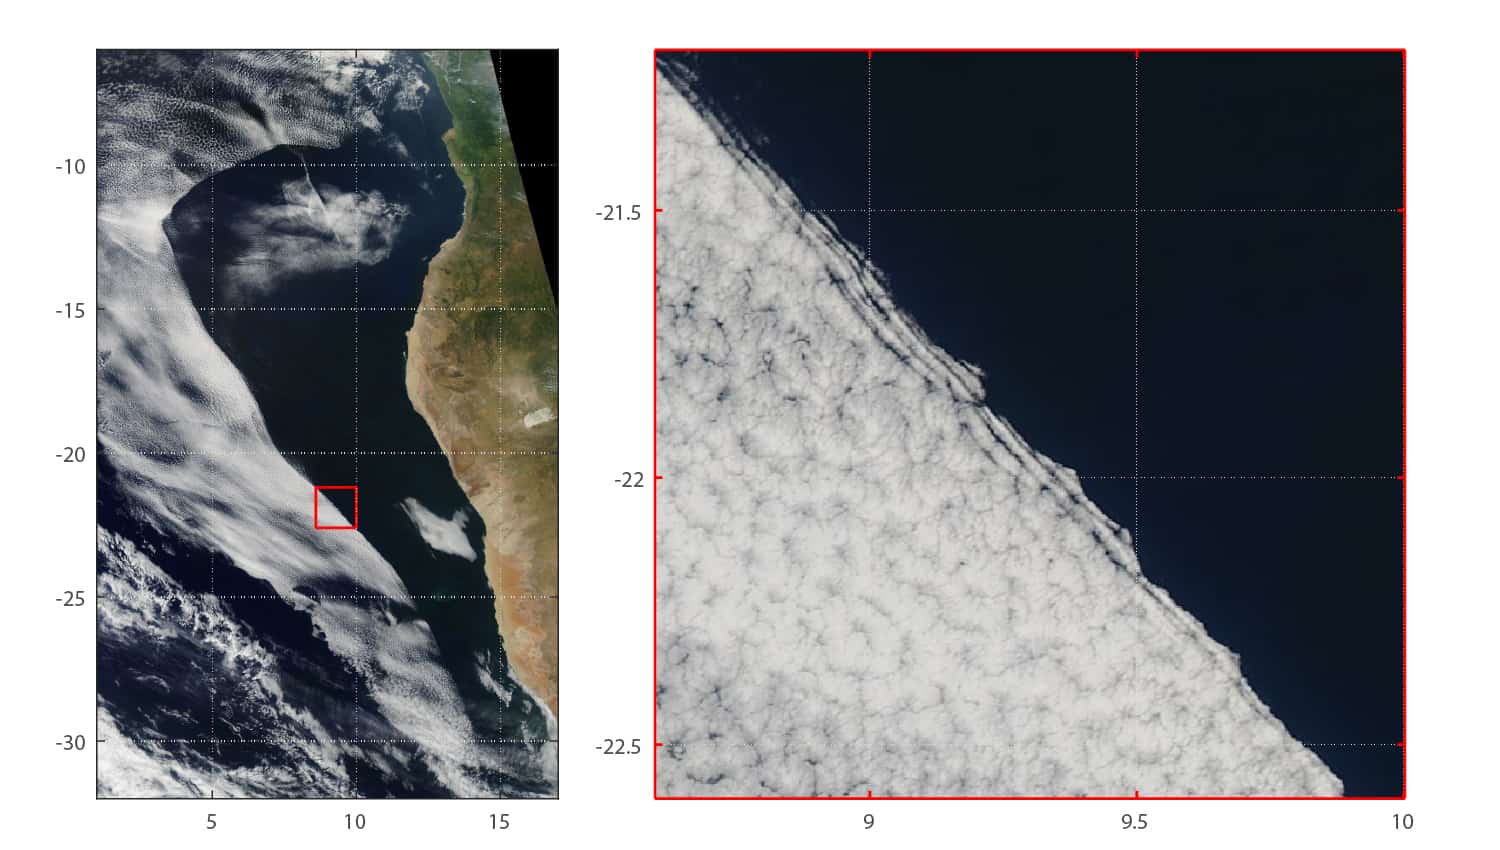
Satellite image of cloud cover over the south-east Atlantic Ocean

Rapid clearances in cloud coverage in the south-east Atlantic Ocean could be caused by pulsing atmospheric gravity waves originating from the African mainland. Using satellite images, a research team led by Sandra Yuter at North Carolina State University in the US explored the atmospheric mechanisms involved in the cloud dissipation for the first time. Their work could become crucial in understanding heating processes in the Earth’s atmosphere.

Between April and June, satellite images have revealed that large areas of stratocumulus clouds off the coast of south-western Africa often rapidly erode over periods of just around 15 minutes. According to the images, the clouds are partially or completely cleared along sharply-defined transition lines, which can be hundreds or even thousands of kilometres long. The lines propagate westwards at speeds of 8 to 12 metres per second, travelling as far as 1000 kilometres from the coast.

In their study, Yuter’s team concluded that the wave-like patterns exhibited by the clouds extend too far into the ocean to be caused by heat transfer from land. Instead, they proposed that the effect is caused by gravity waves – oscillations in the buoyancy of the atmosphere that propagate due to the force of gravity. Such gravity waves often appear as transitions from overcast to clearer skies, or from thicker to thinner clouds, and previous studies have shown that gravity waves can create clouds. Until now, however, the mechanisms involved in reducing cloud cover have not been widely studied.

Yuter and colleagues suggested that if gravity waves are the true cause of the cloud dissipation, they are most likely to be triggered by the interaction between offshore winds flowing perpendicular to the African coastline with the more stable marine boundary layer in the atmosphere. A train of regular gravity waves is then created due to offshore breezes being consistently generated every day. The enhanced atmospheric turbulence from these wave trains causes warm, dry air from the upper troposphere to move down to the cloud layer, quickly dispersing cloud coverage.

Since clouds reflect heat from the Sun, giving them a critical role in cooling the Earth’s climate, the research could provide important insights into creating models that accurately predict atmospheric heating. Yuter’s team acknowledge that this will require more targeted observations of the atmosphere of the south-east Atlantic, using techniques including dropsondes, airborne radars, and lidar measurements. In future studies, the researchers hope to use a combination of observations, re-analysis and atmospheric modelling on smaller scales to confirm their proposal.

Yuter and colleagues report their findings in Science.

Flooded internet is possible by 2035

US engineers have identified a problem nobody had ever expected to confront so soon: the approach of the flooded internet, caused by worldwide sea level rise. Within 15 years sea water could be lapping over buried fibre-optic cables in New York, Seattle, Miami and other US coastal cities, according to a new study.

The consequences for global communications are unknown. But, as the glaciers melt, and the water in the oceans continues to expand as temperatures rise, the chances of urban flooding will increase.

And that means water where nobody expected it – over buried cables, data centres, traffic exchanges, termination points and other nerve centres of the physical internet, according to a team from the University of Wisconsin-Madison and the University of Oregon, US.

“Most of the damage that’s going to be done in the next 100 years will be done sooner than later,” said Paul Barford, the computer scientist who led the study and presented it to a meeting of network scientists. “That surprised us. The expectation was we’d have 50 years to plan for it. We don’t have 50 years.”

In fact, such buried infrastructure is usually sheathed in water-resistant protection, but water-resistant is not the same as waterproof. And while submarine cables are fashioned to withstand extended seawater corrosion and pressure, urban services don’t have quite the same level of future-proofing.

But city managers already have the awful lessons of massive flooding in New York  from Superstorm Sandy, or of New Orleans from Hurricane Katrina, or of Houston from Hurricane Harvey.

The message from climate science for the last five years has been simple: expect more coastal flooding.

The US scientists looked only at the challenges for the US. They calculate that by 2033 an estimated 4000 miles (6400 km) of buried fibre-optic conduit will be under water. More than 1100 traffic hubs – internet exchange points that handle massive quantities of information at colossal speeds – will be surrounded by water.

Many of the conduits at risk are already at or near sea level, and only a very slight further rise could bring extra risk, especially at those places where the submarine cables come ashore.

“The landing points are all going to be underwater in a short period of time,” Barford believes. “The first instinct will be to harden the infrastructure. But keeping the sea at bay is hard. We can probably buy a little time, but in the long run it’s just not going to be effective.”

And, he told academics and industry scientists at an Applied Network Research Workshop: “This is a wake-up call. We need to be thinking about how to address this issue.”

fMRI reveals finger motion encoding in the brain

Cortex maps

Researchers at the Brain Center Rudolf Magnus in the Netherlands have used population receptive field (pRF) modelling to confirm the ordered representation of human fingers in the motor cortex. While a topographic map (smooth transitions from the thumb to the little finger) of the fingers in the somatosensory cortex is well established, it was unknown whether this pattern was evident in neighbouring motor regions.

The team used computational pRF modelling to analyse functional MRI (fMRI) data of participants flexing and extending their fingers during a scan. In addition to finding finger organization, the group found a degree of interconnectedness between somatosensory and motor cortices, and showed differences in the neural population receptive field size across fingers (NeuroImage 10.1016/j.neuroimage.2018.06.062).

During a scan, the participant flexed each finger in turn (thumb to little finger, or vice versa) holding each position until all fingers were flexed. Then, each finger was extended in turn. The order and timings were cued by a visual stimulus; the subjects also wore an MR-compatible glove that tracked flexion, for quality control.

What is a pRF?

The receptive field (RF) of a single neuron is the region in sensory space to which that neuron responds most strongly/selectively. Since fMRI defines a volume element (voxel) in an image, each voxel therefore represents the sum of many neurons, i.e., a population receptive field.

Since the researchers knew the order and timings of flexion/extension, they could create a predicted model of the stimulation during the scan. This model is a voxel-wise time-series, which tracks the blood oxygenation level dependent (BOLD) response across a cortical region-of-interest (in this case, motor and somatosensory areas).

For every voxel in the brain region, the researchers compared the predicted model time-series with the actual BOLD data acquired in the experiment, using a non-linear least squares minimization algorithm  to minimize the errors between predicted and real time-series. This gave a set of stimulus-relevant parameters – in this work, an explicit Gaussian model that possess a centre and a spread. For every voxel, the centre shows which finger moved, while a larger spread indicates that the voxel responds more to other fingers than its own preferred one.

The pRF method is a highly robust way of mapping topographic patterns in the brain, since it takes receptive field properties (such as pRF size and broad neural tunings) into account, explaining the fMRI signal to a larger extent. It is therefore better equipped to distinguish true signal from noise.

Flexion or extension?

The group found that ordered individual finger representations crossed both motor and somatosensory areas. They suggest that an interdependence of motor and somatosensory development explains the concurrent maps running across both regions. Overall, it seems that some neuronal populations in both sensory and motor areas respond to multiple fingers.

Smaller pRFs were found for the thumb and larger pRFs for the little finger, but this pattern wasn’t always perfectly linear. Finger organization was less clear with finger extension compared with finger flexion, and pRF size was larger for extension. This could be because letting go of something (extension) doesn’t require the same level of specificity as gripping something (flexion) in day-to-day usage.

The larger pRFs for the little finger and finger extension could imply that these neural populations are relatively unspecific (to the finger or to the motion).

One note of caution is that the pRF size estimate (spread of the Gaussian model) can be influenced by non-neural factors. For example, it also depends on the order of stimulation, which defines which finger moves first; or finger enslavement, where the ring and little fingers are difficult to move independently.

This work provides an interesting first look at applying pRF mapping to brain regions other than visual cortex. There are several challenges regarding the development of this method for somatosensory and motor domains, such as experimental design and pRF model choice, among others. This research is an exciting first glimpse of the rich information that can be revealed by this flexible method.

Seeking clarity on melting land ice

In this episode of Physics World Weekly, James Dacey catches up Jonathan Bamber, a glaciologist based at University of Bristol in the UK. Bamber – who is also the president of the European Geosciences Union – recently co-authored a paper in Environmental Research Letters, which investigates the contribution of land ice to sea level rise during the satellite era. In a wide-ranging conversation, Bamber discusses the paper, the current state of climate modelling, and how his background in physics has influenced his approach to environmental research.

If you enjoy the podcast then you can subscribe via iTunes or your chosen podcast app.


Electron images achieve record-breaking resolution

A new electron microscopy technique that achieves far better resolution than ever before, while also minimizing potential electron damage to the sample, has been unveiled by researchers in the US. The team presented images of the 2D material molybdenum sulphide that show unprecedented atomic-level detail, and they are confident that the technique could also be exploited in a range of applications where traditional electron microscopy has proved difficult.

Electron microscopes are valued for their increased resolution over visible light microscopes, thanks to the much smaller wavelength of electrons relative to photons. However, the resolution of these instruments is constrained by small aberrations in electron lenses, which limit the size of the aperture and make it difficult to focus the electron beam. Electron microscopists have so far achieved resolutions of around 0.5 Å (0.05 nm) in bulk materials – generally good enough to see individual atoms – by combining sophisticated and expensive aberration-correctors with shorter-wavelength, higher-flux electron beams that increase the signal-to-noise ratio.

Damage limitation

However, these shorter-wavelength, higher-energy electrons can do significant damage to samples, especially at high electron fluxes. “There are two damage mechanisms from electrons,” explains David Muller of Cornell University in New York. “One of them is that you ionize the sample and you kick electrons off. The other is that the electron transfers so much momentum to the nucleus that it kicks it off its lattice site and breaks bonds. The lower your beam energy the less you’re going to knock things around.”

These damage mechanisms have prevented the attainment of sub-angstrom resolutions in delicate samples such as 2D materials, which can rapidly be obliterated by a powerful electron beam: “If I have a 2D material and I knock off one atom every second, I’m going to notice almost immediately that it’s looking like Swiss cheese,” says Muller.

Muller and colleagues solved the problem by exploiting a technique called ptychography, which was first conceived for X-ray crystallography almost 50 years ago but in principle is equally applicable to imaging with electrons. The idea is to record the exact diffraction pattern built up on the detector from every point in the sample, and to study how this changes across the sample. From this information, it is possible to reconstruct the phase of the matter wave diffracted by the sample and to work out the shape of the diffracting object – in other words, the pattern of atoms.

As the technique not only records the beam intensity, but also uses it to reconstruct the underlying quantum wavefunction, it can extract much more information per electron – and so potentially requires far fewer electrons. But its use in electron microscopy has so far been hampered by the formidable requirements placed on the detector. This is because ptychography requires the phase of the wavefunction to be measured equally precisely in both dark and light spots, but in electron diffraction experiments the high-angle diffraction peaks are extremely dim compared to the signal from the main beam.

To address this problem, Muller and colleagues have developed a detector capable of recording single electrons, even though some pixels are subjected to an electron flux a million times greater than others. “Imagine I had a camera, and I took a picture of you and the Sun shining from behind you,” says Muller. “Our detector would be able to image all the sunspots on the surface of the Sun and all the details of your face in the shadow.” This new instrument, which the scientists have dubbed the electron microscope pixel array detector (EMPAD), allowed them to perform full electron ptychography for the first time.

Imaging at the atomic scale

The researchers demonstrated their approach by imaging the 2D material molybdenum disulphide. Despite using electrons of only 80 keV – less than half the 200 keV often used to image bulk samples – the researchers achieved record-breaking resolution of 0.39 Å. They were able to clearly discern features that were unclear in images produced using other techniques, such as a sulphur monovacancy – a random defect in which one of two sulphur atoms in the MoS2 lattice structure is missing but the other is still present.

The researchers are now looking at other types of systems, such as biological samples. “Biological materials are extremely sensitive to radiation,” says Muller, “so the resolution of biological systems in limited by the number of electrons you can put on the sample.” They are also studying tiny strains in catalyst nanoparticles, which are crucial for their chemical activity.

John Rodenburg of the University of Sheffield, one of the inventors of electron ptychography, is impressed. “Many years ago we showed that if you had a bad electron lens, you could improve on it many times. This paper is the first to show that you can way surpass even a good electron lens,” he says.

Rodenburg believes the real potential of the work is in 3D imaging. “The phase is linear as you put more atoms on top of one another,” he explains. “That gives you the possibility of getting the three-dimensional structure of a material out, and that’s what X-ray ptychography is mainly used for.”

The research is published in Nature.

Characterization service promises graphene industry a leg up

“Lack of standards, and a lack of understanding in terms of what a material is and what a material isn’t,” is what James Baker, CEO of Graphene@Manchester, and many others believe is holding back companies working to industrialize graphene-based products. To help companies around this barrier to commercialization, the National Physical Laboratory in Teddington and the National Graphene Institute in Manchester, UK, have launched a service to provide characterization. We spoke to experts from industry and academia at the launch to hear their thoughts on what impact the service will have.

US targets electron-ion collider to stay top in nuclear physics

The US should begin planning a next generation electron-ion collider (EIC) to study the structure of protons and neutrons in unprecedented detail. That is according to a 15-strong committee of the National Academies of Sciences, Engineering, and Medicine. It’s 115-page report, commissioned by the US Department of Energy (DOE), says that an EIC with high energy and luminosity as well as highly-polarized electron and ion beams “would be unique to greatly further our understanding of visible matter”.

The science that can be addressed by an EIC is compelling, fundamental, and timely

Gordon Baym

By accelerating and smashing together electrons with protons or ions, an EIC, the report says, would address profound questions about nucleons such as how their mass and spin arise and what is the role of gluons, the carrier of the strong force. The report calls for a machine that can accelerate electrons up to 20 GeV and ions with an energy up to 300 GeV at high luminosity.

“The science that can be addressed by an EIC is compelling, fundamental, and timely,” says Gordon Baym from the University of at Urbana-Champaign, who co-chaired the committee. “The realization of an EIC is absolutely crucial to maintaining the health of the field of US nuclear physics and would open up new areas of scientific investigation.”

That view is backed up by panel member Richard Milner, a physicist at the Massachusetts Institute of Technology. He told a press briefing that the EIC “would have a substantial impact on US accelerator science, and in the production of breakthroughs in understanding materials and in life science”.

Compelling questions

The committee emphasizes that no specific design for the facility is under way and that the committee’s remit did not include any estimate of the US EIC’s costs or location. However, the long-range plan for nuclear physics — as set out in 2015 by the DOE and the National Science Foundation — identifies construction of a high-luminosity polarized EIC as the highest priority following the completion of Michigan State University’s Facility for Rare Isotope Beams in 2020.

Indeed, the panel asserts that significant and relevant accelerator infrastructure and expertise already exists in the US. The Brookhaven National Laboratory (BNL) operates the Relativistic Heavy Ion Collider, which smashes together heavy ions to study quark-gluon plasma, while the Thomas Jefferson National Accelerator Laboratory’s recently upgraded Continuous Beam Accelerator Facility accelerates electrons before firing them into fixed targets.

The report notes that both labs have proposed design concepts for an EIC “that can use existing infrastructure and both laboratories have significant accelerator expertise and experience”. However, it cautions that “neither of the existing designs can fully deliver on the three compelling science questions” that the EIC would need to address.

Stuart Henderson, director of the Jefferson Lab, BNL director Doon Gibbs and Bernd Surrow from Temple University, who is chair of the electron ion collider user group, note in a joint statement that they are “very pleased” with the report’s conclusions. “Just as studies of fundamental particles and forces have driven scientific, technological, and economic advances for the past century -from the discovery of the electrons that power modern life to the understanding of the structure of the cosmos [so] research conducted with an EIC will spark innovation and enable widespread technological advances,” they note.

China is the only other country that has tentative plans for such a facility, but it would be much lower in energy and intensity that the US machine. “At the moment we are the only one,” panel co-chair Ani Aprahamian from the University of Notre Dame told Physics World. “That would ensure global leadership for this project.”

Why is winter air responding to pollution cuts so slowly?

Over roughly the last decade, air quality regulations have lowered sulphur dioxide pollution in the US by nearly 70% and nitrogen oxides by around one-third. But air has improved more in the summer, with winter air pollution proving difficult to shift. Now a study of pollution plumes in winter has discovered why.

“In the past 10 years or so, the summer air pollution levels have decreased rapidly, whereas the winter air pollution levels have not,” says Viral Shah, then of the University of Washington, US. “Air quality in summer is now almost the same as in winter in the eastern US. We have pinpointed the chemical processes that explain the seasonal difference in response to emissions reductions.”

Shah and colleagues flew through pollution plumes over New York City, Baltimore, Cincinnati, Columbus, Pittsburgh and Washington DC, and above the coal-fired power plants of the Ohio River Valley. Their measurements were part of the 2015 Wintertime Investigation of Transport, Emissions and Reactivity (WINTER) campaign. They also used ground-based observations; and the GEOS-Chem chemical transport model.

Over the last decade, summertime levels of particulates in the eastern US have dropped by about a third. But wintertime levels have decreased by only half as much. Particulates form from sulphates – resulting from sulphur dioxide released mainly by coal-fired power plants – and nitrates, created from nitrogen oxides (NOx).

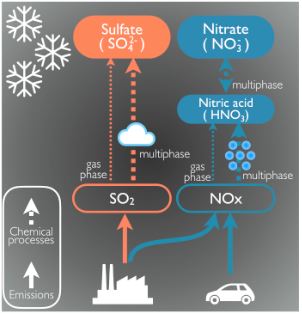
Illustration showing that sulphur dioxide from power plants (red) and nitrogen oxides from both power plants and cars (blue) follow various paths to form hazardous sulphate and nitrate particulates.

“The air quality models that we use to understand the origin of air pollution perform quite well in summer, but have some issues in the wintertime,” says Lyatt Jaeglé of the University of Washington. “Before this study, we could not reproduce the observed particulate composition in winter.”

In summer, particulate numbers fall as emissions of NOx and sulphur dioxide decrease. Some of the emitted NOx and sulphur dioxide remains in the gas phase rather than forming particulates, becoming broken down by sunlight or deposited on land.

In winter, when there’s less sunlight and temperatures are lower, more chemistry occurs in the liquid phase – on the surfaces of existing particulates or on liquid droplets and ice crystals in clouds – than the gas phase. In the liquid phase, the study showed, when emissions of sulphur dioxide and NOx are lower, sulphur dioxide converts to sulphate more efficiently because more oxidants are available. And as sulphates decrease, the particulates are less acidic, so that NOx can convert more easily to nitrates.

That means the total amount of particulates in wintertime has dropped more slowly than the primary emissions have decreased.

“It’s not that the reductions aren’t working,” says Shah, who’s now at Harvard University, US. “It’s just that the reductions have a cancelling effect, and the cancelling effect has a set strength. We need to make further reductions. Once the reductions become larger than the cancelling effect, then winter will start behaving more like summer.”

At currently forecast rates of emissions reductions, air quality in winter will continue to improve only gradually until at least 2023.

“We now have a better tool to look at what is the best strategy to improve wintertime air quality on regional scales in the eastern US, and potentially other places, like Europe and Asia,” says Jaeglé.

Shah, Jaeglé and colleagues reported their findings in PNAS.


Copyright © 2026 by IOP Publishing Ltd and individual contributors