Time traders

Just after 2.30 p.m. local time on 6 May 2010, Wall Street experienced one of the biggest, and briefest, crashes in its history. Within minutes, the Dow, one of the three most-followed US market indices, plunged 9%, while prices of individual shares became intensely volatile, in some cases fluctuating between tens of dollars and cents in the same second. More than $850bn was wiped off stock values – although by the end of the trading day they had mostly recovered.

What caused the Flash Crash, as it came to be known? Early theories blamed either an error in trading software, or a human at a computer inadvertently selling a large number of shares – the so-called fat-finger hypothesis. Some analysts even claimed the Flash Crash was merely part of the more exaggerated ups and downs we should expect as financial trading becomes more decentralized and complex. But many suspected foul play.

In April 2015, at the request of US prosecutors, Navinder Singh Sarao was arrested at his parents’ semi-detached home in Hounslow, west London, UK. A lone trader, Sarao, then 36, was accused of crafting “spoofing” algorithms that could order thousands of future contracts, only to cancel them at the last minute before the actual purchases went through. By exploiting the resultant dips in markets, he allegedly earned some $40m (£27m) over five years.

High speed; high stakes

Sarao was found guilty of spoofing and wire fraud by a US court earlier this year, but it is still not known whether his actions actually caused the Flash Crash. In fact, based on current financial infrastructure, performing an accurate postmortem on an extreme market event can be nigh-on impossible, because it involves knowing when – precisely when – all the trades took place.

Back in the days when traders called out buys and sells on the bustling floors of stock exchanges, keeping official time records of transactions was hardly a problem. But we now live in an era of automated, high-frequency trading, in which orders are executed in microseconds, if not faster (see “The art of the algorithm”, below). Observers have struggled to keep up. In response to a report by US regulators five months after the Flash Crash, David Leinweber, the director of the Center for Innovative Financial Technology at Lawrence Berkeley National Laboratory in the US, wrote that those same regulators were “running an IT museum”, with totally inadequate resources to forensically analyse modern transactions.

One of the main problems is that of synchronization, and the proof of it. In a financial organization, a trade may be timestamped as having occurred in a certain microsecond; but how does that organization, or indeed a regulator, know that that microsecond is the same as everyone else’s? With the increasing prevalence of atomic clocks, which can keep monthly time to within a fraction of a nanosecond, you might assume microsecond accuracy is child’s play. But even the most precise clock needs to be initially informed of the correct time, and it then needs to transmit that time to anyone who relies on it. Such signalling itself takes time, of course – the question is how much.

Leon Lobo is well equipped to answer this. Since 2011 he has been working at the UK’s National Physical Laboratory (NPL), which in 1955 developed the caesium atomic clock, the first clock proven to be more reliable for timekeeping than the duration of the Earth’s motion around the Sun. The “ticks” of an atomic clock are the oscillations between two specific energy states in an atom; a feedback loop locks the frequency of a light source to that of these electronic oscillations, thereby creating a stable frequency standard.

The art of the algorithm
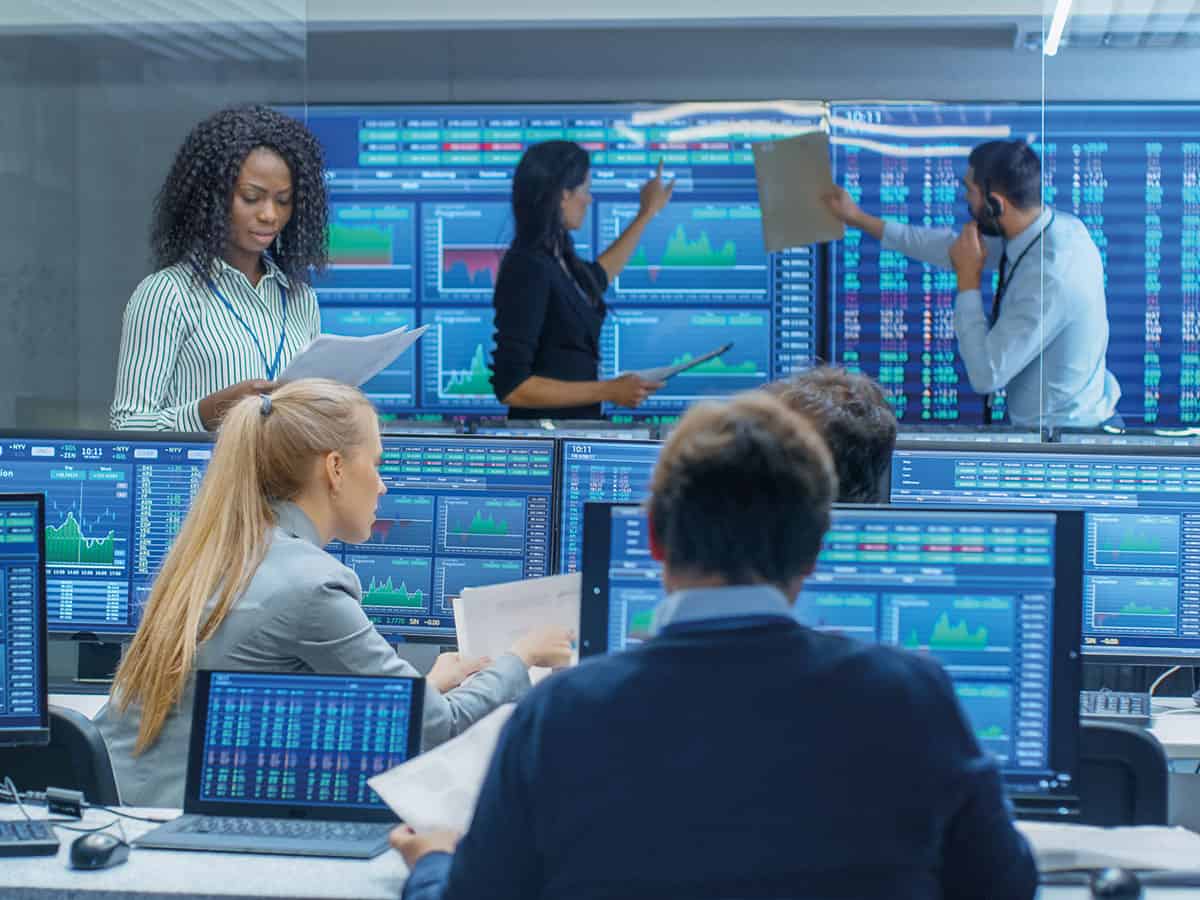
These days, even the most insightful human trader comes with a big flaw: sluggishness. In the amount of time it takes a human to observe a change in the market, decide on the best response and execute an order, a computer can have processed millions of financial transactions. It is no wonder that modern finance has replaced many human operators with algorithmic, high-frequency traders.

For obvious reasons, precisely how various proprietary trading algorithms work is kept secret, but they share similar goals. One is to exploit slightly different prices of commodities in different markets, buying in the cheaper market and then immediately selling in the more expensive market. Such arbitrage is as old as market trading itself, except in this case the price differences are small, while the volumes of transactions are huge. A difference of $0.0001 might not seem like much, but if it can be repeated a million times a second, that equates to $6000 a minute.

Algorithms get predictive, too – they can be designed to expect a commodity to ultimately revert to a mean price, or to a long-term up/down trend, or to some more complex pattern of activity based on an analysis of historical data. Algorithms can even delve deep into company performance figures and assets in an attempt to determine a company’s real value, and therefore whether the market valuation is over- or under-priced.

In general, algorithms are not designed to make rash decisions – moderate gains made often is the name of the game. But they have come in for a lot of criticism. One is that the necessary computing infrastructure can be very expensive, meaning that the rewards go to the big investment companies that can afford it, rather than to smaller companies and lone traders – even if the latter are shrewder. But perhaps more worrying is that when transactions are processed so quickly, it is impossible for humans to oversee they are all being made prudently. When failures occur, they can escalate at lightning speed.

Keepers of time

Leon Lobo of NPL

Based in the Teddington suburb of London, NPL is responsible for disseminating time to the rest of the UK via fibre-optic, Internet, radio and satellite links. Now, with Lobo as the strategic business development manager for time, it is applying the fine craft of synchronization to financial trading. “You can have your own atomic clock, but a clock in itself is just a stable oscillator – a regular tick,” he says. “It doesn’t necessarily give you the correct time. That’s where our expertise comes in.”

Synchronization involves offsetting for time delays, but it is not so simple as dividing the length of the communication route by the speed of the communication. For starters, the communication route may be unreliable. Many of the big financial institutions rely on satellite navigation systems, such as the US’s GPS or Russia’s GLONASS, to synchronize their internal systems with Coordinated Universal Time (UTC), the global time standard. But these are weak signals that are vulnerable to failure, either by solar activity or deliberate jamming. In January 2016 the GPS signals themselves strayed by 13 microseconds for 12 hours, according to the UK time-distribution company Chronos, apparently because they were erroneously fed the wrong time from the ground. The failure triggered system errors in companies and organizations the world over.

The Internet is another option for timing information, but here the length of the communication route is not always the same. For example, a signal could travel more or less directly from the source to the receiver one day; another day, it could be redirected via servers on the other side of the world. Even once it reaches a financial organization, the signal has to find its way to individual computers, which are often spread all over a building. Remember, this is a world in which – rumour has it – traders compete to be closer to their building’s mainframe, to be sure that their decision-making is at no infinitesimal disadvantage.

What happens inside computers is no more reliable. Every time a signal is processed, it is subject to some delay, which may or may not be consistent. Most computers keep time according to their clock rate – a two gigahertz processor, for example, usually executes two billion instructions per second. But modern software has vagaries. Programs written in the Java programming language have “garbage collection” routines, which periodically reclaim memory but can interrupt timestamping in the process. Meanwhile, according to Lobo, anyone whose computer is running older versions of Microsoft Windows could be whole seconds fast or slow relative to UTC.

At the microsecond level, I would say no-one in the City of London has the same time

“You occasionally have incidents called negative deltas, where if I timestamp some data as it leaves and you timestamp it as it arrives, owing to poor synchronization, the arrival time can actually appear to be before the leaving time,” he says. “At the microsecond level, I would say no-one in the City of London has the same time.”

All of which makes the forensics of past market shocks rather tricky. Neil Horlock, a technical architect at the multinational investment bank Credit Suisse, believes ambiguity is the issue. He gives the example of a big investor instructing a broker to offload shares in oil, for no other reason than a new-found concern for the environment. Momentarily before the broker executes this order, another broker also sells his shares in the same oil company. Both sales drive down the market value of the oil company, but the second broker, being ahead of the curve, subsequently re-buys his shares and makes a profit. His timing may have been lucky coincidence. On the other hand, he may have had insider knowledge of the big investor’s forthcoming sale – an illegal practice known as “front running”.

Dirty tricks

This is a simple example: dirty tricks in modern finance can be much more sophisticated. In any case, as Horlock explains, distinguishing guilt from innocence involves reconstructing a precise chronology of events, which can be microseconds apart. “Having better clock synchronization means that, if there is an investigation, [the investigators] can ask for all the logs, to demand proof that that the trading was completely above board,” he says. “If the trades are uncorrelated, they can see that quite often by the timestamps.”

This year, in order to bring more protection to markets, the European Union introduced the second version of its Markets in Financial Instruments Directive (MiFID II), which imposes strict requirements on the accuracy of clock synchronization, in some cases down to 100 microseconds. At NPL, Lobo has developed a solution to help big financial organizations achieve that level of accuracy – and more.

Atomic clock

Rigour is key. Delivered with various industry partners, NPL’s solution involves sending timing information through dedicated fibre optics – as well as channels shared with select other service providers – of known length and proven resiliency. Every piece of hardware along the way is chosen for its deterministic behaviour, so that NPL engineers can calculate with great precision how much delay will be incurred. At the client side, timing software is eschewed in favour of hardware-based, NPL-certified time-protocol units. “We manage the time end to end,” says Lobo.

Every minute, these timing units are “pinged” by NPL to ensure that their time is in sync with its record of UTC. The timing protocol accounts for the basic travel time of the pings, but to account for any unknown latencies, one of NPL’s live caesium atomic clocks is transported to the far end of the fibre, where the actual received signal can be calibrated against UTC. At all times, NPL keeps an atomic clock at a hub away from Teddington, to make sure that the timing of the units is correct in case of a fibre breakage.

Precision and traceability

There are, in fact, two aspects to synchronization. One involves precision, which means choosing hardware that operates as quickly and deterministically as possible. The other aspect is traceability. In other words, Lobo and his colleagues can guarantee that they know the path their timing signal took, and its associated accuracy, every step along the way. “Most important is confidence in the infrastructure,” says Lobo.

Currently, the NPL solution guarantees synchronization to UTC to an accuracy of one microsecond – two orders of magnitude better than that stipulated by MiFID II. As an extra layer of confidence, NPL itself knows the accuracy to yet another order of magnitude (that is, 100 nanoseconds) – Lobo claims they could make it even more accurate, but believes there is no point if the demand is not there. The system has already been supplied to London data centres including Equinix, TeleHouse and Interxion, he says, and foreign organizations are next on the list.

Will a hi-tech solution such as NPL’s become the standard in finance in years to come? Horlock is unsure. “Here’s the thing,” he says. “While better clocks make our business less risky and better regulated, margins across the industry are smaller than they have ever been, and costs are a major factor in selecting any solution. So long as ‘free’ services such as GPS are deemed good enough – something that the European regulators are keen to assure us – then more expensive solutions will have to justify their introduction by demonstrating a return on that investment, such as enabling better analytics.”

One thing is for certain, Horlock says – big financial institutions will have to mitigate against the risks of GPS if they are going to fall in line with MiFID II standards. But there are alternatives to GPS besides NPL’s. Based on technology from the Second World War, eLORAN is a navigation system similar to GPS, using long-wave radio transmitters on the ground rather than up in space. It does not require a fixed communications channel and is cheaper than NPL timekeeping, although it is still ultimately fed by GPS and is not traceable. “Everyone will end up having an alternative to GPS,” Horlock concludes. “Leon’s is a very high-quality alternative, but it comes at a price. And it can only really be delivered to the major financial centres, whereas a lot of us are moving out.”

Lobo counters that an alternative method of timekeeping is of little benefit unless it is calibrated and continuously monitored, to know that it is accurate, stable, resilient and auditable. “The key benefits our solution offers includes end-to-end traceability, audit capability, resiliency, and effectively a trusted time for [a client’s] infrastructure, allowing them to measure internal systems against a stable, accurate reference at the ingress point.”

It is not the first time anyone has had to argue for an improved time standard. The large clock on the former corn exchange in Bristol, UK, where Physics World is published, has two minute-hands: one for “Bristol time”, and one for “London time”, which in the early 19th century was a little over 10 minutes ahead. That was before Bristol’s reluctant adoption of Greenwich Mean Time (GMT) in 1852, five years after its adoption over the rest of Great Britain as a universal time.

GMT made life a lot easier for rail operators of the day, who had until then struggled to coordinate the arrival and departure times of trains in different cities. Lobo believes the NPL system could be just as useful for modern finance. “It’s similar to that unification involving GMT,” he says, “but at the microsecond level.”
Higgs boson seen decaying to two bottom quarks

Physicists working on the ATLAS experiment at CERN have confirmed that the Higgs boson decays to two bottom quarks. The discovery was made by combining data from two runs of the Large Hadron Collider (LHC) and was announced today at the 2018 International Conference on High Energy Physics in Seoul, Korea.

Although this decay channel should account for nearly 60% of all Higgs decays at the LHC, it had proven extremely difficult to spot it amongst the vast number of particles that are produced by proton-proton collisions at the collider.

Predicted in 1964, the Higgs boson was discovered in 2012 at the LHC where it is produced in high-energy proton-proton collisions.

The Higgs boson and its associated field play an essential role in the Standard Model of particle physics. It arises from a symmetry-breaking event that occurred in the very early universe and created a uniform scalar field known as the Higgs field that pervades all space. Elementary particles such as leptons, quarks and the W and Z bosons “acquire” their distinctive masses by virtue of their unique and different couplings to this field.

Couple of quarks

It is this coupling to quarks that allows the Higgs to decay to two bottom quarks – or more precisely, to a bottom quark and an antibottom quark. These quarks immediately create jets of particles, which are then detected as they fly through ATLAS. The problem is that proton collisions in the LHC produce huge numbers of bottom-quark pairs in processes that have nothing to do with the Higgs boson.

In order to pick-out the much smaller Higgs signal, ATLAS physicists first made precise calculations of the expected contributions from other jet-producing processes. Then they showed that ATLAS has measured an excess number of jets at energies associated with the decay of a Higgs boson to two bottom quarks. Using data from the second run of the LHC – which involved 13 TeV collisions – the team detected the bottom quark decay channel at a statistical significance of 4.9σ.

This is just shy of the 5σ required for a discovery in particle physics, so they tried to bolster their statistics by looking at data from 7 TeV collisions that were collected in the first run of the LHC. Using this information, the ATLAS team was able to boost the significance to 5.4σ. Furthermore, the observed decay rate is in line with that predicted by the Standard Model of particle physics.

When combined with observations of the Higgs boson decaying to pairs of photons and Z bosons, physicists can make a 5.3σ observation of the co-production of a Higgs boson and a weak boson (either Z or W) at the LHC. This means that all four primary modes of Higgs production have been observed at the LHC at a statistical significance of at least 5σ.

Boron arsenide crystals could cool computer chips

Unwanted heat is a big problem in modern electronic systems that are based on conventional silicon circuits – and the problem is getting worse as devices become ever smaller and more sophisticated. Carrying away this heat is critical and researchers are developing efficient heat-conducting materials to meet this challenge. Three teams from around the US are now saying that crystals of the semiconductor boron arsenide (BAs) show promise in this context and they have measured a high thermal conductivity of more than 1000 W/m/K at room temperature for this material. This value is three times higher than that of copper or silicon carbide, two materials that are routinely employed for spreading heat in electronics.

The value we measured (on crystal sizes of about 0.5 mm) is surpassed only by diamond and the basal plane value of graphite,” says Bing Lv of the University of Texas (UT) at Dallas, who led one of the research groups together with David Cahill of the University of Illinois at Urbana-Champaign.

The other two groups, led by Zhifeng Ren of the University of Houston (UH) and Yongjie Hu of the University of California at Los Angeles (UCLA) measured local thermal conductivities of 1000 W/m/K and 1300 W/m/K respectively, with Ren’s group also measuring a value of 900W/mK on large crystals of about 4 mm x 2 mm x 1 mm.

“The UH/UT Austin paper reported transport data of about 900 W/m/K across a length of at least 2 mm using Raman spectroscopy across the same distance and TDTR, finding about 1000 W/m/K locally on a spot less than 20 microns,” explains Ren.

Predicted thermal conductivity as high as that of diamond

Researchers predicted that BAs should have a theoretical thermal conductivity as high as that of diamond (2200 W/m/K), which is the best heat conductor known, back in 2013. However, to reach this high value, high quality crystals are needed since defects and impurities dramatically degrade thermal properties.

Lv and colleagues, then at the University of Houston, made BAs crystals in 2015 but the material only had a thermal conductivity of 200 W/m/K. Since then the researchers have optimized their crystal-growing process using a modified version of a technique called chemical vapour transport. Here, they place boron and arsenic in a chamber containing hot and cold areas and the two elements are then transported (by different chemicals) from the hot end to the cooler end, where they combine to form crystals.

Heat in crystals is carried by phonons (which are vibrations of the crystal lattice). Lv explains that the large differences in the masses of boron and arsenic atoms creates a big frequency gap between acoustic and optic phonons, which allow the phonons to travel more efficiently through the crystals. The researchers measured the thermal conductivity of their BAs using a method called time-domain thermoreflectance or TDTR, which was developed in Cahill’s lab in Illinois.

Ren’s team also used chemical vapour deposition to make their large crystals (measuring 4 mm x 2 mm x 1 mm, as mentioned). These are a significant improvement on the ones they previously made, which were less than 500 microns across and were thus too small for certain measurement techniques. The researchers also measured the thermal conductivity of their BAs using TDTR as well as some other techinques.

Hu and colleagues, for their part, made BAs single crystals more than 2 mm in size with undetectable defects and measured their thermal conductivity using the TDTR technique. Their spectroscopy study combined with atomistic calculations reveal that the phonon vibration spectrum of BAs allows for “very long phonon mean free paths and strong high-order anharmonicity through a four- phonon process”.

First known semiconductor with ultrahigh thermal conductivity

The result from all three groups mean that BAs is the first known semiconductor with a bandgap comparable to silicon of around 1.5 eV to have an ultrahigh thermal conductivity and it could be a revolutionary thermal management material, according to the researchers.

And that is not all: “There is also a close match between the thermal expansion coefficients of BAs and silicon. This is a non-negligible advantage for minimizing thermal stresses and reducing the need for thermal interface materials when incorporating it into conventional semiconducting devices,” says Lv.

“Our team is now busy looking into other processes to improve the yield of this material for large-scale applications,” he tells Physics World. “We are also trying to control the types of defects that are present in these crystals and better understand how they affect its thermal conductivity.”

The research is detailed in three papers in Science.

Rising sea levels could cost the world $14 trillion a year by 2100

Failure to meet the United Nations’ 2 ºC warming limits will lead to sea level rise and dire global economic consequences, new research has warned.

Published today in Environmental Research Letters, a study led by the UK National Oceanographic Centre (NOC) found flooding from rising sea levels could cost $14 trillion worldwide annually by 2100, if the target of holding global temperatures below 2 °C above pre-industrial levels is missed.

The researchers also found that upper-middle income countries such as China would see the largest increase in flood costs, whereas the highest income countries would suffer the least, thanks to existing high levels of protection infrastructure.

Svetlana Jevrejeva, from the NOC, is the study’s lead author. She said: “More than 600 million people live in low-elevation coastal areas, less than 10 metres above sea level. In a warming climate, global sea level will rise due to melting of land-based glaciers and ice sheets, and from the thermal expansion of ocean waters. So, sea level rise is one of the most damaging aspects of our warming climate.”

Sea level projections exist for emissions scenarios and socio-economic scenarios. However, there are no scenarios covering limiting warming below the 2 °C and 1.5 °C targets during the entire 21st century and beyond.

The study team explored the pace and consequences of global and regional sea level rise with restricted warming of 1.5 ºC and 2 ºC, and compared them to sea level projections with unmitigated warming following emissions scenario Representative Concentration Pathway (RCP) 8.5.

Using World Bank income groups (high, upper middle, lower middle and low income countries), they then assessed the impact of sea level rise in coastal areas from a global perspective, and for some individual countries using the Dynamic Interactive Vulnerability Assessment modelling framework.

Jevrejeva said: “We found that with a temperature rise trajectory of 1.5 °C, by 2100 the median sea level will have risen by 0.52 m. But, if the 2 °C target is missed, we will see a median sea level rise of 0.86 m, and a worst-case rise of 1.8 m.

“If warming is not mitigated and follows the RCP8.5 sea level rise projections, the global annual flood costs without adaptation will increase to $14 trillion per year for a median sea level rise of 0.86 m, and up to $27 trillion per year for 1.8 m. This would account for 2.8% of global GDP in 2100.”

The projected difference in coastal sea levels is also likely to mean tropical areas will see extreme sea levels more often.

“These extreme sea levels will have a negative effect on the economies of developing coastal nations, and the habitability of low-lying coastlines,” said Jevrejeva. “Small, low-lying island nations such as the Maldives will be very easily affected, and the pressures on their natural resources and environmental will become even greater.

“These results place further emphasis on putting even greater efforts into mitigating rising global temperatures.”

Thermal imaging monitors radiotherapy efficacy

Thermal images

The ability to assess the impact of radiation on malignant tumours during a course of radiotherapy could help improve its effectiveness for individual patients. Based on tumour response, physicians could modify the treatment regimen, dose and radiation field accordingly.

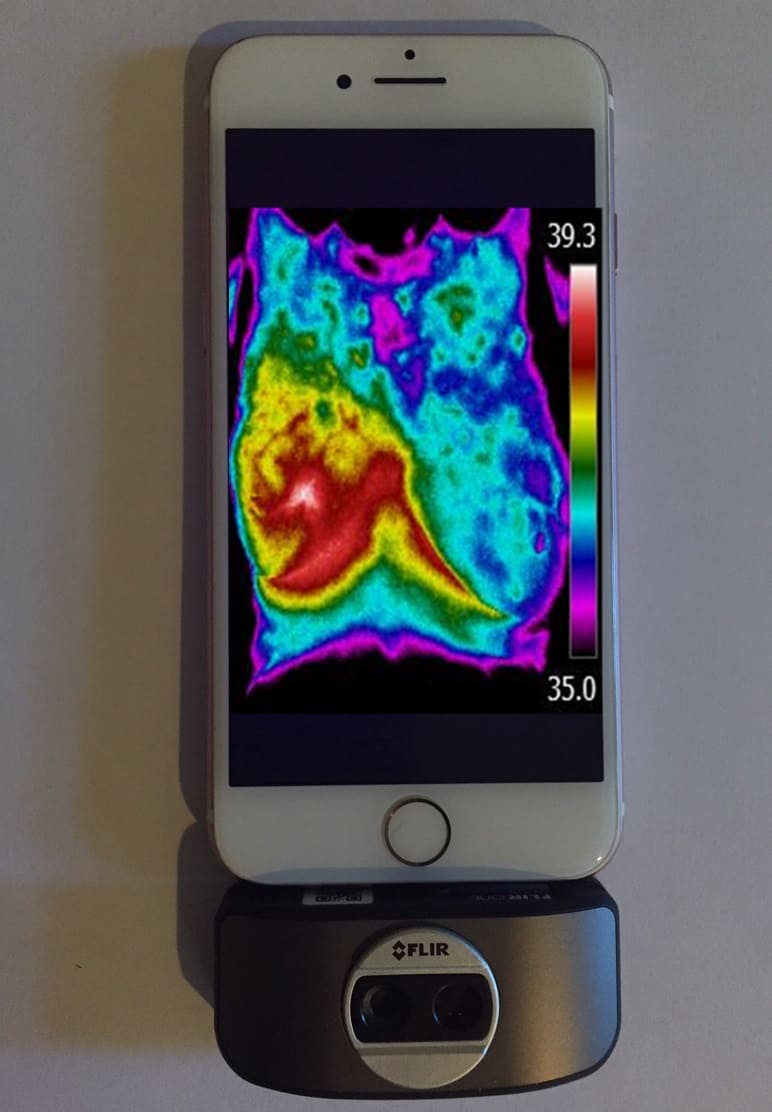
Israeli researchers have now demonstrated that thermography may provide a viable radiotherapy monitoring tool for such treatment optimization. They have developed a method to detect tumours in a thermal image and estimate changes in tumour and vasculature during radiotherapy, validating this in a study of six patients with advanced breast cancer (J. Biomed. Opt. 23 058001).

Thermography had been rejected as a breast cancer detection tool, due to its suboptimal sensitivity and specificity. However, for an already detected tumour undergoing radiation or chemotherapy, it could prove a highly effective monitoring tool, when incorporating algorithms developed by the research team.

The multi-institutional team had conducted research on thermal imaging to understand tumour aggressiveness in animal models. They hypothesized that because malignant tumours are characterized by abnormal metabolic and perfusion rates, they will generate a different temperature distribution pattern compared with healthy tissue. By measuring skin temperature maps at the tumour location before and during treatment, the reaction of a tumour to radiotherapy can be measured.

Researchers

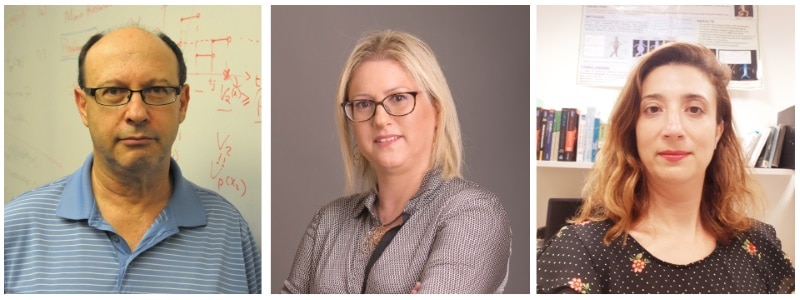
Israel Gannot from Tel-Aviv University and co-authors developed a four-step algorithm to analyse the thermal images. First, images were converted from colour to grey scale and a fixed temperature range of 7°C set for all images, to enable comparison of the entropy (which characterizes the homogeneity of the image) in different images. Images were filtered using a Frangi filter designed to emphasize tubular structures. This filter highlighted blobs of heat (the malignant tumour) and long, narrow tubular objects (the blood vessel network). Images were enlarged sevenfold to observe local temperature changes in the blood vessels.

In the final step, feature extraction, the algorithm calculates entropy in the cropped thermal image of the tumour area and in the filtered tumour image. It then estimates changes in tumour regularity and vasculature shape during radiotherapy.

Patient imaging

The six patients were women with stage IV breast cancer and distant metastatic disease. None had undergone surgical resection of their tumours, which had a diameter larger than 1 cm at a depth of less than 1 cm. All patients received 15 radiation fractions of 3 Gy, administered over three weeks.

The patients underwent thermal imaging before each radiotherapy session and a day after the end of the session. Room temperature and humidity were controlled during image acquisition and fluorescent lights were turned off. The thermal camera, positioned 1 m from the patient, acquired images containing either 320×256 or 320×240 pixels.

The authors report that entropy was reduced in the tumour areas, for all patients, during radiation treatment. They described the appearance of the tumour vasculature as “a crab with many arms”. To quantify changes in the shape of vascular networks, they converted the images into binary images and counted the number of objects before and after radiotherapy. They saw a reduction in the number of objects, indicating a reduction in the vessels supplying nutrients to the tumour.

Expanding applications

The researchers selected breast cancer for the initial research because co-researcher Merav Ben-David, from Sheba Medical Center, specializes in breast cancer treatment. They are now looking at additional applications, such as the treatment of cervical cancer and head-and-neck cancer.

“We are collecting more data to run big data statistics,” Gannot tells Physics World. “We are also starting to implement the use of this technology as a tool for early warning of breast cancer by women at their home, using a thermal camera attached to a cell phone with our algorithms implemented in the smartphone app. This is intended for use in addition to mammography. It could fill the time span between mammography examinations when many cancers develop.”

In future research, the authors are planning to use thermal imaging devices with multiple angles and perform real-time analysis. They are planning larger studies to evaluate the efficacy of thermography to monitor radiotherapy, chemotherapy and immunotherapy treatments.

Neural networks, explained

What are neural networks?

Artificial neural networks are a form of machine-learning algorithm with a structure roughly based on that of the human brain. Like other kinds of machine-­learning algorithms, they can solve problems through trial and error without being explicitly programmed with rules to follow. They’re often called “artificial intelligence” (AI), and although they are are much less advanced than science-fiction AIs, they can control self-driving cars, deliver ads, recognize faces, translate texts and even help artists design new paintings – or create bizarre new paint colours with names like “sudden pine” and “sting grey”.

How do neural networks work?

Neural networks were first developed in the 1950s to test theories about the way that interconnected neurons in the human brain store information and react to input data. As in the brain, the output of an artificial neural network depends on the strength of the connections between its virtual neurons – except in this case, the “neurons” are not actual cells, but connected modules of a computer program. When the virtual neurons are connected in several layers, this is known as deep learning.

A learning process tunes these connection strengths via trial and error, attempting to maximize the neural network’s performance at solving some problem. The goal might be to match input data and make predictions about new data the network hasn’t seen before (supervised learning), or maximizing a “reward” function to discover new solutions to a problem (reinforcement learning). The architecture of a neural network, including the number and arrangement of its neurons, or the division of labour between specialized sub-modules, is usually tailored to each problem.

Why have I heard so much about them?

The growing availability of cheap cloud computing and graphics processing units (GPUs) are key factors behind the rise of neural networks, making them both more powerful and more accessible. The availability of large amounts of new training data, such as databases of labelled medical images, satellite images or customer browsing histories, has also helped boost the power of neural networks. In addition, the proliferation of new open-source tools such as Tensorflow, Keras and Torch has helped make neural networks accessible to programmers and non-programmers from a variety of fields. Finally, success begets success: as the value of neural networks in commercial applications becomes more apparent, developers have sought new ways of exploiting their capabilities – including using them to aid scientific research.

What are neural networks good at?

They’re great at matching patterns and finding subtle trends in highly multivariate data. Crucially, they make progress towards their goal even if the programmer doesn’t know how to solve the problem ahead of time. This is useful for problems with solutions that are complex or poorly understood. In image recognition, for example, the programmer may not be able to write down all the rules for determining whether a given image contains a cat, but given enough examples, a neural network can determine for itself what the important features are. Similarly, a neural network can learn to identify the signature of a planetary transit without being told which features are important. All it needs is a set of sample starlight curves that correspond to planetary transits, and another set of light curves that do not. This makes neural networks an unusually flexible tool, and the fact that neural network frameworks come in “flavours” specialized for tasks such as classifying data, making predictions, and designing devices and systems only adds to their flexibility.

Neural networks are also particularly well suited for projects that generate too much data to be easily sorted or stored, especially if the occasional mistake can be tolerated. Often, they’re used to flag events of interest for human review. In a 2017 study of exoplanet candidates, for example, software engineer Christopher Shallue of Google Brain and astronomer Andrew Vanderburg of the University of Texas at Austin used neural networks to search lists of candidate light curves for those most likely to correspond to true planetary transits. The results enabled them to reduce the number of candidates by more than an order of magnitude. In another astronomy application, a team from the Observatoire de Sauverny in Switzerland used a neural network to examine huge datasets of galaxy images, looking for those that might contain gravitational lenses. Other groups have used neural network classifiers to identify rare, interesting, collision events in data from the Large Hadron Collider at CERN.

Another kind of neural network can generate predictions based on input data. Networks of this type have, for example, been used to predict the absorption spectrum of a nanoparticle based on its structure, after being given examples of other nanoparticles and their absorption spectra. Such networks are being used in chemistry and drug discovery as well, for example to predict the binding affinities of proteins and ligands based on their structures.

In combination with a technique called reinforcement learning, neural networks can also be used to solve design problems. In reinforcement learning, rather than trying to imitate a list of examples, a neural network tries to maximize the value of a reward function. For example, a neural network controlling the limbs of a robot might adjust its own connections in a way that, through trial and error, ends up maximizing the robot’s horizontal speed. Another algorithm might control the spectral phase of an ultrashort laser pulse, trying to maximize the ratio of two fragmentation products generated when the laser pulse hits a certain molecule.

Sounds great! What’s the catch?

Because neural network algorithms solve problems in whatever ways they can manage, they sometimes arrive at solutions that aren’t particularly useful – and it can take an expert to detect how and where they have gone wrong. Hence, they are not a substitute for a good understanding of the problem. Below are a few possible pitfalls.

Black-box solutions
In general, neural networks (and other machine-learning algorithms) don’t explain how they arrived at their solutions. This can make it harder to understand whether these solutions are exploiting new physics, or are based on a bug or some simple effect that has been overlooked. Machine-learning research is full of anecdotes of algorithms arriving at seemingly perfect solutions that turn out to stem from problems with the algorithm itself. For example, in 2013 researchers at MIT Lincoln Labs tested a computer program that was supposed to learn to sort a list of numbers. It achieved a perfect score, but then the programmers discovered that it had done so by deleting the list. (According to the algorithm’s reward function, a deleted list yielded a perfect score because, technically, the list was no longer unsorted.) In another example, a machine-learning algorithm was used to shape laser pulses to selectively fragment molecules. Although the resulting laser pulses were very complex, in many cases the dominant effect turned out to be the overall change in laser pulse intensity rather than the pulse’s complex structure.

To combat this problem, researchers are working on algorithmic interpretability, developing techniques for discovering how algorithms make their decisions. For example, some image-recognition algorithms can now report which pixels were important in making their decisions, and individual layers of neurons can report which kinds of features (like a dog’s floppy ear) they have learned to find.

Solving the wrong problem
Users of neural networks also have to make sure their algorithm has actually solved the correct problem. Otherwise, undetected biases in the input datasets may produce unintended results. For example, Roberto Novoa, a clinical dermatologist at Stanford University in the US, has described a time when he and his colleagues designed an algorithm to recognize skin cancer – only to discover that they’d accidentally designed a ruler detector instead, because the largest tumours had been photographed with rulers next to them for scale. Another group, this time at the University of Washington, demonstrated a deliberately bad algorithm that was, in theory, supposed to classify husky dogs and wolves, but actually functioned as a snow detector: they’d trained their algorithm with a dataset in which most of the wolf pictures had snowy backgrounds.

Careful review of an algorithm’s results by human experts can help detect and correct these problems. For example, the abovementioned study on star transits flagged suspected exoplanets for human review, rather than simply generating a “We found a new planet!” press release. This was fortunate because most of the “exoplanets” turned out to be artefacts that the algorithm had not learned to detect.

Class imbalances and overfitting
When researchers try to train data-­classifying machine-learning algorithms, they often run into a problem called class imbalance. This means that they have many more training examples of one data category than others, which is often the case for studies that are searching for rare events. The result of class imbalance can be an algorithm that doesn’t have enough data to make progress, yet “thinks” it is doing splendidly. To cite one recently reported example from the solar storm team at NASA’s Frontier Development Lab, if solar flares are very rare in the training dataset, the algorithm can achieve near-perfect accuracy by predicting zero solar flares. This is also a problem for planetary transit studies because true planetary transits are relatively rare.

To address class imbalance, the rule of thumb is to include roughly equal numbers of training examples in each category. Data-augmentation techniques can help with this. However, using data augmentation, or simulated data, can lead to another problem: overfitting. This is one of the most persistent problems with neural networks. In short, the algorithm learns to match its training data very well, but isn’t able to generalize to new data. One likely example is the Google Flu algorithm, which made headlines in the early 2010s for its ability to anticipate flu outbreaks by tracking how often people searched for information on flu symptoms. However, as new data started to accumulate, Google Flu turned out to be much less accurate, and its reported success is now thought to be due to overfitting. In another example, an algorithm was supposed to evolve a circuit that could produce an oscillating signal; instead, researchers at the University of Sussex and Hewlett-Packard Labs in Bristol, UK, found that it evolved a radio that could pick up an oscillating signal from nearby computers. This is a clear example of overfitting because the circuit would only have worked in its original lab environment.

The way to detect overfitting is to test the model against data and situations it hasn’t seen. This is especially important if the model was trained on simulated data (like simulated images of gravitational lenses, or simulated physics), to make sure the model hasn’t learned to use artefacts of the simulation.

In conclusion

Neural networks can be a very useful tool, but users must be careful not to trust them blindly. Their impressive abilities are a complement to, rather than a substitute for, critical thinking and human expertise.

Ultracold atoms behave like a ferrofluid, say physicists

Collective spin oscillations have been spotted for the first time in an ultracold atomic gas. The discovery was made by Bruno Laburthe-Tolra and colleagues at the University of Paris 13.

Their experiment involves cooling about 40,000 chromium atoms to 400 nK, where the all the atoms condense into a single quantum state called a Bose-Einstein condensate (BEC). All of the atoms are in their lowest energy spin state, which has a non-zero spin magnetic moment.

The BEC is the shape of a rugby ball and is confined in an optical track. The team’s experiment begins with the chromium spins aligned in a direction perpendicular to the long axis of the BEC. Then, a magnetic field gradient is applied along the long axis of the BEC, which creates an effective coupling between the spins which encourages a spin to point in the same direction as its neighbours.

Tilted spins

Then, a radio-frequency pulse is fired at the BEC, which applies a torque to the spins causing them to rotate. The team then measured the directions of the spins as they evolved over about 40 ms. In the absence of a coupling, the spins should rotate independently and the alignment would be lost.

Instead, the team found that the spins try to maintain their alignment and rotate collectively in a spin wave. Such waves have been seen in solids and liquids – where very short distances between neighbouring atoms can result in strong spin coupling – but this is the first time that the behaviour has been observed in a dilute quantum gas. Indeed, calculations done by Laburthe-Tolra and colleagues suggest that the system behaves very much like a ferrofluid – a liquid that becomes strongly magnetized when placed in a magnetic field.

The research is described in Physical Review Letters.

New app scopes-out neutrinos, hairstyle inspired by the physicist’s favourite shrimp, tracking euro coins

Described as a “new app to demystify the neutrino,” NeutrinoScope has just been launched by Cambridge Consultants and physicists at the UK’s Durham University. It can be downloaded free of charge from iTunes and provides key facts about the elusive particles – including how they are produced in both nuclear reactors and bananas. Augmented reality is used throughout to illustrate, for example, the neutrino flux through a user’s local environment.

This week we published a story about the physicist’s favourite crustacean, the mantis shrimp. This amazing creature has an incredibly strong club that it can use to smash its way out of an aquarium. It can also see circularly-polarized light and some species have spectacular coloration. Now, Bristol hair salon JamesB  offers an amazing hairstyle reminiscent of the shrimp’s visual display.

Today more than 20 countries mint their own euro coins. If you receive change in Germany, for example, most of the coins will usually be German – but there will probably be a French, Italian or other nationality in the mix. In “Euro-mixing in Slovenia: ten years later” Mojca Čepič and Katarina Susman of the University of Ljubljana look at how foreign euro coins have mixed into the local currency since Slovenia joined the Eurozone in 2007. They found that the percentage of Slovenian coins in circulation stabilized at 28%, which is much higher than their initial predication.

Double-sided microfluidic blood oxygenator makes artificial placenta

Preterm births account for about 10% of all births in the US and according to the World Health Organization, this number is increasing rapidly. The survival rate for babies with a gestational age of 28 weeks or less is lower than 50% with respiratory disease syndrome being the second major cause of death. This is because lungs are among the last organs to fully develop. One of the main challenges here is to deliver oxygen to the new-borns using external devices, such as mechanical pumps, until their lungs are fully formed, but these ventilators can cause serious problems in themselves.

Researchers at McMaster University in Canada led by P. Ravi Selvaganapathy and Paracelsus Medical University in Germany led by Christoph Fusch have now developed a passive lung device that is pumped by the baby’s own heart (in which the arterio-venous pressure differential is between just 20 and 60 mmHg). Such a device is known as an “artificial placenta” and consists of microchannels that efficiently exchange oxygen between the blood and outside air. Such a device would be connected to the umbilical cord of the new-born.

Although the concept itself is not new, the design developed by Selvaganapathy and colleagues makes use of both sides of the microchannel network for gas exchange (as opposed to just one side as in previous devices). This significantly increases the surface area to volume ratio of the device.

343% better in terms of oxygen transfer

The highest-performing “double-sided single oxygenator units” (dsSOUs) that the researchers made were about 343% better in terms of oxygen transfer compared to single-sided SOUs with the same height. They used their design to make a prototype containing a gas exchange membrane with a stainless-steel reinforced thin (50-micron-thick) PDMS layer on the microchannel network. This design was based on a previous one developed in their lab (Biomicrofluidics 12 014107).

In the present work, they succeeded in incorporating a slightly thicker (150-micron) steel reinforced membrane on the other side of the blood channels to increase gas exchange. The new fabrication process means a 100% increase in the surface area for gas exchange while continuing to mimic the placenta by ensuring that the priming volume (how much blood is removed at a time for oxygenation) remains low.

“The key innovation here is developing a large-area microfluidic device,” says Selvaganapathy. “You want it to be microfluidic because a 1-kg baby, for example, might only have 100 ml of blood. You want a device to use only a one-tenth of that volume at a time.”

Meeting 30% of the oxygenation needs of a preterm neonate

The team has already produced an optimized oxygenator to build a lung assist device (LAD) that could meet 30% of the oxygenation needs of a preterm neonate weighing between 1 and 2 kg. The LAD provides an oxygen uptake of 0.78-2.86 ml/min, which correspond to an increase in oxygen saturation from around 57 to 100% in a pure oxygen environment.

Reporting on their work in Biomicrofluidics 12 044101, the researchers say that the design could be improved by coating the surface of the dsSOUs with antithrombin-heparin or polyethylene glycol to improve the anticoagulation properties of PDMS surfaces, which are in contact with blood. “Finally, new designs that have higher gas exchange can be used to provide the sufficient oxygenation in ambient air,” they write.

Jeffrey Borenstein of the Charles Stark Draper Laboratory in Cambridge, Massachusetts, who was not involved in this work says that this new study “targets an extremely exciting and promising opportunity in artificial organs research, using microfluidics technology to overcome many of the current limitations of respiratory assist devices.

“Selvaganapathy and colleagues’ advance points to microfluidics as a means to reduce the incidence of clotting, miniaturize the device, and potentially operate the system on room air to enable portable and wearable systems,” he tells Physics World.

Record-breaking entanglement uses photon polarization, position and orbital angular momentum

Physicists in China have fully entangled 18 qubits by exploiting the polarization, spatial position and orbital angular momentum of six photons. By developing very stable optical components to carry out technically demanding quantum logic operations, the researchers generated more combinations of quantum states at the same time than ever before – over a quarter of a million. They say that their research creates a “new and versatile platform” for quantum information processing.

Hans Bachor of the Australian National University in Canberra describes the work as a “true tour de force” in photon entanglement. “This team has amazing technology and patience,” he says, having been able to generate entangled pairs of photons “significantly” faster and more efficiently than in the past.

The decades-old dream of building a quantum-mechanical device that can outperform classical computers relies on the principle of superposition. Whereas classical bits exist as either a “0” or a “1” at any point in time, quantum bits, or “qubits” can take on both values simultaneously. Combining many qubits, in principle, leads to an exponential increase in computing power.

Physicists are now working on several different technologies to boost the qubit count as high as possible. Last year, researchers at the University of Maryland built a basic kind of quantum computer known as a quantum simulator consisting of 53 qubits made from trapped ytterbium ions. And in March, Google announced that it had built a 72-qubit superconducting processor based on the design of an earlier linear array of nine qubits.

Control and readout

However, quantity is not everything, according to Chao-Yang Lu of the University of Science and Technology of China (USTC) in Hefei. He says it is also crucial to individually control and readout each qubit, as well as having a way of hooking up all of the qubits together using the phenomenon of entanglement. Described by Einstein as “spooky action at a distance”, entanglement is what enables multiple qubits – each held in a superposition of two states – to yield the exponential performance boost.

Maximizing the benefits of entanglement involves not only increasing the number of entangled particles as far as possible but also raising their “degrees of freedom” – the number of properties of each particle that can be exploited to carry information. Three years ago, Lu’s was part of Jian-Wei Pan’s group at USTC, which entangled and teleport two degrees of freedom – spin and orbital angular momentum (OAM) – from one photon to another. In the latest work, they have gone one better and have entangled a photon’s spatial information.

The team begin by firing ultraviolet laser pulses at three non-linear crystals lined up one after another. This generates three pairs of photons entangled via polarization. They then use two polarizing beam splitters to combine the photons so each particle is entangled with every other, before sending each photon through an additional beam splitter and two spiral phase plates. This entangles the photons spatially and via their OAM, respectively. Finally, they measure each of the three degrees of freedom in turn. The last and most difficult of these measurements – the OAM – is achieved by using two consecutive controlled-NOT gates to transfer this property to the polarization, which, the researchers say, “can be conveniently and efficiently read out”.

Significant technical hurdle

Lu says that a significant technical hurdle was operating the 30 single-photon interferometers – one for the spatial measurement and four for the OAM of each photon – with sub-wavelength stability. This they did by specially designing the beam splitter and combiner of each interferometer and gluing them to a glass plate, which says Lu, isolated the set-up from temperature fluctuations and mechanical vibrations. The researchers also had to find a way of simultaneously recording all the combinations of the 18 qubits – of which there were 262,144 (218). To do this, they brought together 48 single-photon counters and a home-made counting system with 48 channels (being 23 channels per photon).

By successfully recording all combinations at the same time, Pan and colleagues beat the previous record of 14 fully-entangled trapped-ion qubits reported by Rainer Blatt and colleagues at the University of Innsbruck in 2011. Among possible applications of the new work, Lu says it could finally allow demonstration of the “surface code” developed in 2012 for error correction – a vital task in a practical quantum computer. Implementing this code requires very precise control of many qubits – and in particular, the ability to entangle them all.

Bachor says that the latest work represents a “great step” in showing the advantages of quantum technology over conventional computing. He believes that single-photon technology could play an important role in quantum cryptography and in ferrying data between processors within quantum computers. But he reckons that other technologies – perhaps trapped ions, semiconductor or superconducting qubits – are more likely to yield the first roughly 50-qubit computer capable of demonstrating major advantages over classical devices in executing highly-tailored algorithms. As to when that might happen, “a number of years’ time” is the most he will venture. “I won’t make a prediction,” he says.

The research is described in Physical Review Letters.

Copyright © 2026 by IOP Publishing Ltd and individual contributors