Marine sprawl could harm ecosystems

You’ve heard of “urban sprawl” but have you heard of “marine sprawl”? From oil platforms to ports, and offshore wind turbines to sea-walls, the world’s coastal environment is becoming cluttered with man-made infrastructure. New research suggests that marine sprawl may have serious ecological and economic consequences.

Globally, harbour space is growing at 3.7% per year, and offshore wind energy is expanding by nearly 30% per year. From an underwater perspective a plethora of new surfaces is appearing in shallow marine environments. For some species this represents a vast increase in comfortable new homes. For example, recent research has shown that the increase in gas platforms in the Adriatic Sea over the last 50 years has led to a massive rise in moon jellyfish numbers, whose larvae like to situate themselves on overhanging surfaces. But how is this marine sprawl affecting marine ecosystems as a whole?

Mariana Mayer-Pinto from the University of New South Wales, Australia, and her colleagues have assessed the wider impacts of marine sprawl by measuring aspects of ecosystem health such as productivity and filtration rates in one of the largest urbanised estuaries in the world: Sydney Harbour. At 9 different locations, including both natural and man-made habitats, the scientists photographed and collected all organisms within a 10 cm-quadrant. They also measured the filtration rate of oysters in 12 locations, and scraped clean a surface and returned six months later to see how quickly it was recolonised.

In total the team sampled a staggering 16,361 specimens from 112 taxa, discovering significant differences in the structure of intertidal ecosystems in natural and artificial habitats. Natural rocky shores were far more biodiverse, with 26 taxa – approximately one-third of the total found there – unique to the habitat. In particular, the researchers found that rocky shores have 40% more grazers than seawalls, and 70% more grazers than pilings.

Meanwhile, scavengers were around eight times more prolific on seawalls, compared to pilings or rocky habitats, and algae were more diverse on seawalls and rocky shores than on pilings. Oysters were more abundant on pilings than rocky shores, but they were also smaller, perhaps due to regular cleaning of the artificial structures preventing oysters from growing to full size. Surprisingly, filtration rates were similar for oysters in either habitat.

The decrease in diversity observed on manmade habitats supports previous findings, and confirms that manmade habitats alter the balance of ecosystems. “Because these structures tend to be readily colonised by a range of animals and algae, people believe they are surrogates of the natural habitats,” said Mayer-Pinto. “Previous work has shown that they can increase the number of invasive species, which in turn may have serious ecological and economic consequences.”

In addition, the infrastructure itself often displaces a valuable soft-sediment habitat. “These soft-sediment habitats, although often overlooked, provide important services such as nutrient cycling, clean water and carbon storage,” said Mayer-Pinto.

Much more work remains to be done to fully understand the impact of marine sprawl, but it’s clear that marine infrastructure is altering the balance of ecosystems, and that this may have negative consequences.

Mayer-Pinto and colleagues published their results in Environmental Research Letters (ERL) .


‘Nanowood’ makes a super thermal insulator

A new material dubbed nanowood made from aligned nanocellulose fibres could be used to thermally insulate buildings – both residential and commercial – to make them more energy efficient. The material, which is also lightweight and mechanically strong, is easy to fabricate using a simple chemical treatment. It contains naturally aligned cellulose nanofibrils, which makes it anisotropic – that is, it conducts heat more efficiently along the direction of the fibres, which reduces local heat build-up in the structure.

“Our wood-based material boasts a desirable mix of super thermal insulation, good mechanical strength, low mass density and cost-effectiveness,” explains team leader Liangbing Hu of the University of Maryland in the US. “Such a combination has never been realized before.”

The researchers made their nanowood using a chemical process to remove inter-lignin and hemicellulose to preserve only the cellulose component of their wood sample. The lignin removal step is compatible with processes used in the paper-making industry, stresses Hu, which means that it could easily be adapted to existing industry infrastructures.

Naturally anisotropic

Since it is derived from wood (which has a naturally anisotropic structure), the nanowood is anisotropic too. The nanocellulose fibrils in the material line up in one direction during the chemical treatment, allowing heat to travel more efficiently along the nanofibril direction. Indeed, Hu and colleagues measured a thermal conductivity of 0.03 W/mK in the transverse direction (perpendicular to the nanofibrils) and a roughly two times higher thermal conductivity of 0.06 W/mk in the axial direction. This prevents local overheating from accumulated thermal energy, something that is not possible in isotropic thermal insulators, say the researchers.

The mechanical strength of the nanowood is 50 times higher than cellulose foam and more than 30 times higher than the most commonly employed thermal insulation materials, such as silica and polymer aerogels, Styrofoam and wool. This high strength comes thanks to effective bonding between the aligned cellulose nanofibrils, which have a compressive strength of 13 MPa in the axial direction and 20 MPa in the transverse direction at 75% strain.

Towards commercialization

It is also very light, with an overall mass density as low as 0.13 g/cm3, says Hu, and is breathable, which means that it can be used indoors.

“Finally, the nanowood can effectively reject solar thermal energy (it reflects 95% of all solar spectrum wavelengths),” he tells nanotechweb.org.

As well as being used to thermally insulate buildings, it might also find use in a variety of other heat management contexts, such as in electrical, optical and space applications in which heat transfer and waste heat transfer needs to be tightly regulated, he adds.

The researchers, reporting their work in Science Advances DOI: 10.1126/sciadv.aar3724, say that a UMD spinoff company, Inventwood LLC, is now commercializing the technology.

How did complex carbon-based nanostructures form in space?

How did complex carbon-based compounds form in in the Universe, and in particular in our galaxy? New experiments that retrace the synthesis of polycyclic aromatic hydrocarbons (PAHs), such as pyrene, could help answer this question. The work could also help explain how more complex PAHs, and eventually 2D graphene-type structures formed from pyrene thanks to molecular mass growth.

PAHs (which are organic molecules comprising fused benzene rings) along with alkylated (methyl, ethyl), ionized, (de)hydrogenated and protonated counterparts may make up 20% of all the carbon in our galaxy. PAHs have been detected in some carbonaceous meteorites such as Allende and Murchison, which suggests that they come from deep space. Thanks to carbon-13/carbon-12 and deuterium/hydrogen isotopic analyses, researchers believe that molecular mass growth processes allow higher molecular weight PAHs to form from lower-weight ones. The main astrochemical reactions at play here might be similar to those occurring in combustion processes in vehicle engines and in the formation of soot particles.

To find out how PAHs develop in space, researchers led by Alexander Mebel at Florida International University and Ralf Kaiser of the University of Hawaii, synthesized these molecules by building them up one ring at a time. They studied the chemical reactions that begin when a complex hydrocarbon, the 4-phenanthrenyl radical (which has a molecular structure that includes a sequence of three rings and contains 14 carbon atoms and nine hydrogen atoms) combines with acetylene (which has two carbon atoms and two hydrogen atoms).

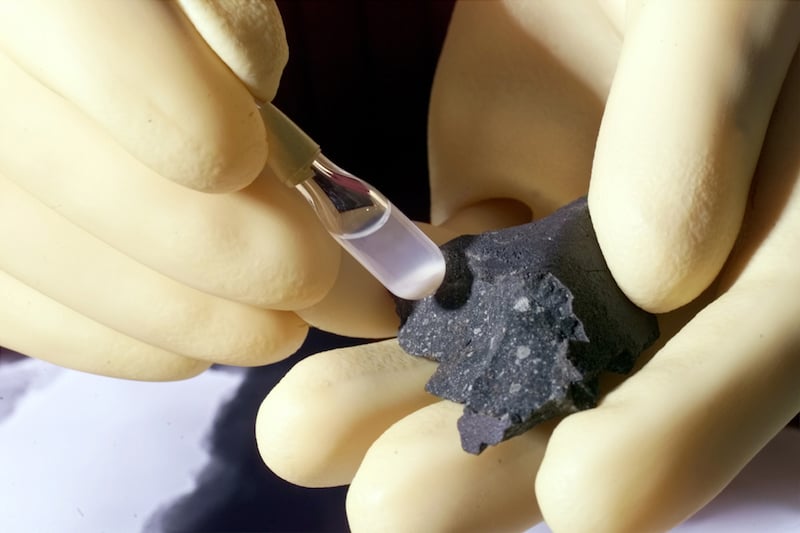
Sample of the Murchison meteorite

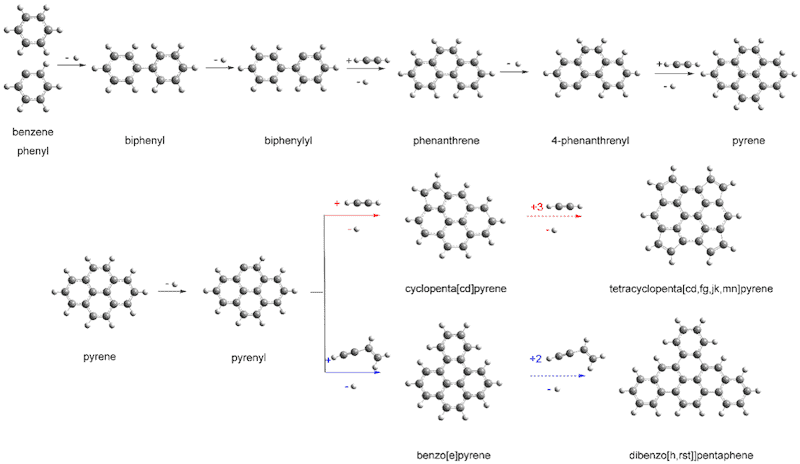
Intermediate reaction steps

The researchers performed their experiments at the Advanced Light Source (ALS) at the Berkeley Laboratory. They injected the gas mixture into a microreactor and heated the sample to temperatures as high as those that exist around stars. They then focused a VUV light beam from the ALS synchrotron onto the heated gas mixture to ionize the molecules in the sample.

The team then proceeded to analyse the chemical reactions taking place using a detector that measures the different arrival time of particles created after ionization. These times reveal the signature of the parent molecules and, together with theory calculations, allow the researchers to determine the intermediate steps in the reactions.

Towards an understanding of the molecular carbon budget in our galaxy

The experiments indeed show that a four-ringed molecule (pyrene) can be produced from a three-ringed one (phenanthrene). “Large chains of ringed molecules and ultimately 2D graphene-type structures might form via the same processes,” says Kaiser.

How pyrene can form more complex hydrocarbons

This result brings us closer to an understanding of the molecular carbon budget in our galaxy and the fundamental molecular level processes of synthesizing PAHs, say the researchers, reporting their work in Nature Astronomy doi:10.1038/s41550-018-0399-y. “This is how we believe some of the first carbon-based structures evolved in the Universe,” adds Musahid Ahmed of the Berkeley Laboratory. “From 2D graphene you can then get graphite, and the evolution of more complex chemistry begins, he says.

Firm power parity metric

A paper from Imperial College proposes a new conceptual framework for understanding competition in electricity markets that includes variable input but marginal cost renewables. Noting that one of the primary drivers for consumers to switch from grid-supplied electricity to self-generated electricity (e.g. home rooftop PV with batteries) is cost savings, the researchers constructed a model that forecasts when going-it-alone “grid defection” by consumers may become widespread. In reality, few domestic consumers in the UK are likely to want to go entirely off grid. At least not for some time. Grid links are needed and useful for backup, e.g. for when there has not been enough sunshine for a while and consumers’ batteries are discharged, and also to sell any surplus power they can generate, beyond what they can store. However, the grid defection analysis is still a useful conceptual exercise, not least since it gives us some idea of the cost of balancing/backing up variable renewables. And, in time, some users may want to try the off grid option.

Based on detailed modelling of technology cost curves, the Imperial researchers estimate the year in which three types of consumers switch to on-site power generation that offers similar reliability and lower cost to grid-supplied electricity. But in so doing, instead of just using the normal concept of “grid parity”, the point of economic indifference between the cost of on-site renewable energy (e.g. roof top solar plus backup batteries) and the cost of conventional supply, they use a new concept, firm power parity. Building on the notion of cost equivalence, firm power parity is reached when “on-site renewables deliver the same service at the same cost as conventional electricity supplies”. Firm power is available when “the wind doesn’t blow, or the sun isn’t shining”.

Their results suggest that, “While it will become increasingly profitable for consumers to generate and store their own electricity, profitably disconnecting from the grid is more than a decade away in most markets. For consumers who already enjoy reliable transmission and distribution infrastructure, the cost of replicating grid reliability (even on a single-day basis) will remain significant.” But by 2030 the researchers say that may change so that these technologies will become disruptive to conventional sources, and it’s already the case in some off-grid areas, for example in developing countries, with local mini grids being an option.

There are some limits to the approach: the researchers note that “Our analysis does not yet account for the value obtained from a variable or time of use (TOU) tariff, which would likely act to accelerate the date of firm power parity. Furthermore, it does not incorporate the social costs of greenhouse gas emissions from grid-supplied electricity. To keep things simple, we fixed the price of electricity in each market, keeping it constant in 2017 real money terms throughout the forecast period.”

There are some parallels with the “equivalent firm power” concept proposed by Dieter Helm (see my earlier post), although that is part of a wider set of policy suggestions and it concerns the system level costs, as faced by supply companies and grid managers. For another, much more general, system choice metric, with some social and eco-costs also added, see “Co-production in distributed generation: renewable energy and creating space for fitting infrastructure within landscapes“.

There various new metrics are quite complex and to some extent an engineering approach to identifying the extra system cost is perhaps easier, e.g. the cost of grid balancing can be estimated directly and seems likely to be in the range of 10-15% extra on generation costs. So then you can judge if its worth it to make the change, e.g. at the system level. But that doesn’t give you an insight into the social and eco-costs and benefits. Neither does the approach that Trump tried to get adopted in the US –  it seemed mainly concerned with protecting the conventional energy market and supply system, and coal and nuclear plants particularly.

To that end, energy secretary Rick Perry proposed that the Federal Energy Regulatory Commission (FERC) develop and implement rules that accurately price generation resources necessary to maintain the reliability and resiliency of the US bulk power system. As proposed, the final market rules would allow for the recovery of costs for what the Department of Energy calls “fuel-secure” resources that provide “reliable capacity, resilient generation, frequency and voltage support and on-site fuel inventory”. Eligible units would be required to have a 90-day fuel supply on site in the event of supply disruption. The result would clearly benefit fossil and nuclear.

Energy security and grid balancing are obviously important, but this approach, with renewables seen as introducing extra risks and costs, might be seen as a bit negative, ignoring the climate-change issues and the role that renewables can play in avoiding them:

Fortunately, is was ruled out of order, at least for now. However, what seems a similar view had also emerged in Australia, where wind and solar farms may be forced to meet tougher standards to guarantee reliable energy. The idea emerged in a review of system reliability by chief scientist Alan Finkel, which, among other things, recommended that individual wind and solar farms be responsible for providing “dispatchable” generation via a “generator reliability obligation”, or contracting with other suppliers to meet this requirement.

The idea is being fought by green energy backers, with, according to Renew Economy, the industry “struggling to understand why each new plant would need to add battery storage or strike a deal for ‘firm capacity’ with a neighbouring gas plant”. They argue that “reliability isn’t a function of each individual power station but all of the system”. That’s clear: no one expects each gas, coal, nuclear plant to have its own backup. Grid balancing is best provided at the system level.

Nevertheless, it is reasonable that each generator should pay its share of the cost of this. Fossil plants can also have variable outputs, due to unplanned outages, as can nuclear plants, but the variations with solar and wind are larger. The proposed new Australian system would certainly make this visible, as would that proposed in the USA. In the UK, some of these extra cost are already covered by “use of system” charges and grid development/management costs charged by grid companies, who, typically, are responsible for balancing the system and keeping the lights on. But there are pressures to make renewable generators pay more and similar issues are emerging in the EU in relation to the priority dispatch provisions that renewables enjoy – their output is given priority (see Clean Energy News and Energy Transition.) Clearly, if we want low carbon green power, the priory dispatch approach promotes it, but rivals like nuclear don’t like it, and renewables do require balancing measures, which have to be paid for.

Political battles like this aside, in terms of methodology and easy assessment, by contrast to the defensive approaches being proposed in the USA and Australia, and even now the EU, stressing the costs and risks of renewables, and supporting their rivals, the firm power parity approach is more forward looking, focusing on the process of change, taking balancing costs into account, from the consumers point of view. And certainly, despite its limitations as currently configured, it can provide a rough view of when changes may occur: maybe quite soon. Charles Donovan, director of Imperial’s Centre for Climate Finance, says “The results of our research are exciting as they show we will soon be entering a period where reliable and profitable solar power production by residential energy consumers becomes a reality in relatively cloudy places like London.”

Meanwhile, in terms of the system level requirements, the capacity market provides balancing capacity, with the UK’s latest auctions (T1 for next year, T4 for four years ahead) contracting mostly gas-fired capacity, to be available to meet shortfalls. Coal plants and diesel plants mostly got shunned, but storage and demand management are beginning to make an impact, though it’s still small.

Oddly, however, nuclear plants were included in T4, despite not being able to load follow. They do offer some synchronous frequency support – an issue I explore in my next post.

Wrestling over the best subatomic particle, hitchhiker’s guide to Stephen Hawking, where are the women Brian?


Physicists are usually a staid bunch, but not so in this video from the US’s National High Magnetic Field Laboratory — in which some of the lab’s leading scientists fight their corner for their favourite subatomic particle. After watching the video, you can take part in the “Subatomic Smackdown” by casting your ballot for either the photon, electron, neutron or proton. You have until 30 March to make your vote count.

Yesterday, BBC Radio 4 broadcasted the first episode of The Hitchhiker’s Guide to the Galaxy: Hexagonal Phase, which it describes as the “sixth series of the cult science fiction comedy, based on Eoin Colfer‘s book And Another Thing… with additional unpublished material by Douglas Adams”. As well as having a subtitle that should make condensed-matter physicists laugh out loud, none other than Stephen Hawking plays The Guide Mark II in the radio drama. You can listen to a clip of Hawking’s performance or enjoy episode one (of six) in its entirety.

Finally, yesterday was International Women’s Day so you might have thought that celebrity physicist Brian Cox would have mentioned a few female scientists in his article in The Guardian today about science tourism. But incredibly, no women are mentioned. To add insult to injury, Cox is pictured in front of a radio telescope – and Jocelyn Bell Burnell used a radio telescope (ok, a different one) to observe the first pulsar.

Juno looks deep below Jupiter’s surface

Precise measurements of Jupiter’s gravitational field by NASA’s Juno spacecraft have allowed scientists to make an important connection between surface winds on the planet and motion deep below the surface. The data have also provided new insights into the composition of the core of the giant planet. A separate study by Juno scientists reveals that Jupiter’s north and south poles harbour persistent arrangements of cyclones, an unexpected observation that cannot be explained by current models of the Jovian atmosphere.

In addition to its famous red spot, the surface of Jupiter is covered by alternating light and dark bands that are created by powerful winds. Scientists believe that these bands are driven by energy welling up from the interior via convective cells. But despite calculations and simulations, scientists know very little about how this process occurs in the dense fluid of hydrogen and helium that makes up Jupiter’s interior.

Now in three papers published in Nature, Juno scientists have peered deep into the planet by analysing data derived from precise measurements of its gravitational field.

Doppler shift

In one paper, Luciano Iess and colleagues describe how they mapped Jupiter’s gravitational field by determining the acceleration of Juno as it orbited the planet. This was done by measuring the Doppler shift of the radio waves that the spacecraft sends back to Earth. These data revealed a surprising feature – that Jupiter’s gravitational field is not north-south symmetric about the planet’s equator. This is unexpected for a rapidly-rotating gas giant and is evidence of strong flows within the atmosphere and interior of Jupiter.

Another paper, written by Yohai Kaspi and colleagues, analyses the north-south asymmetry and shows that it is related to a north-south asymmetry of wind speed in the bands visible on the surface. This is strong evidence that the wind bands are not just a surface phenomenon and Kaspi and colleagues calculate that they persist to about 3000::km below the surface. This is about 5% of the distance to the centre of the planet, which means that about 1% of the mass of Jupiter is involved in these winds.

This interpretation of the gravity data is backed up by a third paper, which is by Tristan Guillot and colleagues. This group looked at the symmetrical component of the gravitational field and concluded that, below 3000 km, the Jovian interior rotates like a solid object – despite being a fluid. This supports the idea that the huge pressures inside Jupiter (about 100,000 atmospheres) ionizes hydrogen creating free protons and electrons. The presence of these charged particles is expected to create strong drag forces that suppress flow.

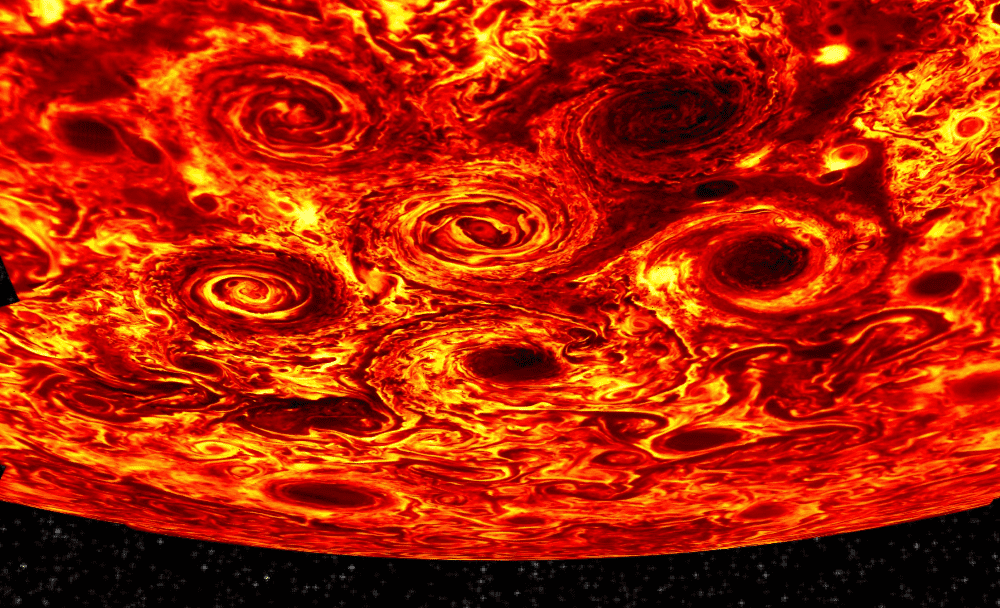
Image of Jupiter's polar cyclones

In a fourth paper in Nature, Alberto Adriani and colleagues used visible and infrared observations to show that the planet’s polar regions harbour regular patterns of cyclones that are remarkably persistent. The north pole is home to eight cyclones that circle a ninth cyclone that sits over the pole. The cyclones are all about 4000-4600 km in diameter and their positions and shapes remained more or less the same over hundreds of days of observation. In contrast, the south pole has five cyclones circling a central cyclone. These objects have larger diameters (5600-7000 km) and are also persistent. This is unlike the polar regions of Saturn, which contain one central cyclone.

The team says that fluid dynamics theory is unable to explain two important aspects of the polar patterns: that the cyclones and the patterns they make do not change appreciable over time, and that the cyclones do not appear to interact with each other.

Food truck fuels the imagination

Without doubt the most unusual exhibit at this year’s APS March Meeting was the “Food Truck for the Physics Mind”, the brainchild of educational specialists TeachSpin. Founded in 1994 by Jonathan Reichert, a physics professor at the State University of New York, Buffalo, TeachSpin devises and builds sophisticated experiments to allow undergraduate students to explore key concepts in physics and to understand how different instruments can be used to probe a range of physical phenomena.

The 44-foot food truck allows the TeachSpin team to take 20 experiments out on the road, allowing students and faculty at colleges across the United States to get hands-on experience with research-grade instrumentation. The mobile teaching laboratory has already made stops at more than 30 institutions, with more planned in California immediately after the APS meeting.

Reichert told me that he originally set up the company to provide more undergraduates with access to advanced laboratory experiments that can be used both to teach core physics principles and to allow students to produce meaningful data for experimental projects. “Of 750 institutions offering undergraduate degrees in physics, less than half provide advanced laboratories to their students,” he said. “But the advanced lab is a critical educational experience for a physics major.”

A quick tour of the food truck reveals advanced experiments in areas such as diode laser spectroscopy and optical pumping of rubidium vapour, Fourier techniques, two-slit interference one photon at a time, and a suite of experiments for condensed matter physics. But Reichert himself is most closely associated with an instrument designed for teaching pulsed nuclear magnetic resonance (NMR), which includes a spectrometer capable of one-dimensional imaging.

Hundreds of TeachSpin’s experiments are now installed in teaching laboratories all over the world, including the University of Cambridge in the UK – where Reichart says the pulsed NMR experiment has proved particularly popular. The company is run as a foundation, with all the profits used to support the education of undergraduates students through advanced physics laboratories.

“Your students deserve to have this experience,” Reichert enthuses. “Little compares to the excitement of using modern apparatus, and they mind find the laboratory the highlight of their undergraduate education.”

Heart attacks can rise during extremes of heat

Extremes of heat are dangerous. Just how dangerous is still being established. But since heat waves are on the way, city-dwellers need to know.

Extremes of heat can break your heart. Climate change can kill. The risk of heart attack increases by every 5°C leap in temperature differential, according to new research.

That is: on a baking summer day there could be nearly twice as many heart attacks on those days when the temperature swings by 35° to 40°C than on days when there is no such wild fluctuation.

Studies of the link between heat and health matter, because the past decade in North America has now been confirmed as the hottest for 11,000 years.

Climate scientists have repeatedly warned of the dangers of ever more intense and frequent heat extremes as the global average temperatures creep up, and two new studies have identified different ways in which cities themselves can become danger zones for vulnerable people.

One is that, as regional climates change in response to ever-increasing combustion of fossil fuels, which then intensify the greenhouse gas ratios in the global atmosphere, cities in now-arid regions will suffer ever more severe heatwaves, even though their rural hinterlands may enjoy higher rainfall.

And the second is that, in some cities, urban planning may have already provided ways to intensify or mitigate the impact of summer heat waves. It’s a simple but unexpected outcome of atomic physics.

Increasing fluctuation

All four studies are evidence of the subtle and often intricate connections between human civilisation and climate, and of the consequences of the simple question: what happens to communities and landscapes as average temperatures go up?

“Global warming is expected to cause extreme weather events, which may, in turn, result in large day-to-day fluctuations in temperature,” said Hedvig Andersson, a cardiology researcher at the University of Michigan.

“Our study suggests that such fluctuations in outdoor temperature could potentially lead to an increased number of heart attacks and affect global cardiac health in the future.”

She told the American College of Cardiology 67th annual scientific session that she and colleagues looked at data from 30,000 patients treated in 45 Michigan hospitals between 2010 and 2016, and then matched the patients with temperature fluctuations on the day of the attack.

Such a study cannot prove that temperature swings actually cause attacks, but there is what scientists call an association: rapid and extreme fluctuations seem to be accompanied by more cases of myocardial infarction, a serious form of heart attack.

Urban vulnerability

That heat is dangerous is not a surprise: heatwaves in the last 30 years have risen three times faster than average temperatures as a whole, and one study has identified 27 different ways in which heat waves can kill. And the greatest concentrations of potential victims will be in the cities.

The crowded urban spaces of America and Europe spread across landscapes warmer than at any time since the end of the Ice Age. US researchers report in the journal Nature that they collected fossil pollens from 642 ponds and lake beds across Europe and North America, to provide a record of local temperature shifts in the last 11,700 years, to conclude that – without global warming as a consequence of profligate human use of fossil fuels – the world ought to be in a cool phase.

“It does show that what has happened in the last 30 years — a warming trend — puts us outside of all but the most extreme single years every 500 years since the Ice Age. The last 10 years have, on average, been as warm as a normal one year in 500 warm spell,” said Bryan Shuman, an earth scientist at the University of Wyoming, and one of the authors.

Whatever the average regional temperature, it’s hotter in the cities, because concentrations of traffic, business, heating, cooking, lighting and air conditioning generate what has become known as the urban heat island effect: what makes this worse is that the asphalt, tarmacadam, stone, brick, glass and tile of which cities are made absorb radiation but prevent ground evaporation as a natural cooling device.

Researchers from Princeton University report in the journal Environmental Research Letters that they considered how future heat waves will play into the urban heat island effect in 50 US cities.

For the rest of this century, cities in the east and southeast of the US will be more severely affected: less so the cities in the arid parts of the American west.

But by 2100, this could change dramatically. Rainfall and heat extremes will increase. Cities such as Phoenix, Arizona will continue to face water shortages – once again, all that impermeable concrete and sealed highway – but climate change could make the surrounding countryside somewhat moister.

The message, once again, is that what keeps a city cool is moisture: the vapour evaporated from canals and rivers or transpired through green parks and treelined boulevards.

“Given that 50% of the world’s population currently lives in cities, and that percentage is projected to increase to 70% by year 2050, there is a pressing need to understand how cities and landscapes are affected by heat waves,” said Lei Zhao of Princeton’s Woodrow Wilson School of Public and International Affairs.

“Our study explains why cities suffer even more during extreme heat events and highlights the heat risks that urban residents face now and in the projected future.”

Seeking mitigation

The researchers say the hunt should be on for heat mitigation strategies. But a surprising study in the journal Physical Review Letters suggests that some of the problems – and the solution – may have already been built into the fabric of the modern metropolis.

A team of materials scientists and engineers simply considered the city as crystalline or glass-like: that is, was the city laid out on a planned, orderly grid system? Or did it just grow up, in an organic, disorderly fashion?

They applied the tools of classical physics normally used to analyse atomic structures. They looked at satellite images of 47 cities in the US and beyond, and graded them according to their order, or disorder. Grid cities absorbed heat compared to their surroundings far faster than the so-called glass-like cities.

Since urban populations are growing, and new cities springing up everywhere, classical physics can help in unexpected ways. “If you’re planning a new section of Phoenix,” said Roland Pellenq of the Massachusetts Institute of Technology, “you don’t want to build on a grid, since it’s already a very hot place. But somewhere in Canada, a mayor may say no, we’ll choose to use the grid, to keep the city warmer.”

The effects are significant. He and colleagues found, for example, that in the state of Florida alone urban heat island effects cause an estimated $400 million in excess costs for air conditioning. “This gives a strategy for urban planners,” he says. – Climate News Network

• This report was first published in Climate News Network

Pre-natal alcohol exposure alters functional connectivity

Here’s a sobering thought: children born to mothers who consume large amounts of alcohol during pregnancy have been found to have altered connectivity in their brain networks. Specifically, abnormal functional connections between sensorimotor areas and hubs of the “default mode” and “salience” networks (involved in motor function, cognitive control, emotions and consciousness) suggest that children with pre-natal alcohol exposure (PAE) recruit additional brain regions for sensorimotor tasks, which could imply poorer brain network efficiency. This work was performed by researchers at the Universities of Calgary and Alberta, and will help further investigations concerning sensorimotor alterations in youths with PAE (Human Brain Mapping doi: 10.1002/hbm.24004).

Foetal alcohol spectrum disorders (FASD) describe a range of effects and symptoms caused by PAE. Sufferers may have difficulties in cognition, such as learning or remembering, motor coordination problems, and sensory processing deficits. They are also at greater risk of developing mental health illnesses such as ADHD and depression. Previous research has shown abnormalities in brain function and structure, but there are only a few articles, which investigated resting-state (rs) networks in PAE, using functional MRI (fMRI).

Everything is connected

Typical fMRI studies involve the participant performing a task, or experiencing a stimulus passively. A blood-oxygenation level dependent (BOLD) signal is measured, which itself is an indirect measure of neural activity over time. In rs-fMRI, there is no task, but instead, researchers measure stimulus-free brain-states, and by using connectivity analyses, can observe background functional networks (spontaneous BOLD signal fluctuations between regions that are temporally correlated). In this study, the researchers performed rs-fMRI on 59 participants with PAE and 50 controls, with data acquired across multiple centres.

Analysis pipeline

The researchers calculated functional connectivity (FC) maps for each participant, based on a seed region in sensorimotor cortex. They generated an average similarity matrix of FC between each voxel and every other voxel within the sensorimotor region of interest (ROI). They classified two cluster ROIs, corresponding to the hand/upper limb area and the face/lower limb area. Finally, they generated FC maps between these two regions and the rest of the grey matter of the brain.

Alterations in functional connectivity

The organization of somatosensory cortex in controls and PAE participants was very similar, suggesting that there is no large disruption to sensorimotor organization, regardless of motor skill deficits.

There were, however, significant group differences in functional connectivity. For PAE participants, the researchers observed higher FC from the seed regions in sensorimotor regions to the insula and anterior cingulate (the salience network – how we perceive certain stimuli relative to other background stimuli). They also saw a decrease in FC from the seed to the superior temporal gyrus and precuneus (hubs of the default mode network – a network that activates during wakeful resting).

These FC abnormalities could imply abnormal interactions between cognition and motor functions, and could affect areas associated with face processing, emotions and memory. The decreases in FC were observed in regions that are involved in manual coordination and sensorimotor processing.

The team performed a comparison of FC across age. While they observed an increase in FC in controls (between facial sensorimotor regions and the insula) across time, this was absent in PAE participants. The authors suggest that altered development could be related to altered cognitive-motor development, noting its potential use as a biomarker.

The findings of this study show that although the topographic organization of sensorimotor areas is seemingly unaffected in PAE, there is higher FC between sensorimotor seed regions and salience and executive networks. This could be explained by an overcompensation mechanism, whereby more regions in sensorimotor networks are recruited than usual, implying a less efficient network.

3D printing yields customized spinal implants

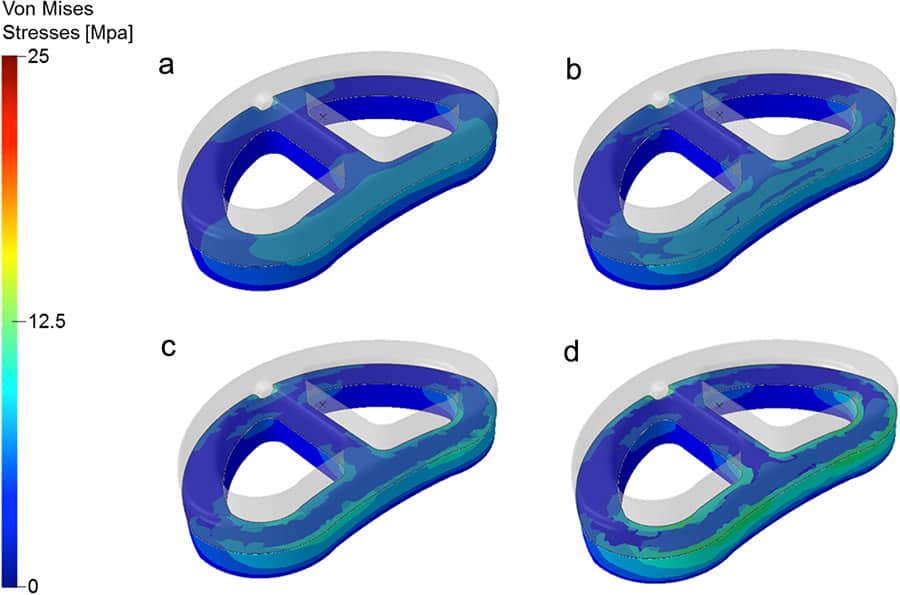
Von Mises stress distribution for the (cross-section) of model of lumbar cage design

Researchers in the UK recently designed and fabricated anatomically shaped spinal implants using additive manufacturing for the first time. The work, published in the journal Biofabrication, will help in the development of customized implants in the future using data from patients’ own CT and MRI scans.

“The publication of our paper has helped us secure a number of new national and international collaborations,” says team leader Deepak Kalaskar of University College London. “Thanks to these, we are now developing complete custom-made solutions for spinal surgery that combine our current work on spinal implants and newly started studies for developing medical devices and instruments to improve surgical outcomes for complex spinal surgeries – such as those required for treating scoliosis. This work is being funded by Orthopaedic Research UK.”

And that is not all: by closely collaborating with clinicians, Kalaskar and colleagues now have realistic computational models that take into account various patient factors, including the type and severity of their spinal diseases. These models can easily be adopted by hospitals and are a base for further refining implant design using patients’ own pre-operative CT or MRI scans.

There have been several publications in this area from the wider scientific community since the publication of the Biofabrication paper and there is a flurry of interest in the subject across academia and industry. “Our work has been cited by 10 publications within one year of being published, and NewsRX, a US-based tech company, also published an article [in Biotech Weekly] on our research in July 2017 entitled ‘3D printing in spinal surgery’, calling it ‘cutting edge’.”

The researchers say they are now working with an industrial partner to develop custom-built spinal implants. “We have developed computational validation methods and processes to test these implants using individual patient data and will be further validating these via laboratory testing to confirm their translational potential,” says Kalaskar.

Such tests include morphological analysis using scanning electron microscopy, wettability, mechanical evaluation, microstructure analysis using X-ray microcomputed tomography, topographical evaluation at the nanoscale by atomic force microscopy, and measuring the in vitro biological response of the implants.

Coming into its own

Lower back pain is a common affliction in industrialized nations and affects no less than 80% of adults during their lifetime. Severe low back pain is often linked to the degeneration of intervertebral discs and the most widely used surgical procedure to treat this problem, apart from replacing discs completely, is lumbar fusion. Here, surgeons implant an inter-body cage packed with bone graft to promote how bone grows and fuses with the spinal vertebrae.

Most cages available today are made of titanium or polyether ether ketone (PEEK), but neither of these types of device are ideal since they can only be produced in “standard” sizes that are often either too big or too small for individual patients. Anatomically shaped and perfectly matched implants would, of course, be much better since they would fit more neatly and allow bone to heal faster.

Additive manufacturing, or 3D printing as it is more commonly known, is coming into its own here because it can be used to cost-effectively fabricate customized 3D structures with complex geometries. Equally important, those structures can be reproduced perfectly.

In their Biofabrication paper, Kalaskar and colleagues describe how they designed, developed and manufactured anatomical 3D-printed lumbar cages based on a novel composite POSS-PCU – a biomaterial that has already proved itself to be promising for use in a variety of medical device applications.

New directions

The research fits in with the team’s wider research programme, which focuses on developing bespoke implants and devices for musculoskeletal disorders (such as intervertebral disc degeneration and scoliosis) and for repairing and reconstructing various bone defects and providing synthetic replacements for the repair of tendons and ligaments.

The group is also looking into biofabricating bone and cartilage tissue, which will hopefully help replace diseased or degenerated tissues. The programme brings together the group’s expertise in biomaterials, patient imaging and data analysis, computational modelling and manufacturing technologies.

“While we found 3D printing to be a good technique for printing anatomically shaped implants,” Kalaskar adds, “we are now asking ourselves several questions as regards to reproducibility, scalability and tolerance of additive manufacturing processes. Answering these questions will be essential for clinical translation.”

  • This article is one of a series of reports reviewing progress on high-impact research originally published in the IOP Publishing journal Biofabrication.
Copyright © 2026 by IOP Publishing Ltd and individual contributors