In February 2021 geophysicist Rob Abbott spent a week on the North Slope of Alaska, US, using a novel instrument to study sea ice. He spoke to Margaret Harris about the challenges of working in this harsh environment and what he and his colleagues hope to learn

Let’s start with the project. What were you doing up on the North Slope?
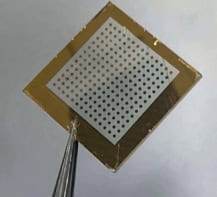
We wanted to try a technique called distributed acoustic sensing (DAS) under ice for the first time. The way DAS works is that you take a standard fibre-optic cable, like the ones used for telecommunications, and on one end of the cable you have a device called an interrogator that rapidly pulses laser light down the fibre. This creates a certain amount of backscattered light – there’s Rayleigh scattering, Brillouin scattering, Raman scattering and so on that all comes back to you. We’re interested in Rayleigh scattering, which comes about due to natural imperfections in the glass (changes in the density of the glass affect its refractive index) and doesn’t change the wavelength of the scattered light.
So you send a laser pulse down the fibre, and then you send out another pulse and compare what you get back. If the fibre has been strained or changed length in the meantime, there will be a phase shift between the two pulses. Then you can use your knowledge of the optical properties of glass to convert the phase shift into a nanometre per metre per second strain rate that tells you what happened to the fibre between the two pulses. In essence, the fibre is like a 40 km-long (in our case) seismometer that sits inside a 4 m-deep trench (which protects the fibre from icebergs that might ground and catch on the cable) in the sea floor and measures vibrations in the Earth.
The nice thing about this DAS technology is that it’s very, very difficult to get a traditional ocean-bottom seismometer or even hydrophones running in the Arctic environment. The transportation access is terrible, the weather can be dangerous – all sorts of things can go wrong. But now, instead of having a few ocean-bottom seismometers for a short period, we have 20,000 channels of seismic data.
How do you get that many channels?
Although the fibre-optic cable is continuous, the strain rate is measured at discrete intervals along it – hence the nanometre-per-metre-per-second units. For this experiment, the intervals were 2 m long, so over the 40 km length of the cable, that’s a total of 20,000 channels coming from this cable, all in an area that previously had virtually no seismic data at all. And if we want to do the same experiment next year to see if there’s been any change in the environment, this fibre is going to be in the same spot for decades – it was installed by a telecommunications company called Quintillion to bring the Internet to the North Slope of Alaska. We’re just piggybacking on it.
What was it like working up there? I guess it was pretty dark in February.
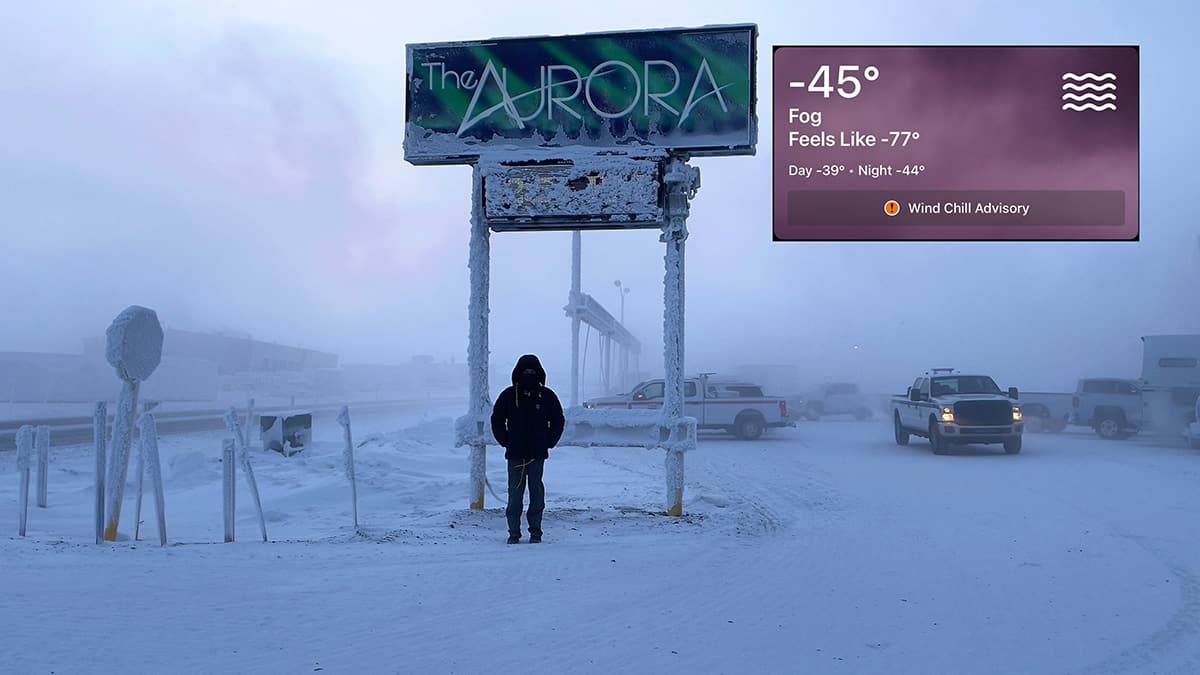
Yes, the Sun wasn’t up for long during the day and it wasn’t very high above the horizon when it was, but I was surprised at how light it was. Everything’s covered in snow, so you get a lot of reflected light. The temperature, though, was –43 °C, with a wind chill of –60 °C, and we had a lot of blowing snow and ice fog when we drove from our accommodation in Deadhorse, Alaska to the cable landing station at Oliktok Point (the most northerly spot in North America that you can drive to, at around 70 degrees north latitude). But the great thing about DAS is that you can take most of the data from inside the landing station. You’re not huddled in a tent out on an ice sheet.
As for how the instruments coped with the conditions, the interrogator is certainly not indestructible. It has a narrow range of temperatures where it’s happy, and you can’t store it below 0 °C without damaging it. That was difficult because on the two-hour drive out to Oliktok, we had to have the instrument taking up a seat in the car – we couldn’t put it in the back of a pickup truck because by the time we got to the field site, it would have been ruined. The interrogator can overheat, too, which is a problem if you use it in the desert in Nevada.
Why Nevada?
I originally got interested in DAS because of a series of experiments I was involved in at the Nevada National Security Site, which is where the US did its continental nuclear weapons testing between the 1950s and the early 1990s. Nowadays, we’re doing chemical explosion tests for nuclear nonproliferation purposes, to help us discriminate earthquakes from explosions.
A few years ago, as an add-on experiment – not really expecting to get great data – I proposed using DAS to monitor these explosions. It worked beyond our expectations, and after that, it was like I had a new hammer and I was looking for nails sticking up: I wanted to find more ways to use this fantastic new tool. I had done some previous work in Alaska using traditional seismometers to listen to permafrost melting, so when the first examples of DAS on the sea floor came out late in 2019, I thought, “I wonder if there’s a telecoms networks up in Alaska where I could try this under the sea ice?”
DAS worked beyond our expectations – it was like I had a new hammer and I was looking for nails sticking up
So I sent an e-mail to Quintillion – initially just a cold e-mail sent via the “Ask us about our Internet service” button on their website. But luckily, the person who was monitoring that address had studied geophysics at the University of Alaska, so when I said, “Hey, I’d like to do distributed acoustic sensing on your fibre”, I got an almost immediate response. I had no expectation I’d ever hear from them, but I did, and it was great.
Who else are you working with?
One of our partners on the Arctic project is Silixa LLC, the UK-based company that makes our DAS system. They do a lot of work with the oil and gas industry, which uses DAS for microseismic monitoring in wells and was an early adopter of the technology. But we take data that the oil industry doesn’t, so that strains the limits of DAS and helps Silixa develop their technology further. It’s already working well, though. The explosions I mentioned in Nevada involved 50,000 kg of explosives and the sensors were only 80 m away, whereas in the Arctic we’re listening to tiny ice quakes 40 km out in the ocean.
What are ice quakes?
Ice quakes can happen when ice that’s “fast”, or stuck to the shore, collides with free-floating ice on the sea. They occur within shore-fast ice and within sea ice, too, but they are more common at the interface because it’s an area of great friction – especially when the tide goes in and out, and the wind pushes on the ice as well. You can also get what’s called basal-slip icequakes, where bottom-fast ice grinds on the sea floor.
It’s interesting that we see ice quakes in our data because our sensors are not in the ice: the ice is at the surface, then there’s a layer of water, then the sea floor and then our cable. The physics of how these layers couple is complex. For example, ice is a solid, so it can carry both P (pressure) waves and S (shear) waves, but fluids like water can’t propagate shear waves. That means you can tell the difference between ice quakes and earthquakes, because with earthquakes the system picks up waves that can’t propagate in water.
What else do you hear when you listen under the Arctic ice?
One other thing we hear is what’s known as flexural gravity waves. When the wind relentlessly pushes on the ice, it causes the ice to mound up, and then gravity takes the ice back down. That produces a long-period wave (at least, it’s long in seismic terms – it’s about 40 seconds) as the ice works and flexes. We see that in the data and that’s one of the things we’ll use to measure ice thickness. This is a difficult measurement to do, and a lot of times it’s done from satellites with a resolution that is maybe not as good as we would like.
We hear ocean dynamics as well. The ice does not reach all the way to the sea floor where the cable is, so we see the effect of currents in the ocean as well, under the ice. That is also a very hard measurement to take, so data like this is gold for climate modellers – they can add it to their ocean circulation models.
What do you hope to learn in the longer term?
Our major goal is to gather more information about climate. We’d like to have a better idea of the intensity and distribution of Arctic storms, for example. We should be able to look up the ambient noise level of a storm and determine how severe it is. In the future, we’d like to combine our DAS work with measurements made by buoys, so that we can work out the transfer function between the strain rate of the fibre in the sea floor and the wave height of the buoys, either on ice or in the water. If we know that relationship and it’s robust, then we’ve essentially put 20,000 buoys in the ocean that aren’t going anywhere and we can come back to them year after year. The DAS fibre is going to be there forever in practical terms; at least, I’ll be retired before it’s gone.
Icequakes and rogue waves: geoscientists and musicians interpret the sounds of the sea

That kind of data will help us understand ocean circulation and wave height. So if we find that wave height is increasing every year – and maybe it is and maybe it isn’t, but let’s say it is – then that will have big implications for coastal erosion, which is already a problem on the North Slope. The higher the wave height, the more energy is impinging on the shore, so if we know about it we can make better predictions of how long coastal cities like Utqiagvik can continue in their current locations before they have to move. Fundamentally, we’re listening to the rhythm of the climate.