A bubble in the ocean may seem insignificant, but consider all the bubbles in all the oceans and you find a powerful influence on the planet. Physicist and oceanographer Helen Czerski talks about her expeditions into stormy seas to learn more about these tiny pockets of gas
It’s a classic undergraduate physics question: i) write down an expression for the acceleration of a solid cylinder placed on an inclined surface and ii) using the parameters given, calculate the length of time the cylinder takes to travel 2 m. But when you’re on the back deck of a ship in stormy seas, watching the grub screw you’ve just dropped zoom off towards the edge of the deck and wondering if the ship will roll back before the screw is lost in the ocean forever, gratitude for your physics education isn’t really dominating your thoughts.
There’s a good reason that there’s a gap running right around the deck of every ship at floor level – it means that any ocean water that arrives over the side will quickly find its way back out. But when the ship is pitching and rolling, and gravity can’t be trusted to leave things where you put them, that gap is the ocean physicist’s black hole. Anything that goes through it certainly isn’t coming back.
The oceans are an engine – they take in energy from the Sun, mostly close to the equator, and redistribute it towards the poles. Playing their part in this massive engine, despite their comparatively insignificant size, are bubbles. I study these pockets of gas caused by breaking waves, and the best way to do that is to be out here, in amongst it all. I love working at sea with the rawness, practicality and teamwork that comes with it. Even in an age where giant servers are flooded with satellite data from above and remotely operated underwater vehicles and autonomous buoys roam the seas below, there’s still a place for a ship.
So here we are, in a glorified tin can, dangling instruments over the side on technologically advanced bits of string, because it’s the best way to see the sea. The plumes of bubbles beneath the surface and the foam patches on top are fleeting and still poorly understood, but we know that they matter. Seafarers have looked out at stormy seas for centuries, but it’s only in the past few decades that we have started to understand even the first metre of water beneath the surface. It’s hard to get to, but fascinating to study.
Life on board a research ship is full of reminders that we take a lot for granted on land. At sea, there are nights when we lie awake listening to the thumping from the lab above as the ship rolls, wondering whether our most expensive equipment is playing pinball on the lab floor. We can spend an hour replacing one broken component, because we have to strap down or put away every single tool, screw and container as soon as we let go of it. And we have to chase the water around the shower cubicle as the ship rocks, because “down” is everywhere apart from where you’re standing. But it’s worth working here, bobbing about on the vast boundary between the water and air, because we have access to the heart of Earth’s engine. And even the boundary itself has a huge story to tell.
The lumpy bumpy ocean
You can think of the top of the ocean as a sheet, a 2D surface that never smoothly follows the ellipsoidal shape of the planet. On the very largest scales, the sheet bulges where dense mountain ranges above and below the water surface exert a strong gravitational pull. The great ice sheet of Antarctica also draws water towards itself – it’s thought that as it melts, the bulging water will slosh back northwards, making sea level rise more significant in the northern hemisphere. Trade winds and general ocean circulation are associated with sea surface height anomalies of a metre or so, enough to monitor ocean currents using space-based altimeters. Tides can cause half a metre or so of change in the open ocean, but up to 15 m near some coastlines. Even the low atmospheric pressure in the centre of a large rotating storm causes a bulge in the ocean surface that’s perhaps half a metre in height. Oceans are lumpy bumpy places, although the bumps are sometimes too big for us to see.
But the surface waves are different, because they’re the strongest physical link between the atmosphere and the ocean. Local winds push on the ocean surface, transferring momentum and energy, and generating waves. This is the process of building “wind-sea” – steep waves of different sizes caused by the current conditions. As the wind speed increases, and waves are pushed for a longer time period, over a greater distance, they keep growing in size. The energy in the waves continues to increase until energy loss mechanisms catch up, provide some balance and stop the waves growing. Beyond a wind speed of about 5–10 m/s, a large part of that energy loss comes in the form of wave breaking and the turbulent dissipation that goes along with it. When breaking eventually happens, the wave peaks topple over the front face of the wave, and the 2D surface reconnects with itself, trapping gas inside as it does so.
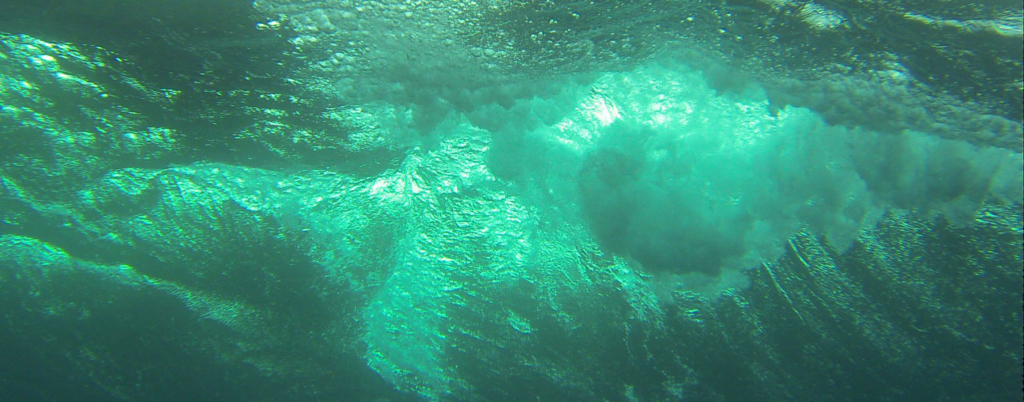
This is the origin of almost all ocean bubbles, and the foam patch we see at the surface (known as a whitecap) is only a small part of the story. Beneath the surface, these small trapped pockets of the atmosphere have a complex existence: some travel downwards for many metres and last for many minutes, and some last for less than a second before rejoining the atmosphere.
Each individual bubble is a tiny object in a vast ocean, but together they influence the upper ocean in four main ways. First, bubbles strongly affect ocean acoustics because air is so much more compressible than water – they generate sound when they form and scatter sound afterwards. Second, bubbles change the colour and transparency of the ocean because they scatter light. Third, they act as small vehicles transporting gases through the ocean surface in both directions. Fourth, if they rise to the surface and burst, they spit tiny liquid droplets up into the sky. The aerosol particles formed in this way scatter light (sometimes causing haze) and may drift high enough to act as cloud condensation nuclei.
All this means that the existence of this simple object has complex consequences: a bubble, after all, is just a trapped pocket of air. But before you can understand all that complexity, you have to know how many bubbles there are and what they’re up to, and even that is tricky.
When stormy seas are ideal The last time I was at sea, in the autumn of 2013, we were in the North Atlantic during storm season. Our main focus was air–sea gas transfer: watching the ocean breathe. About 30% of all the extra CO2 that humans are putting up into the atmosphere ends up in the ocean, largely because it’s soluble and if you increase the concentration gradient, more will dissolve. There’s a constant global exchange of CO2 between atmosphere and ocean, but in the North Atlantic storm season, it’s mostly from the air into the water. Our expedition was funded to test current understanding of different gases moving through the ocean surface, and how that depends on wind speed, wave state, bubbles, the water conditions and the weather, with a specific focus on CO2.
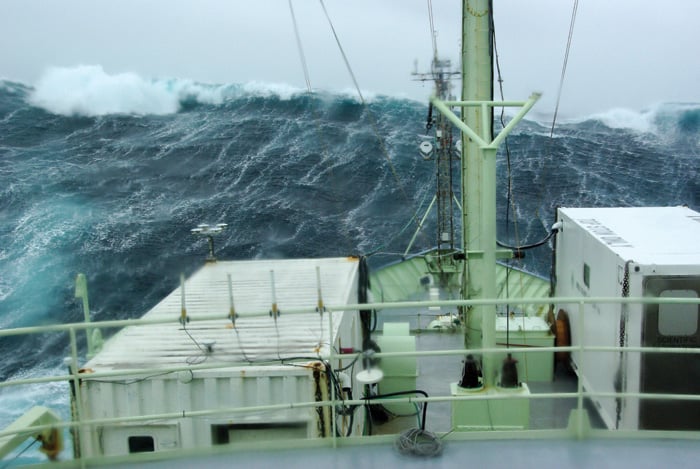
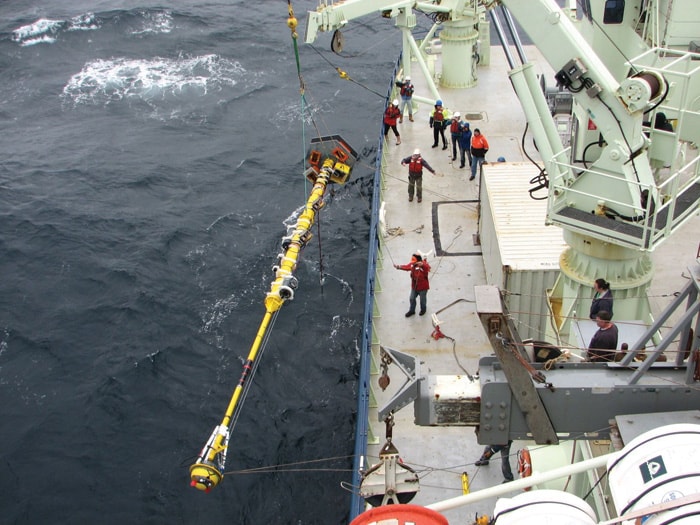
Our home for six weeks was an American vessel, the R/V Knorr, famous in oceanographic circles for being the ship that first sighted the submerged wreck of the Titanic in 1985. The strategy was simple: we would position ourselves in the path of as many storms as we could find, park the ship with its bow into the wind, and ride out each storm while measuring the gigantic gas exchange processes going on around us. And we got lucky – the weather co-operated with enthusiasm.
One of my defining memories of that trip is the chief scientist bouncing into breakfast on a day when very few people were bouncing anywhere, clutching the doorway as the ship rolled around him and delightedly reminding everyone about the average wind speed that morning: “65 knots, gusting up to 70!”. That’s about 120–130 km/h for anyone who likes metric units, and immensely awful for anyone who likes a peaceful life.
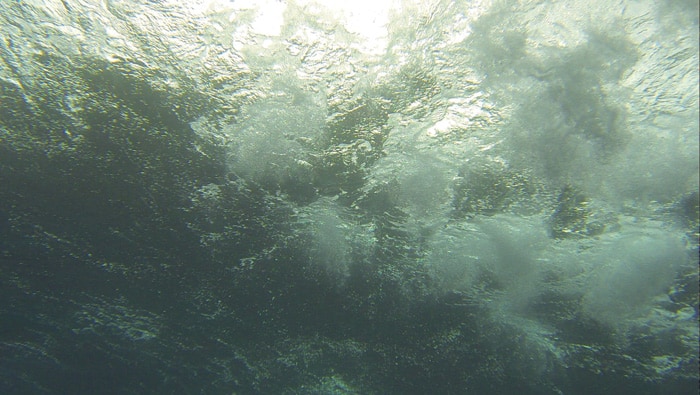
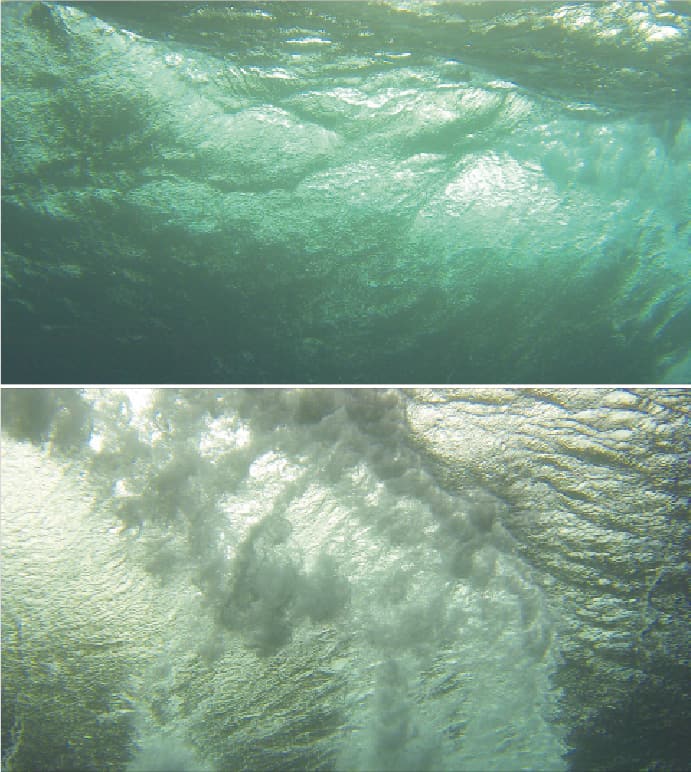
But I was happy too – I’d come to sea to measure bubbles, and bubbles there certainly were. It looked as though the surface of the ocean was blowing away, and under the foam, you could see the huge subsurface bubble plumes. My only worry was about whether my bubble detectors were working properly, but there was nothing I could do about it. They were floating freely away from the ship, on a big yellow buoy, left to their own devices until the storm was over.
The journey of a bubble
There’s no universal method for measuring bubbles at sea, and that’s because the important mechanisms operate over about six orders of magnitude in time (0.1 ms – 100 s) and five in space (0.1 mm – 10 m). Just after a wave breaks, any large bubbles around are smashed apart by the strong turbulence underneath the breaking wave. For the first second, the shear stress associated with the turbulence stretches and distorts the new air pockets, and any bubbles larger than about a millimetre in size are likely to fragment. Bubbles smaller than that will probably remain intact, because surface tension reduces bubble distortion.
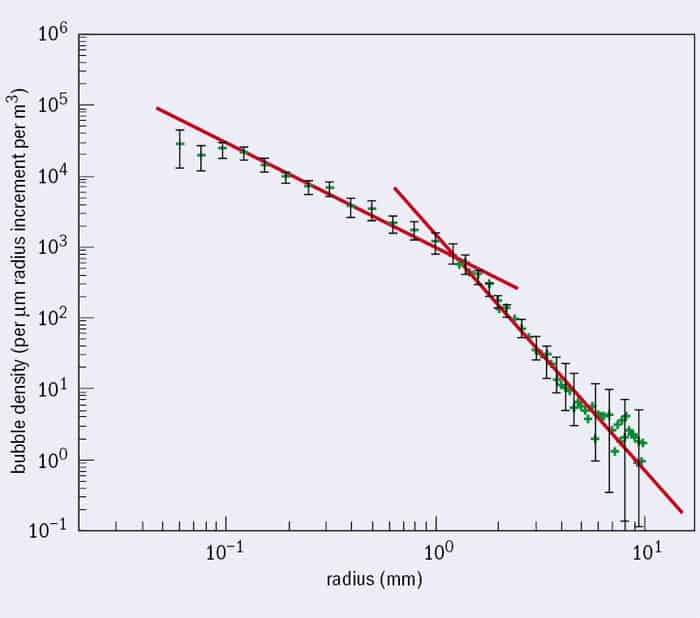
The process of fragmentation is still poorly understood, but it leaves behind a bubble population with a very specific size distribution (figure 1), first identified by Grant Deane and Dale Stokes from the Scripps Institution of Oceanography in San Diego, US, in 2002. There’s a kink in the slope – bubbles larger than about a millimetre are formed by the fragmentation cascade, but the smaller ones have a different size distribution. Those are probably formed by thin sheets of air breaking up into thousands of tiny bubbles – what’s known as “Mesler entrainment”.
The turbulence dissipates quickly, and from now on, the game is just to follow what happens to this initial population. One second after the wave breaks, these bubbles are what you’ve got – the bubbles won’t break apart or join together after the intense turbulence has finished. Ocean bubbles have the odd characteristic of not coalescing – they tend to bounce off each other instead. We’re not entirely clear why this is the case but it’s to do with charge distribution on their surface. This is why you see white foam patches on the ocean but not on freshwater lakes – in the lake, bubbles join together, rise and burst very quickly, leaving no trace. But in the salty ocean, bubbles stay separate and last long enough to form foam.
The fate of the initial bubble population varies. The bigger bubbles will rise quickly to the surface, form those foam patches and burst. The smaller bubbles are just carried along with the water flow, perhaps reaching several metres in depth (the deepest bubble plumes recorded have been during hurricanes, extending around 25 m). They exchange gases in both directions across their surface – especially important for less soluble gases such as oxygen – and are likely to dissolve completely, although a few may find their way back to the surface.
Bubble watching
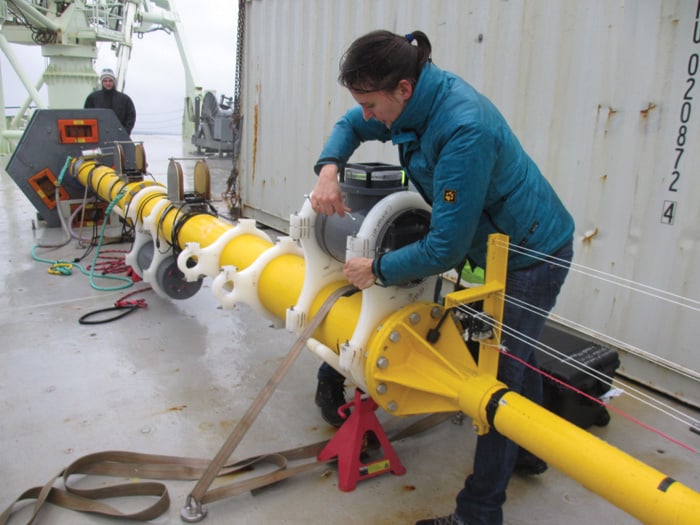
So when it comes to following all this, apart from the practical difficulties caused by the storm, you need a variety of measurement strategies just to detect the bubbles. For the big bubbles in the young plume, you need high-speed photography to follow them being smashed apart. For the deeper plumes, we use acoustics because bubbles scatter sound in a way that depends on their size. Small-scale acoustic resonators can measure the bubbles in a volume perhaps 20 cm across, while upward-pointing sonar gives you a view of the entire bubble plume shape, usually many metres wide.
This is the combination that I had on the Knorr – a specialized camera 2 m below the surface, acoustical resonators to measure bubble size distributions 4 and 6 m down, and a sonar right at the bottom, 8 m below, looking up towards the surface. On other expeditions, novel optical techniques such as holography, light scattering and diffraction have also played a role. They’ve got the side benefit of providing unexpectedly beautiful pictures of nearby zooplankton, but they’re still limited in the range of bubbles they can measure. The icing on the cake of difficulty is that the detectors for these fragile and fleeting tiny bubbles have to withstand being thumped by (literally) tonnes of ocean.
But we’re learning. We know that the biggest bubbles probably stay in the top metre or two, and that these are the most important vehicles for CO2 transfer into the ocean. We’re starting to separate out the effects of turbulence stirring the water and the bubbles themselves, when it comes to how gases are transferred across the surface. We know that bubbles probably don’t matter very much at all for some gases (like dimethylsulphide) and matter a lot for others (CO2). We are getting better at detecting the fraction of ocean covered in whitecaps from satellite images, and connecting this to our knowledge of what’s happening at the surface. We’re starting to understand how to build accurate mathematical models of gas transfer and aerosol production, and to feed this approach into weather and climate models.
There are still huge gaps in our knowledge, though. We still know very little about the structure of bubble plumes, and how they vary as the ocean conditions change. Getting to sea in a ship with enough auxiliary measurements to make sense of the bubble data is a rare treat, and there have only been a handful of research cruises dedicated to understanding these processes.
The single biggest unknown in this field is the effect of natural ocean surfactants: general crud in the water (that word isn’t as facetious as it sounds – it’s commonly called gelbstoff, the German for “yellow stuff”). The surface ocean is full of gel particles, long-chain carbohydrates, lipids, proteins, dust, bacteria, viruses and fragments of anything that has been chucked out by single-celled organisms or broken down from larger components. All of these will stick to bubbles, stabilizing them.
They’ll also be spat upwards in aerosol particles, adding to the diverse particulate population in the atmosphere. But this aspect of ocean chemistry is frustratingly fickle and often varies over tens of metres. If you ask an ocean chemist about the organic material in the water sample you’ve just presented them with, they’ll make a face, suck in their cheeks, and tell you in no uncertain terms that it’s complicated. But when it comes to how long bubbles last, what they transport and how they interact, that chemistry matters. The last few years have seen much better techniques for sampling these surfactants at sea, and I’m hopeful that it will all look a lot less mysterious 10 years from now.
A tapestry of sciences
The oceans feel a very long way from most of us, but the more we learn about it, the more we appreciate how interconnected this giant engine is. Its biology, physics and chemistry are woven together, and even the details like the surface bubbles have a significant role to play. Our current focus is on improving our understanding of the way that this engine works right now, and we’re still only just getting to grips with the basic mechanisms at work.
But models based on this understanding are going to become increasingly important in the future. The ocean currently acts as a huge sink for anthropogenic CO2, but it’s not clear that it will continue to do so at the same rate in the future. Having accurate models of CO2 transport that are based on tested physical mechanisms will make a huge difference to our ability to predict future changes. The aerosols produced by bubbles affect cloud formation, and as ocean biology changes, the aerosols may too. As the extent of summer sea ice in the Arctic Ocean continues to reduce, that newly open ocean will start to see more breaking waves and bubbles, and more aerosol production.
But how will that affect the weather near the pole, and what consequences will it have for those of us living at lower latitudes? A single bubble is a tiny and insignificant entity, but all the oceans of the world produce enough bubbles to influence a planet. Understanding how and why is going to help us manage the interaction between our civilization and our planet. The legions of lost grub screws, abandoned and lonely on the deep ocean floor, are a small price to pay.