Major labs are used to dealing with large data volumes, but as data-intensive research becomes more common, Paul Kassebaum argues that physicists deserve better, more intuitive tools to manage it
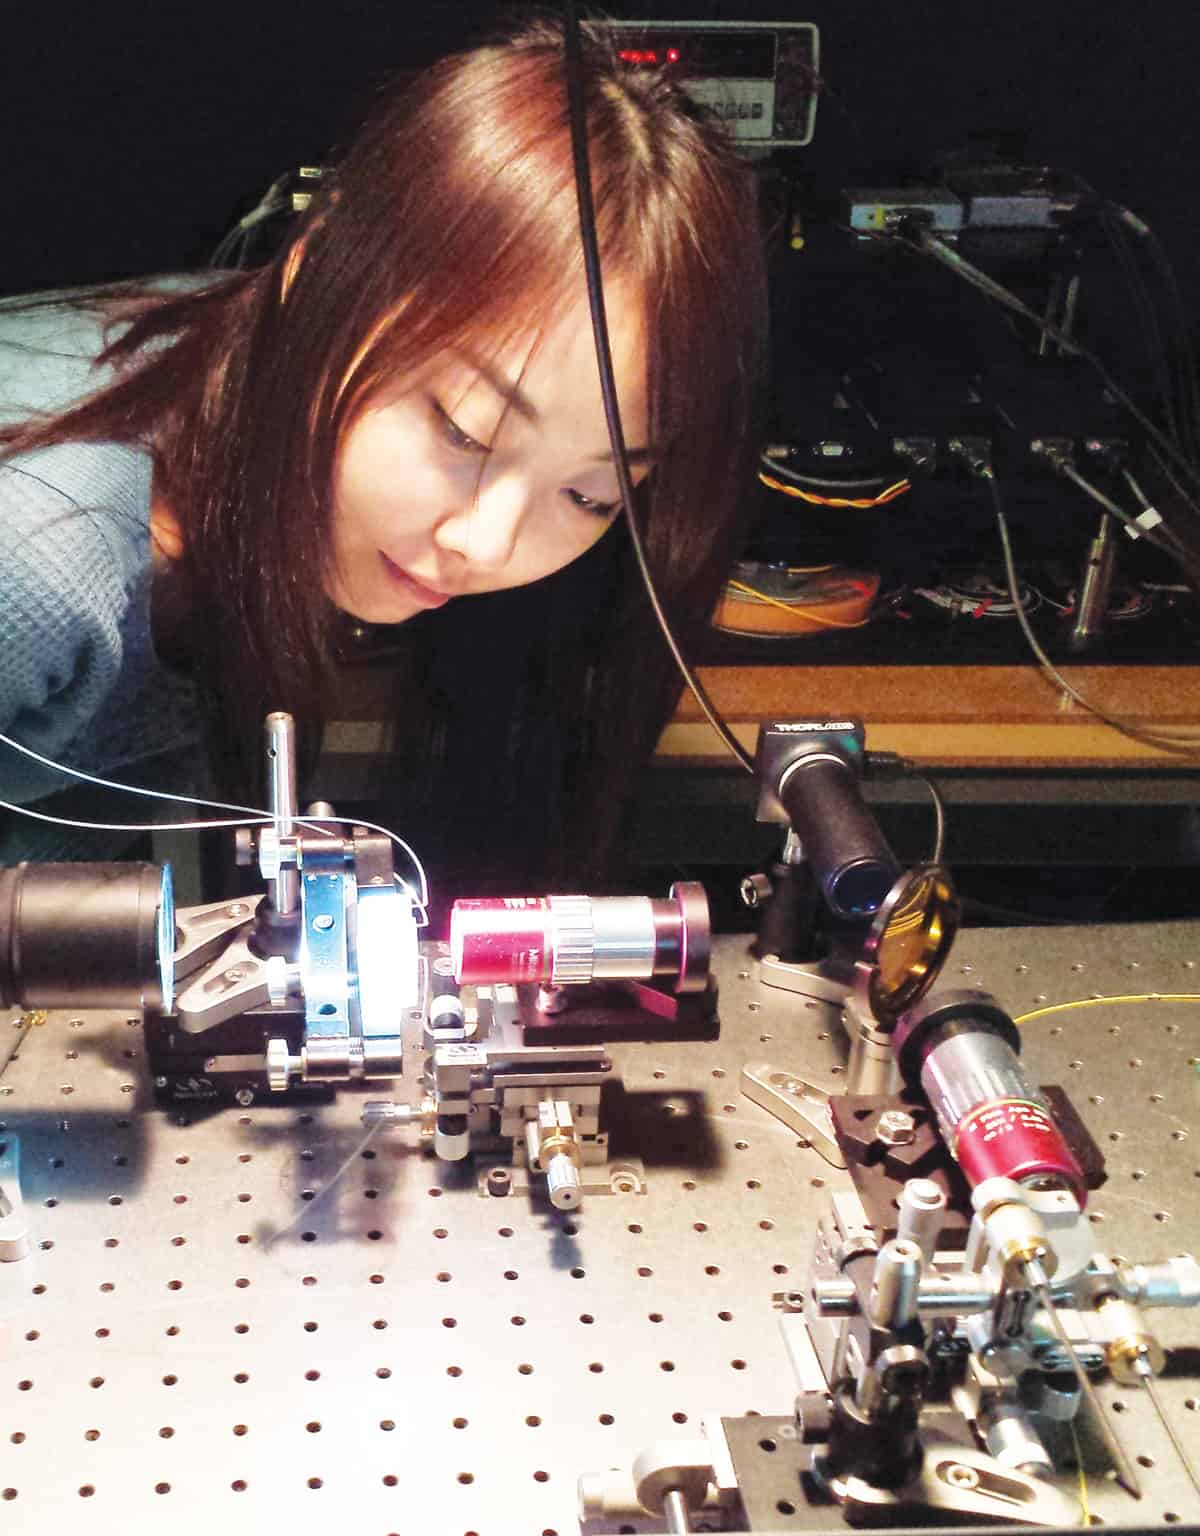
The Large Hadron Collider at CERN is one of the world’s largest scientific instruments. It captures 5 trillion bits of data every second, and the Geneva-based lab employs a dedicated group of experts to manage the flow. In contrast, the instrument shown here – known as a time-stretch quantitative phase imaging microscope – fits on a bench top, and is managed by a team of one. However, it is also capable of capturing an immense amount of data: 0.8 trillion bits per second.
These two examples illustrate just how ubiquitous “big data” has become in physics. Challenges once limited to huge machines managed by international teams are now beginning to crop up in small devices used by single researchers. Consequently, more physicists need to get comfortable with donning the hat of “data scientist”.
Acquiring the necessary skills is often framed as a daunting task, one that inspires some physicists to enrol in intensive boot camps over a series of weeks to learn an alphabet soup of disjointed, unfamiliar tools. However, physicists already have much of the conceptual understanding required to handle big data. All they need is for the computational tools they are already using to continue to work when their problem grows beyond the (somewhat arbitrary) point considered “big”. Physicists should not have to worry so much about the computing fabric that makes this possible.
Generating data
These two principles are the motivation behind the big data and machine-learning capabilities in MATLAB – the software that my company, MathWorks, produces. At the American Physical Society’s 2018 March meeting, I joined a series of speakers at a session entitled “Put Big Data in Your Physics Toolbox” to explain how these principles work in practice, using the time-stretch quantitative phase imaging (TS-QPI) microscope as a case study.
Bahram Jalali, a photonics expert at the University of California, Los Angeles (UCLA), his then PhD student Claire Lifan Chen and postdoc Ata Mahjoubfar built their TS-QPI microscope with the aim of imaging every cell in a 10 mL blood sample and determining which of these cells are cancerous. The cells in the sample are sent through a flow cytometer one at a time, at a rate of almost 100,000 blood cells per second; if the cells could be stacked end to end, that would equate to imaging about 1 m of cells per second. To capture clear images at such a torrential rate, their imaging system runs at 36 million frames – equivalent to 20 HD films – per second. Hence, a single small blood sample generates between 10 and 50 terabytes of data.
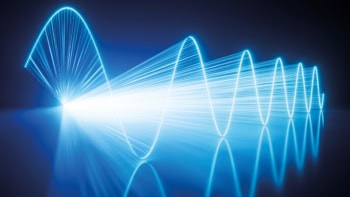
The physical infrastructure that enables their TS-QPI system to run at such a fast clip is interesting in its own right. The system creates a train of laser pulses with durations measured in femtoseconds. Lenses, diffraction gratings, mirrors and a beam splitter disperse these laser pulses into a train of multifrequency “rainbow” flashes that illuminate the cells passing through the cytometer. The spatial information for each cell is encoded in the spectrum of a pulse, and the optical signal is then intentionally dispersed as it is sent through a waveguide, imposing varying delays to spectral components at different wavelengths and stretching the signal enough to enable it to be digitized using a standard electronic analog-to-digital converter.
Manipulating and exploring data
All told, Jalali, Mahjoubfar and Chen extracted more than 200 numerical measurements from each cell in their sample. These data were grouped into three categories: morphological features that characterize the cell’s size and shape; optical-phase features that correlate with the cell’s density; and optical-loss features that correlate with the size of organelles within the cell. The result was a staggeringly large dataset. Fortunately, MATLAB intelligently and transparently breaks down these data into small chunks, allowing operations that can incorporate the entire dataset. This means that common expressions, such as A+B, will still work even with big datasets.
Another helpful trick is to define such data as MATLAB “tall” arrays, rather than in-memory arrays. Unlike in-memory arrays, tall arrays typically remain unevaluated until you request that the calculations be performed using the “gather” function. This so-called deferred evaluation allows you to work quickly with large datasets. When you eventually request output using gather, MATLAB combines the queued calculations where possible and takes the minimum number of passes through the data. Better still, all the subsequent code written for small in-memory data will automatically work on the big-data versions: no code changes and no special techniques are required.
The UCLA researchers sought to develop a supervised machine-learning model that could classify cells as either healthy or cancerous
To generate these tall arrays of numerical measures of cells, Jalali and his colleagues used the MATLAB API for Python to integrate a specialized open-source cell image analysis package with more general workflows supported by MATLAB’s Image Processing Toolbox. Since every image was processed the same way to extract their features, they could use a parallel for-loop, “parfor”, to run their image-processing iterations concurrently on their 16-core processor with MATLAB’s Parallel Computing Toolbox. This reduced the time needed to complete their analysis from eight days to approximately half a day.
Incorporating machine learning
Machine learning comes in two flavours. One is unsupervised learning, where an algorithm finds hidden patterns or intrinsic structures in input data. The other is supervised learning, where an algorithm is “trained” on known input and output data and then uses the resulting model to generate reasonable predictions for outputs based on new data. In their work, the UCLA researchers sought to develop a supervised machine-learning model that could classify cells as either healthy or cancerous. A principal benefit of MATLAB is the ability to test a wide variety of machine-learning models in a short amount of time, so the pair used the software’s Statistics and Machine Learning Toolbox to compare three classification algorithms – naive Bayes, support vector machine (SVM) and logistic regression (LR) – before selecting the most useful.
Jalali’s group also explored deep- learning methods to create their predictive model. Deep learning is a specialized form of machine learning. With a deep-learning workflow, relevant features are automatically extracted from images. In addition, deep learning performs “end-to-end learning” – in which a network is given raw data and a task to perform, such as classification, and it learns how to do this automatically.
Although Jalali’s lab trained their network from scratch, most deep-learning applications use “transfer learning” instead. In this method, the idea is to start with an existing pre-trained network, such as AlexNet or GoogLeNet, then fine-tune it by feeding new data that contain classes pertaining to your problem. After making some tweaks to the network, you can then ask it to perform a new task, such as categorizing cancerous or normal cells instead of, say, dogs and cats (a real example from AlexNet’s set of classes). This requires much less data – you might end up processing thousands of images, rather than millions – and thus less time.
Jalali, Mahjoubfar and Chen got all their machine-learning models to perform with greater than 85% accuracy. They then pushed their deep-learning model’s accuracy above 95% by combining their third-party deep-learning package seamlessly with MATLAB to perform a global optimization of the receiver operating characteristics: the true positive rate versus the false positive rate at various discrimination threshold settings.
The UCLA team’s work – inventing a novel cancer-detecting microscope, and then using specialized tools within MATLAB to process their data – represents a good example of how data-science techniques and workflows can be integrated into small laboratories. The tools that were once distributed among teams of experts, or were found in the toolbelts of just a handful of researchers, are now increasingly available even to scientists who skipped the boot camp and jumped straight into making their big data work for them.