What is the actual structure of graphene oxide nanoflakes? This question is important for optimizing the properties of the carbon material in real-world applications, and researchers at CSIRO in Australia have now tried to answer it using machine learning. Their approach uses over 20,000 possible structure candidates to find truly representative models and is very different to existing predictive techniques, which are often based on single or limited numbers of model structures.
Graphene oxide (GO) is a hydrophilic, 2D oxidized form of graphene (a sheet of carbon just one atomic layer thick) with oxygen functional groups decorating and disrupting the sp2 basal plane of the material, which ranges in size from a few nanometres to a few millimetres. The first model of GO’s structure, proposed in 1939, suggested that the oxygen was bound to a hexagonal carbon sheet by epoxy (1,2-ether) and had the formula C2O. Researchers have been revising this model ever since, taking into account sheet wrinkling, for example, and the presence of axially-bound functional groups that distort the flat GO structure.
In 1998, scientists proposed the Lerf-Klinowski model. In this description of GO, all the carbon rings are perfect (six-membered), and out-of-plane spatial distortions caused by functional groups or intrinsic ripples are essentially ignored. Although instructive, this model is rather limiting, and it it is also largely inconsistent with structures obtained either by computational modelling of GO or by electron microscopy images.
Unsupervised machine learning techniques
Researchers led by Amanda Barnard of Data61 at CSIRO have now revisited the structure of GO using a new clustering algorithm developed in their laboratory and have predicted centroid structures that are truly representative of the material. To extract archetypes, they performed analyses based on the unsupervised algorithm first put forward in 1994 by Cutler and Breiman.
“Theoretically, the archetypal analysis technique finds points in the feature space of the material that are on the boundary of the convex hull of the data cloud,” explains study lead author Benyamin Motevalli. “This means that all possible candidate materials can be described as linear combinations of these archetypal (pure) points. The approach can even predict archetypal structures not included in the data set.”
Clustering is also an unsupervised technique that finds patterns in the data set and group structures based on similarity, he tells Physics World.
The input data
The researchers gathered their input data by creating a wide range of flake sizes, and shapes. They then varied the oxygen concentrations in the flakes and added different chemical groups, distributed in different ways.
The data set contains 20,396 samples in all with surface areas ranging from 320 Å2 to 2457 Å2. These samples contain hydroxyl, ether, double bonds, aliphatic (cyclohexane) groups, and significant out-of-plane distortions (caused by defects) that go beyond the Lerf-Klinowski model.
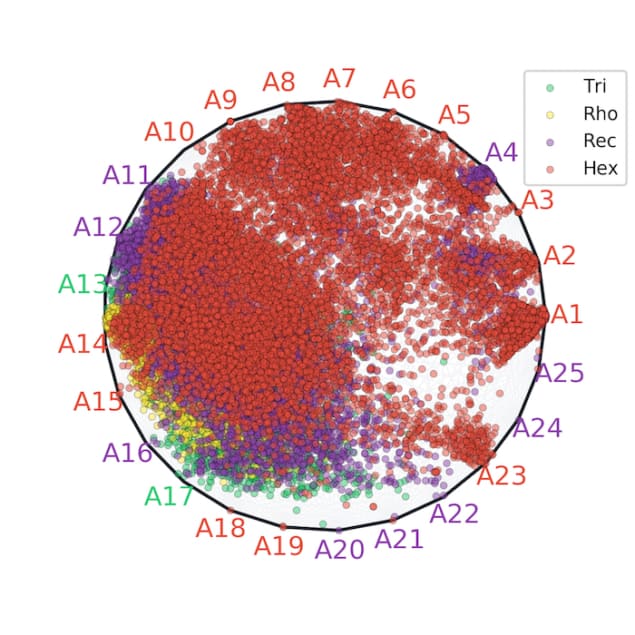
The team included four different flake morphologies: hexagonal (49.5 %), trigonal (14.3 %), rectangular (30.5 %), and rhombic (5.7 %). The total number of atoms in each sample varies from 191 to 1949 and includes C, H, and O atoms. Different ratios of armchair and zigzag edges were also incorporated into the data set.
“The density and distribution of oxygen groups have a significant role in deriving GO properties, so for each of the 24 primary pristine graphene nanoflakes, we sampled numerous O/H concentrations, each with hundreds of random distributions,” explains Motevalli. In each case the O/C ratio was between 4.05% to 52.08%, and the H/C ratio between 2.22% to 49.26%.
28 structures can replace 20,396 samples
Using this method, the researchers identified three representative GO nanoflakes that are effectively the “average” structure in 223-dimensional space.
The say they also identified 25 “pure” GO nanoflakes structures that capture all of the complexity and diversity of the entire 20396 data set they begin with. These 25 structures can be used as linear combinations to represent the whole set.
“Together these 28 structures (the 25 structures and the three porotypes) can replace the 20,396 samples with no loss of information,” says Motevalli. “They can also be used as single model structures with the right chemical composition.”
Each structure is available for download at: https://doi.org/10.25919/5d1304152364a.
A machine-learning revolution
Removing guesswork and bias
“Our 20396 GO nanoflake structures required years of work and over 30 million core supercomputer hours to generate at the electronic structure level,” he explains. “Reducing this set to the 28 most important structures will enable other research groups to make predictions on GO that are representative and reliable in a fraction of this time.”
The approach also removes the guesswork and bias in computational models of GO and provides the consistency necessary for benchmarking, he adds. “If all researchers working on GO used the same model structures, we could then easily compare and correlate results from laboratories all around the world.”
The researchers plan to use supervised machine learning to explore GO structure and property relationships and predict how different types of samples should perform under different conditions and in different applications. “Examples include electronic charge transfer properties, or studying the role of defects and distortions and how they affect fault tolerance,” Motevalli says.
The group’s findings appear in Nano Futures, which (like Physics World) is published by IOP Publishing.


